MACD Forecast [Titans_Invest]MACD Forecast — The Future of MACD in Trading
The MACD has always been one of the most powerful tools in technical analysis.
But what if you could see where it’s going, instead of just reacting to what has already happened?
Introducing MACD Forecast — the natural evolution of the MACD Full , now taken to the next level. It’s the world’s first MACD designed not only to analyze the present but also to predict the future behavior of momentum.
By combining the classic MACD structure with projections powered by Linear Regression, this indicator gives traders an anticipatory, predictive view, redefining what’s possible in technical analysis.
Forget lagging indicators.
This is the smartest, most advanced, and most accurate MACD ever created.
🍟 WHY MACD FORECAST IS REVOLUTIONARY
Unlike the traditional MACD, which only reflects current and past price dynamics, the MACD Forecast uses regression-based projection models to anticipate where the MACD line, signal line, and histogram are heading.
This means traders can:
• See MACD crossovers before they happen.
• Spot trend reversals earlier than most.
• Gain an unprecedented timing advantage in both discretionary and automated trading.
In other words: this indicator lets you trade ahead of time.
🔮 FORECAST ENGINE — POWERED BY LINEAR REGRESSION
At its core, the MACD Forecast integrates Linear Regression (ta.linreg) to project the MACD’s future behavior with exceptional accuracy.
Projection Modes:
• Flat Projection: Assumes trend continuity at the current level.
• LinReg Projection: Applies linear regression across N periods to mathematically forecast momentum shifts.
This dual system offers both a conservative and adaptive view of market direction.
📐 ACCURACY WITH FULL CUSTOMIZATION
Just like the MACD Full, this new version comes with 20 customizable buy-entry conditions and 20 sell-entry conditions — now enhanced with forecast-based rules that anticipate crossovers and trend reversals.
You’re not just reacting — you’re strategizing ahead of time.
⯁ HOW TO USE MACD FORECAST❓
The MACD Forecast is built on the same foundation as the classic MACD, but with predictive capabilities.
Step 1 — Spot Predicted Crossovers:
Watch for forecasted bullish or bearish crossovers. These signals anticipate when the MACD line will cross the signal line in the future, letting you prepare trades before the move.
Step 2 — Confirm with Histogram Projection:
Use the projected histogram to validate momentum direction. A rising histogram signals strengthening bullish momentum, while a falling projection points to weakening or bearish conditions.
Step 3 — Combine with Multi-Timeframe Analysis:
Use forecasts across multiple timeframes to confirm signal strength (e.g., a 1h forecast aligned with a 4h forecast).
Step 4 — Set Entry Conditions & Automation:
Customize your buy/sell rules with the 20 forecast-based conditions and enable automation for bots or alerts.
Step 5 — Trade Ahead of the Market:
By preparing for future momentum shifts instead of reacting to the past, you’ll always stay one step ahead of lagging traders.
🤖 BUILT FOR AUTOMATION AND BOTS 🤖
Whether for manual trading, quantitative strategies, or advanced algorithms, the MACD Forecast was designed to integrate seamlessly with automated systems.
With predictive logic at its core, your strategies can finally react to what’s coming, not just what already happened.
🥇 WHY THIS INDICATOR IS UNIQUE 🥇
• World’s first MACD with Linear Regression Forecasting
• Predictive Crossovers (before they appear on the chart)
• Maximum flexibility with Long & Short combinations — 20+ fully configurable conditions for tailor-made strategies
• Fully automatable for quantitative systems and advanced bots
This isn’t just an update.
It’s the final evolution of the MACD.
______________________________________________________
🔹 CONDITIONS TO BUY 📈
______________________________________________________
• Signal Validity: The signal will remain valid for X bars .
• Signal Sequence: Configurable as AND or OR .
🔹 MACD > Signal Smoothing
🔹 MACD < Signal Smoothing
🔹 Histogram > 0
🔹 Histogram < 0
🔹 Histogram Positive
🔹 Histogram Negative
🔹 MACD > 0
🔹 MACD < 0
🔹 Signal > 0
🔹 Signal < 0
🔹 MACD > Histogram
🔹 MACD < Histogram
🔹 Signal > Histogram
🔹 Signal < Histogram
🔹 MACD (Crossover) Signal
🔹 MACD (Crossunder) Signal
🔹 MACD (Crossover) 0
🔹 MACD (Crossunder) 0
🔹 Signal (Crossover) 0
🔹 Signal (Crossunder) 0
🔮 MACD (Crossover) Signal Forecast
🔮 MACD (Crossunder) Signal Forecast
______________________________________________________
______________________________________________________
🔸 CONDITIONS TO SELL 📉
______________________________________________________
• Signal Validity: The signal will remain valid for X bars .
• Signal Sequence: Configurable as AND or OR .
🔸 MACD > Signal Smoothing
🔸 MACD < Signal Smoothing
🔸 Histogram > 0
🔸 Histogram < 0
🔸 Histogram Positive
🔸 Histogram Negative
🔸 MACD > 0
🔸 MACD < 0
🔸 Signal > 0
🔸 Signal < 0
🔸 MACD > Histogram
🔸 MACD < Histogram
🔸 Signal > Histogram
🔸 Signal < Histogram
🔸 MACD (Crossover) Signal
🔸 MACD (Crossunder) Signal
🔸 MACD (Crossover) 0
🔸 MACD (Crossunder) 0
🔸 Signal (Crossover) 0
🔸 Signal (Crossunder) 0
🔮 MACD (Crossover) Signal Forecast
🔮 MACD (Crossunder) Signal Forecast
______________________________________________________
______________________________________________________
🔮 Linear Regression Function 🔮
______________________________________________________
• Our indicator includes MACD forecasts powered by linear regression.
Forecast Types:
• Flat: Assumes prices will stay the same.
• Linreg: Makes a 'Linear Regression' forecast for n periods.
Technical Information:
• Function: ta.linreg()
Parameters:
• source: Source price series.
• length: Number of bars (period).
• offset : Offset.
• return: Linear regression curve.
______________________________________________________
______________________________________________________
⯁ UNIQUE FEATURES
______________________________________________________
Linear Regression: (Forecast)
Signal Validity: The signal will remain valid for X bars
Signal Sequence: Configurable as AND/OR
Table of Conditions: BUY/SELL
Conditions Label: BUY/SELL
Plot Labels in the graph above: BUY/SELL
Automate & Monitor Signals/Alerts: BUY/SELL
Linear Regression (Forecast)
Signal Validity: The signal will remain valid for X bars
Signal Sequence: Configurable as AND/OR
Table of Conditions: BUY/SELL
Conditions Label: BUY/SELL
Plot Labels in the graph above: BUY/SELL
Automate & Monitor Signals/Alerts: BUY/SELL
______________________________________________________
📜 SCRIPT : MACD Forecast
🎴 Art by : @Titans_Invest & @DiFlip
👨💻 Dev by : @Titans_Invest & @DiFlip
🎑 Titans Invest — The Wizards Without Gloves 🧤
✨ Enjoy!
______________________________________________________
o Mission 🗺
• Inspire Traders to manifest Magic in the Market.
o Vision 𐓏
• To elevate collective Energy 𐓷𐓏
🎗️ In memory of João Guilherme — your light will live on forever.
AUDUSD

VOLUME Simple [Titans_Invest]VOLUME Simple
A streamlined volume analysis tool crafted for simplicity and smart signal detection.
Although simple in appearance, this indicator brings intelligent volume-based entries through configurable logic. Its design emphasizes clean and effective interpretation of volume signals.
⯁ WHAT IS THE VOLUME INDICATOR❓
The Volume indicator is a fundamental technical analysis tool that measures the number of shares or contracts traded in a security or market during a given period. It helps traders and investors understand the strength or weakness of a price movement, confirm trends, and predict potential reversals. Volume is typically displayed as a histogram below a price chart, with each bar representing the volume traded during a specific time interval.
⯁ HOW TO USE THE VOLUME❓
The Volume indicator can be used in several ways to enhance trading decisions:
• Trend Confirmation: High volume during a price move confirms the strength of that trend, while low volume can indicate a weak or unsustainable trend.
• Breakouts: A price breakout from a pattern or range accompanied by high volume is more likely to be valid and sustainable.
• Divergence: When the price moves in one direction and volume moves in the opposite direction, it can signal a potential reversal.
• Overbought/Oversold Conditions: Extreme volume levels can sometimes indicate that an asset is overbought or oversold, though this is less straightforward than with oscillators like the RSI.
⯁ ENTRY CONDITIONS
The conditions below are fully flexible and allow for complete customization of the signal.
______________________________________________________
🔹 CONDITIONS TO BUY 📈
______________________________________________________
▪︎ Signal Validity: The signal will remain valid for X bars .
🔹 volume > volume_MA * Trigger Signal (close > open)
🔹 volume > volume_MA * Trigger Signal (Keep State)
______________________________________________________
______________________________________________________
🔸 CONDITIONS TO SELL 📉
______________________________________________________
▪︎ Signal Validity: The signal will remain valid for X bars .
🔸 volume > volume_MA * Trigger Signal (close > open)
🔸 volume > volume_MA * Trigger Signal (Keep State)
______________________________________________________
______________________________________________________
🤖 AUTOMATION 🤖
• You can automate the BUY and SELL signals of this indicator.
______________________________________________________
______________________________________________________
⯁ UNIQUE FEATURES
______________________________________________________
Signal Validity: The signal will remain valid for X bars
Condition Table: BUY/SELL
Condition Labels: BUY/SELL
Plot Labels in the Graph Above: BUY/SELL
Automate and Monitor Signals/Alerts: BUY/SELL
Signal Validity: The signal will remain valid for X bars
Table of Conditions: BUY/SELL
Conditions Label: BUY/SELL
Plot Labels in the graph above: BUY/SELL
Automate & Monitor Signals/Alerts: BUY/SELL
______________________________________________________
📜 SCRIPT : VOLUME Simple
🎴 Art by : @Titans_Invest & @DiFlip
👨💻 Dev by : @Titans_Invest & @DiFlip
🎑 Titans Invest — The Wizards Without Gloves 🧤
✨ Enjoy!
______________________________________________________
o Mission 🗺
• Inspire Traders to manifest Magic in the Market.
o Vision 𐓏
• To elevate collective Energy 𐓷𐓏

Currency Strength Index by zdmreCurrency strength expresses the value of currency. For economists, it is often calculated as purchasing power, while for financial traders, it can be described as an indicator, reflecting many factors related to the currency; for example, fundamental data, overall economic performance (stability) or interest rates.
The method used in this indicator is its strength against the US Dollar (xxxUSD)
Currencies:
EUR
GBP
AUD
NZD
JPY
CNY
CAD
Your Symbol (Optionally) defval: TRYUSD
You can also optionally add a symbol. However, this unit must be in the form of xxxUSD

SWING for GOLD / BITCOIN Hey everyone
I want to share my swing trading system with you.Based on two moving averages coupled to RSI
The options
Shows current trends and entries for trades. Average trade retention 15-20 days
Entries for trades with a crossover of two lines
The percentage of successful test deals XAU/USD for 2010-2021: 69%

[RickAtw] ZONE Trend 3█ OVERVIEW
This indicator tracks current trends. Trends are determined by the zones created for them, the brighter the zone, the higher the probability of a market reversal.
█ FEATURES
The indicator adapts to any market.
You can set your own values for your system
Any timeframe can be used
You can increase the number of zones
█ HOW TO USE
If the market starts to enter the red zone, open buy and hold until the second or third zone.
If the market moves towards the blue zone, we sells and hold until the next zone.
█ The author of the work
Rick Atwood
ROC of Majors against the USD (Label)Version 2 of the ROC study that now puts them as a label on the same chart.
ROC of Majors against the USDA simple study that shows the majors against the USD Rate of Change.
Allows you to pick opposing strength pairs to trade.
There are different ROC calculations for people to play with as I am not sure which way the ( ) should be so feedback is welcome.
[RickAtw] O1 Opening Market LineThis indicator helps to identify current support and resistance based on the opening of the Asian, London and New York sessions.
Function
You can make good trade entries based on these lines. Shows daily and weekly openings of each session
It will also help you to look at which session you are currently trading)
Purple ----> Asian session
Red ----> London session
Blue ----> New York session
Key Signal
buy ---> A strong buy signal is a bounce from the low and the presence of a weekly or day open line.
sell ---> A strong sell signal is a bounce from the maximum and the presence of a weekly or day open line.
P.S. Be sure to test on your pair!
Remarks
This will help you determine the approximate area of support and resistance.
Since we cannot look into the future, it does not inform you about the exact records, but a possible change in trends.
Readme
In real life, I am a professional investor. And I check each of my indicators on my portfolio and how effective it is. I will not post a non-working method. The main thing is to wait for the beginning of trends and make money!
I would be grateful if you subscribe ❤️

Amazing scalper for majors with risk managementHello,
Today I am glad to bring you an amazing simple and efficient scalper strategy.
Best suited for 1M time frame and majors currency pairs.
Its made of :
Ema (exponential moving average) , long period 25
Ema(exponential moving average) Predictive, long period 50,
Ema(exponential moving average) Predictive, long period 100
Risk management , risking % of equity per trade using stop loss and take profits levels.
Long Entry:
When the Ema 25 cross up through the 50 Ema and 100 EMA. and we are in london or new york session( very important the session, imagine if we have only american or european currencies, its best to test it)
Short Entry:
When the Ema 25 cross down through the 50 Ema and 100 EMA, and we are in london or new york session( very important the session, imagine if we have only american or european currencies, its best to test it)
Exit:
TargetPrice: 5-10 pips
Stop loss: 9-12 pips
Hope you enjoy it :)


HL2 - 22 EMA Cross for RenkoEURUSD
This is a simple strategy to use for those who like Renko bars. I ONLY use it on Renko.
Basic idea is that when the Renko bar closes above or below the 22 EMA, you go long or short.
However, some of the frustrations I've had with any strategy shared in Tradingview is so few folks put in the ability to set a stop or a profit target or the ability to set a specific time to trade. I have added those to this strategy. (And I for the life of me can not remember where I got the code for the the time, I need to find you!).
Special note: If you have never used the Renko bars in Tradingview, make sure you click the Format option next to whatever pair you are looking at and change it from Traditional to ATR. You can set it for a static pip amount if you want. But ATR at first will help you decide which amount of pips you should throw in.
This is my first published strategy so if I screwed up on anything or didn't explain it very well, please let me know!!

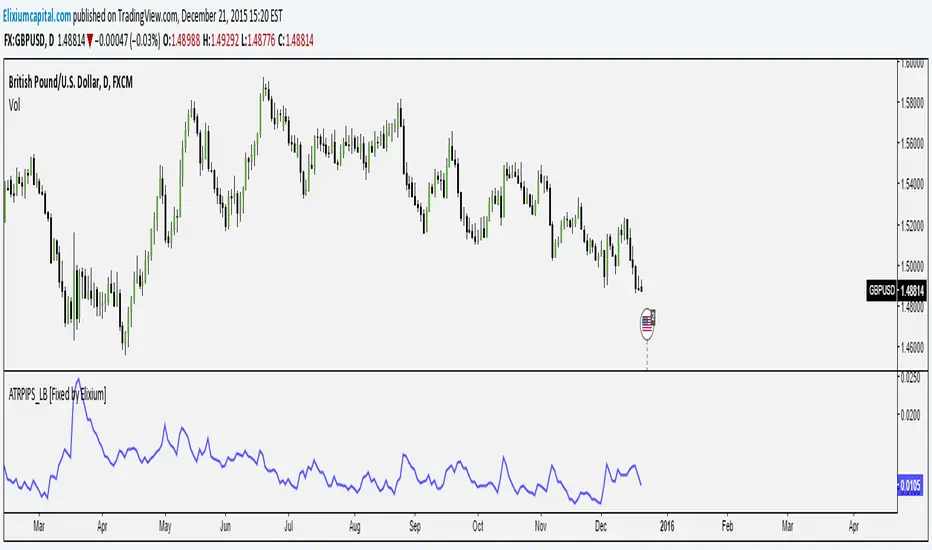
ATR Pips [LazyBear] [Fixed by Elixium]This is ATR in pips. This was requested by user @ElixiumCapital on Twitter. ATRPIPs in his words:
How to use: Change the chart to the Daily time frame. The indicators value e.g. 0.0105 means that the average daily range of the past 5 trading days is 105 pips. (On standard pairs like EURUSD, GBPUSD)
"ATR PIPs is useful for finding markets with your desired amount of volatility, for example I prefer to trade forex pairs with the highest amount of volatility in the past 5 days, setting the length parameter to 5 days. And setting my stop loss at 25% to 33% of the the indicators value."
Fixed: Default parameters and a critical bug.