Megalodon Pro Bollinger Scalper SetUpIt is designed to find scalping opportunities. It combines Megalodon Pro Bollinger Band Calculator and another momentum tool to enter and exit positions.
Usage
Follow the green and red color changes to buy and sell, respectively. You may also set your alarms and start automate your trading via alarms.
Settings
Setting 1 defines buy below level for Bollinger Band Calculator.
Setting 2 defines sell above level for Bollinger Band Calculator.
Enlightening the modern investors
~Bo Bugra Sukas
Use the links below at the signature part to get access to these indicators.
Automatedtrading

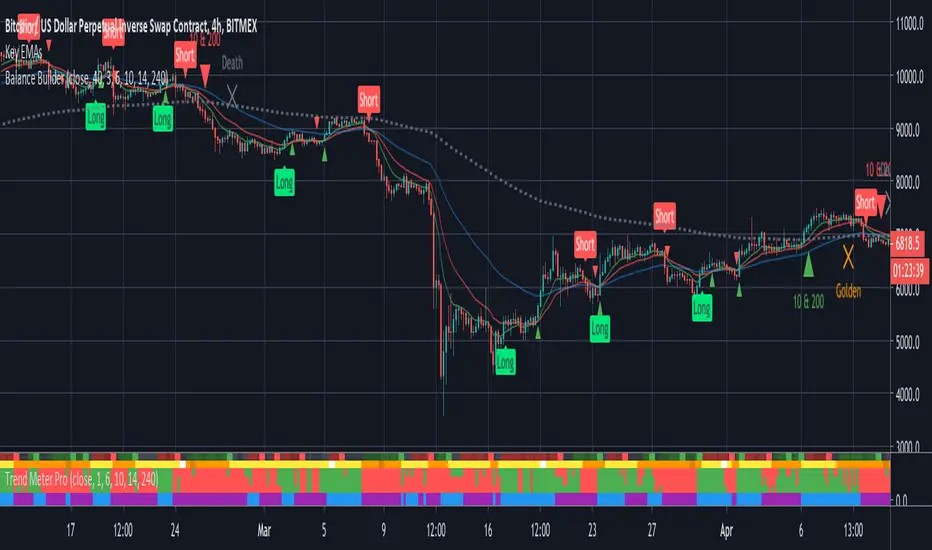
Balance BuilderBalance Builder is the culmination of everything I've learned over the last few years and will be my exclusive FOREX and crypto trading indicator going forward. I will be developing and updating it on a regular basis.
The unique signals it generates do not repaint, nor do they lag. What you are seeing is real-time and will not change once the current candle closes.
This technology analyses trend strength, momentum and the outcome of previous candles to determine the best time to accurately go long or short.
Use the labels to influence your own manual trading decisions or enable the built in alerts to hook in to your trading bot of choice and automatically trade around the clock.
The system can be applied to any instrument but the defaults are tuned for trading Bitcoin on the 4 hour chart. Higher time frames such as this are recommended to increase the win-rate but the parameters can easily be tweaked to cater for shorter term trading.
Important: I personally use Heikin Ashi candles with this script to further filter entries. An option is available within the script settings to toggle this on/off should you wish to do the same.
This is a premium script. Please DM me for access.
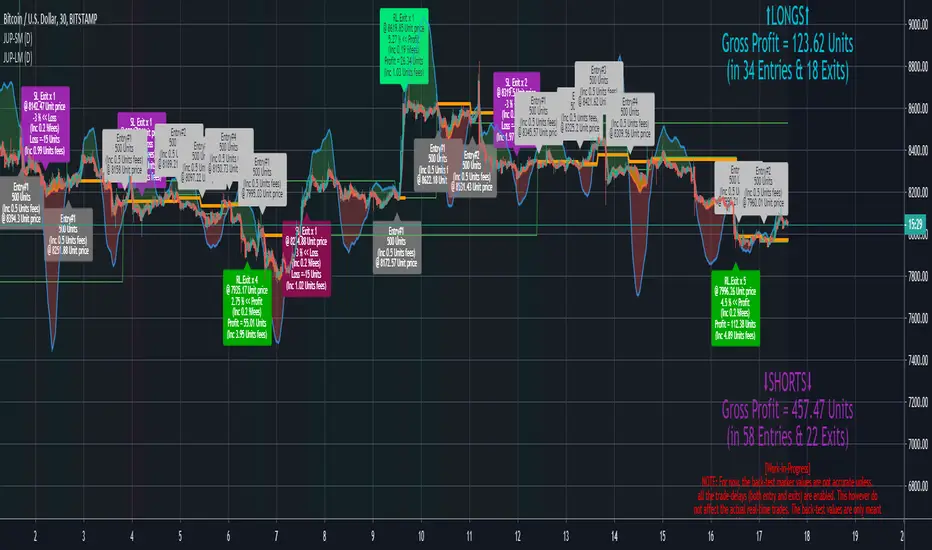
[BT] - Manual TSSL [ALERTS] v1Manual TSSL - V1
Enter the market on your own, and use this script to alert you when to sell. I found myself many times in position but wanted a script to help automatically exit the market when I stepped away.
Directions
You must provide the timestamp and price in the settings. Adjust the TSSL settings, make sure you leave enough room so the market can breath. Once the price goes below the bottom TSSL red line, is when the alert will trigger. Added some labels to keep track of the buy/sell and when the bottom TSSL price moves up.
If you like this idea, but would like another indicator instead of TSSL, please feel free to message me directly.
Thanks for looking!

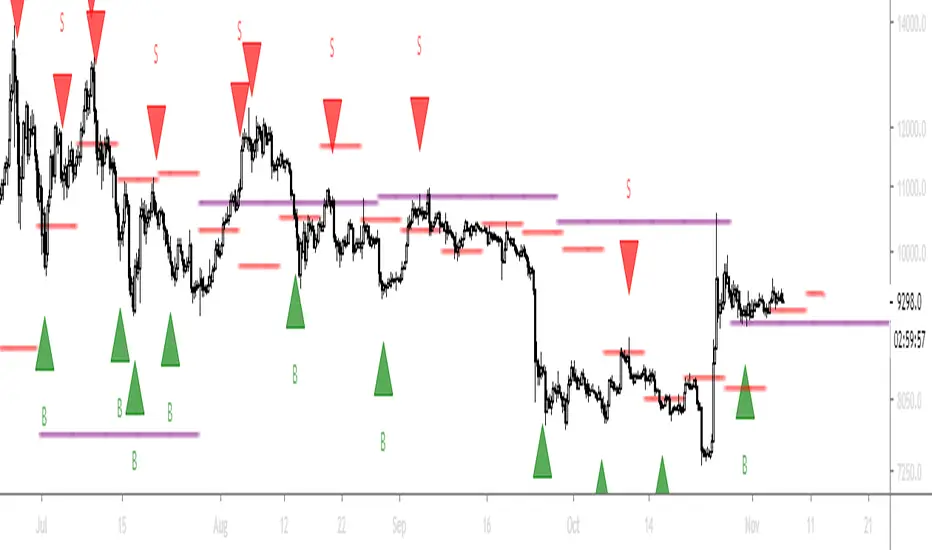
Triton [BTC] [30m]Triton strategy was built by Stalex Bot developers and can be used on their platform. The backtest of this strategy showed a portfolio growth of almost 600% in the span of a year, beating Bitcoin by 167%. This strategy is just for trading BTC/USDT on the 30m candlestick chart.

CYBER ENSEMBLE {PREVIEW}This is the PREVIEW version of CYBER ENSEMBLE
The subscription based PREMIUM version is found here:
Please PM me for access information.
Signals for the last 5 days are disabled.
Signal Alerts are disabled.
===============
CYBER ENSEMBLE is a sophisticated signalling script base on the interplay of an ensemble of optimized indicators and market state filters.
(>1000 lines of code)
Users are advised to manually back-test and optimize the settings for a particular chart and time frame, before proceeding with its use.
The algorithms will be periodically updated to further optimize and improve their performances, and new algorithms may be tested and added in the future.
Note: In no way is this intended as a financial/investment/trading advice. You are responsible for your own investment/trade decisions.

CYBER ENSEMBLE {PREMIUM}CYBER ENSEMBLE is a sophisticated signalling script base on the interplay of an ensemble of optimized indicators and market state filters.
(>1000 lines of code)
Users are advised to manually back-test and optimize the settings for a particular chart and time frame, before proceeding with its use.
The algorithms will be periodically updated to further optimize and improve their performances, and new algorithms may be tested and added in the future.
Note: In no way is this intended as a financial/investment/trading advice. You are responsible for your own investment/trade decisions.
Please PM me for access information.


6Hours swingalgo by BiO-618Hey, I want to share you this algo I remade for a bullish market.
*It uses about 11 indicators, 3 of them made by me to avoid BUYs on the start of a big dump.
*It was added ghost pivots for weekly and monthly values, really useful!
Let me know any suggestion, I will keep working to improve it
THE QUANTUM TRADER BITCOINThe Quantum Trader is a Algorithmic Automated Trading System that trades XBTUSD and BTC/USD with an emphasis on minimizing risk.
This algorithm trades multiple of our individual algorithms in an attempt to have a large number of uncorrelated algorithms trading concurrently,
thereby smoothing out the equity curve in an attempt to provide more consistency in the returns.
The Quantum trader utilizes swing trading algorithms along with day trading algorithms which can enter positions either Long or Short, and
take profits either Long or Short depending on market characteristics.
The Quantum Trader was built for automated trading, but can be used for manual trading also.
The Quantum Trader was designed to be used with Heikin Ashi candles on 3H chart. Indicator uses security function for profit points so alerts will give a warning
however, gaps are OFF and Lookahead is ON and trades are entered, and profits are taken at candle close.
Trades are placed following a strict algorithm, and nothing is left to subjective opinion.
The Quantum Trader utilizes a sophisticated pattern recognition algorithms that have been rigorously tested, and has been traded live since March 2019
When compared to other algorithmic trading systems, the quantum trader places fewer trades which helps contribute to the smaller draw down seen in the back-testing.
Algorithmic Trading Strategy Compared to Paid Signal Groups and Online Trading Classes
While there is an appeal to paid signal groups, and online trading classes. Most of the trading tips and signals you find online are sadly too basic and lacking an analytical approach to defend the statements which are made.
Comments are made and repeated that simply don’t have any empirical evidence to back them up.
In algorithmic trading back-testing and monthly system overviews is (or should be) part of the design methodology, the strategy will be analyzed for multiple time periods to include bull and bear markets.
We test and trade our algorithms across multiple market cycles to include Bear and Bull markets.
With Algorithmic Trading, nothing is left to interpretation. The algo will place trades as it sees fit and will attempt to generate positive returns as trades are methodically placed on individuals accounts.
There is no staring at charts, no drawing of trend lines , no signals to take and all the negative emotions involved with trading are minimized.
Lastly, the potential for human errors is minimized since trades are placed automatically by the Automated Trading System as opposed to signals learned in an online trading course or signals received.

JERK UP {LM.Alerts Edition} (D)This is the " LONGS-MANAGEMENT Alerts " {LM.Alerts} Edition of JERK UP to enable auto-trading via alerts signaling.
Only the long-signals, generated from the underlying JERK UP algorithm, is used in this strategy-alerts script, with my latest risk-exit (collect gains) and stop-limit algorithms, as well as a bear-market filter, implemented.
~ * ~ * ~ * ~ * ~ * ~ * ~ * ~ * ~ * ~ * ~ * ~ * ~ * ~ * ~ * ~ * ~ * ~ * ~ * ~ * ~
Since {LM.Alerts} engine only focuses on trading and managing longs, a bear-market filter is implemented base on the FUSIONGAPS indicator.
The FUSIONGAPS algorithm signals local bull or bear market phases, and then disables trades conditionally to reduce the chances of having to take losses during a local bear market phase (since the short-signals are not traded).
Enabling the different (Fastest >> Slowest) FUSIONGAPS levels (e.g. 50/15, 100/50, 200/50, 200/100, etc) activates the use of each of these levels to decide the local bull/bear market phases.
So in summary, the {LM.Alerts} algorithm trades up a bullish-hill, taking profits along the way; but stops all trading activity when the market is rolling down a bearish-hill; and then once a local bull-phase is detected again, it resumes trading, etc.
Note: To trade on both bullish and bearish phases, {LM.Alerts} scripts can be applied on an inverse-chart (i.e. 0-BTCUSD) for shorts.
The {LM.Alerts} engine will be ported to my other more powerful trade-signaling scripts in the future.
~ * ~ * ~ * ~ * ~ * ~ * ~ * ~ * ~ * ~ * ~ * ~ * ~ * ~ * ~ * ~ * ~ * ~ * ~ * ~ * ~
FUSIONGAPS V5
Note: In no way is this intended as a financial/investment/trading advice. You are responsible for your own investment decisions and/or trades.
~JuniAiko
(=^~^=)v~
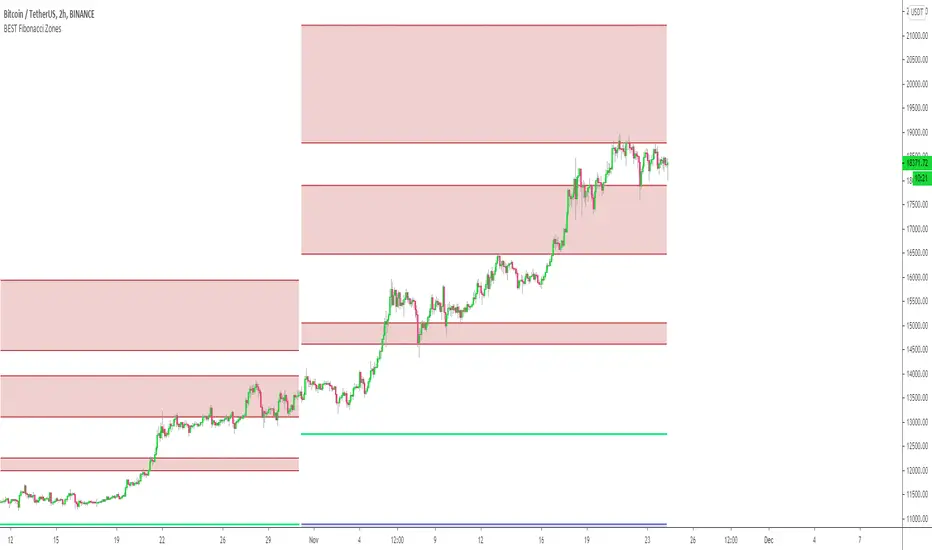
Automatic Multi-timeframes fibonacci zonesHello traders
This is a fancy indicators that will draw for you the fibonacci zones on either daily/weely/monthly timeframes
I use those zones to define my take profit levels for my intraday trading
Hope it will help
Love you all
David
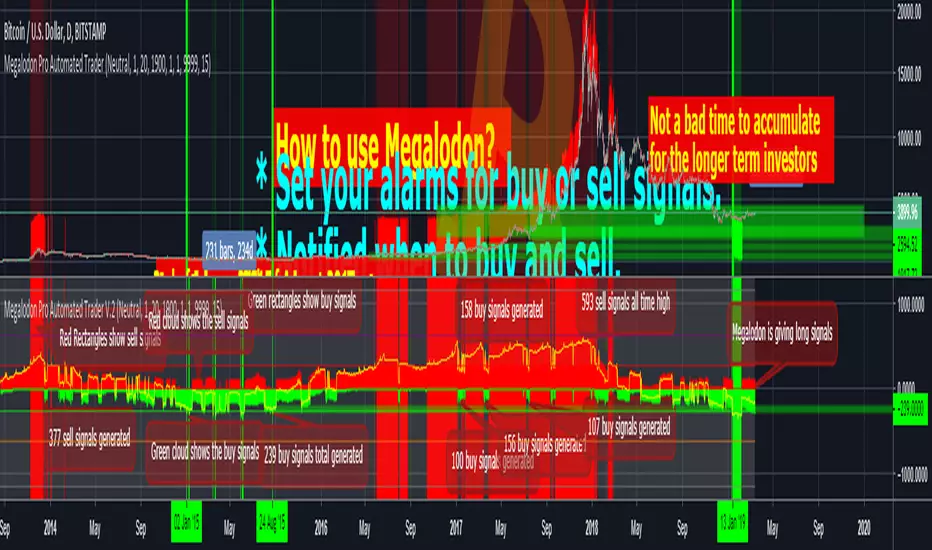
Megalodon Pro Automated Shorter Term TraderHow to use?
Green cloud shows the total buy signals. Red cloud shows the total sell signals.
Yellow line shows the difference between buy and sell signals. If yellow line is above 0, we have more SELL signals than BUY signals. If yellow line is below 0, we have more BUY signals than SELL signals.
You should basically compare the red cloud with the green cloud to enter or exit in a trade.
It should be used on shorter time frames. I recommend using 1 minute or 15 minute for better analysis.
It prints Green for Buy - Orange for Strong Buy- Red for Sell - Purple for Strong Sell signals.
This indicator basically looks for many different indicators' setups and shows you exactly what you need to know.
You may also set alarms for 4 different signals including Buy - Strong Buy - Strong Sell - Sell
Megalodon
Why Megalodon?
We believe that enlightening others is an incredible way to make this world a better place. That's why we created the tools you need to stop worrying about your investments and focus on what really matters in your life.
What is Megalodon?
Megalodon uses Artificial Intelligence that combines 574 back-tested indicators and 2674 back-tested setups, simultaneously.
Megalodon works with any kind of asset , market state and time frame .
What is the win rate?
Megalodon is extremely accurate and offers insane profits as long as the fundamental analysis is done right .
Backtesting results can be found on our social media or down below .
How to use Megalodon Pro Automated Trader?
Simply, orange rectangles are buy signals and purple rectangles are sell signals .
Green clouds show buy signals and red clouds show sell signals.
Yellow line shows the difference between buy and sell counts.
How to set alarms on Megalodon Pro Automated Trader?
Click on Alert, select Megalodon Pro Automated Trader and click on Buy-Signal or Sell-Signal. More details can be found on our social media.
You may also watch our Megalodon Investing Tutorials on Youtube for more information.
How to purchase?
Megalodon is totally FREE .
You may upgrade to Megalodon Pro for the most important features , including automizing your trading on any asset profitably, setting up alarms to get notified , joining to our VIP telegram channel to get daily updates and our VIP telegram group to interact with the community. Simply go to our website on our TradingView page for learning more and joining us for free.
Some of the backtesting results are:
BTC/USD for longer time frame trading in the bear market for the last year.
APPLE for longer time frame trading in the bull market for the last 10 years.
EURO/USD for day trading in the neutral market for the last month.
BTC/USD for day trading in the bull market for the last 15 days.
APPLE for day trading in the neutral market for the last 2 days and 6 hours.
Megalodon Pro Automated Trader
Why Megalodon?
We believe that enlightening others is an incredible way to make this world a better place. That's why we created the tools you need to stop worrying about your investments and focus on what really matters in your life.
What is Megalodon?
Megalodon uses Artificial Intelligence that combines 574 back-tested indicators and 2674 back-tested setups, simultaneously.
Megalodon works with any kind of asset , market state and time frame .
What is the win rate?
Megalodon is extremely accurate and offers insane profits as long as the fundamental analysis is done right .
Backtesting results can be found on our social media or down below .
How to use Megalodon Pro Automated Trader?
Simply, orange rectangles are buy signals and purple rectangles are sell signals .
Green clouds show buy signals and red clouds show sell signals.
Yellow line shows the difference between buy and sell counts.
How to set alarms on Megalodon Pro Automated Trader?
Click on Alert, select Megalodon Pro Automated Trader and click on Buy-Signal or Sell-Signal. More details can be found on our social media.
You may also watch our Megalodon Investing Tutorials on Youtube for more information.
How to purchase?
Megalodon is totally FREE .
You may upgrade to Megalodon Pro for the most important features , including automizing your trading on any asset profitably, setting up alarms to get notified , joining to our VIP telegram channel to get daily updates and our VIP telegram group to interact with the community. Simply go to our website on our TradingView page for learning more and joining us for free.
Some of the backtesting results are:
BTC/USD for longer time frame trading in the bear market for the last year.
APPLE for longer time frame trading in the bull market for the last 10 years.
EURO/USD for day trading in the neutral market for the last month.
BTC/USD for day trading in the bull market for the last 15 days.
APPLE for day trading in the neutral market for the last 2 days and 6 hours.
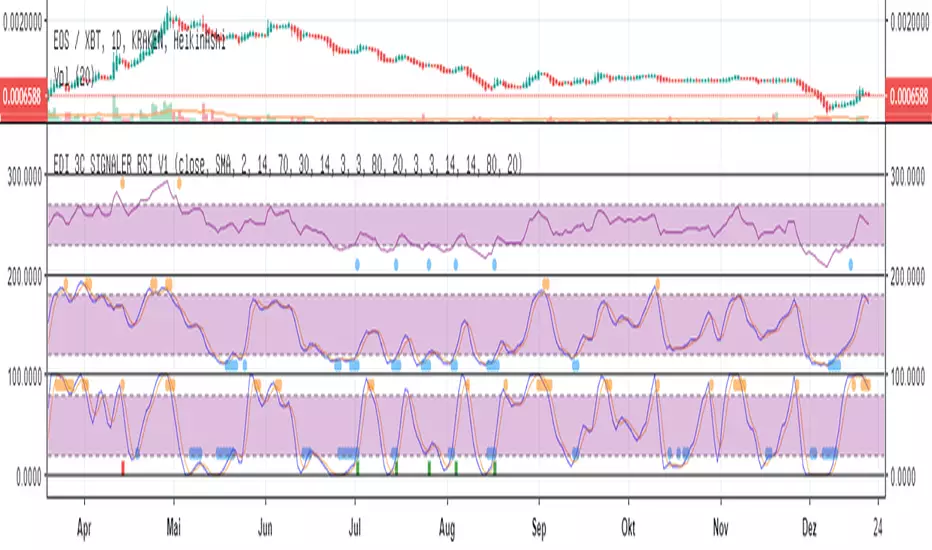
Eds Bot Signaler on Basis of RSI Stoch StochRSIEDS AWESOME BOT SIGNALER
Specially for use with e.g. 3commas or autoview
But can also be used just in normal manual (visual) mode
This Script is very early Beta. Works for visual manual use....
and also for 3Commas Bot as "Signaler" (how to connect with Bot, see the docu on 3commas).
... but can use as Signaler for any Bot who is able to get Tradingview sms-mails. (e.g. autoview)
It combines RSI, Stoch and Stoch-RSI.
You can choose normal RSI, or " returning RSI " (signals when leaving the sell/buy-zone. much higher profits with this)
You can choose how many of the indicators are needed to "fire".
You can choose if one of the indicators is a "must"
For Stoch & Stoch-RSI you can Choose sma or ema calculations of the moving average.
All the Values speak for themselves, if you are used to technical analyses (stay away in the moment, if you dont know, what rsi, stoch etc is used.
The Signals are also shown in the chart, the single ones, but also the combined which fires the Bot-Signal (shown as green and red column-candle at bottom)
Enjoy !! Free use in the moment.
More detailled Explanation in the future. Just play around!
If you wanna give something back:
BTC: 15buigKjh4JYnuVwcEWiYMpYvP3Lbp4ypL