Moving Averages (Self-Adjusting Param for Highest Profitability)Moving Averages (Self-Adjusting Parameters for Highest Profitability)
It is a dual moving average crossover system - Smart Moving Averages .
Moving averages are used to identify current price developments and the potential for a change in an established trend.
The crossover in a dual moving average system can be used as a trigger to buy or to sell an asset, or as a trend reversal indication.
The crossover occurrence depends on the periods for which the moving averages are calculated. Using constant period values may not bring the best results.
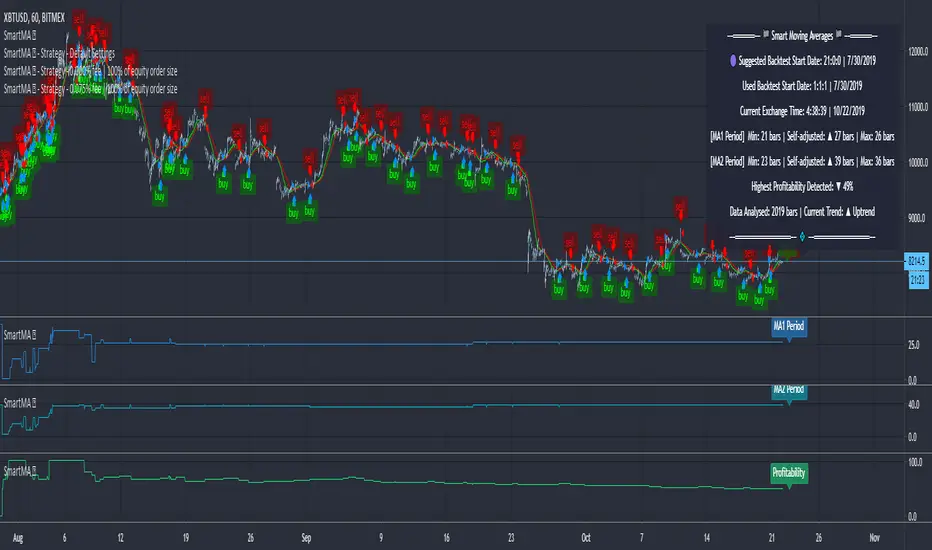
The Smart Moving Averages change their periods automatically to get the highest profitability .
The concept is similar to the Smart SuperTrend .
Features:
• Self-Adjusting Period parameters
• The graphs for Profitability, Moving Average 1 Period, Moving Average 2 Period and the Moving Averages themselves are available to choose for display from the indicator settings
• A chart layout can be made just for the Smart Moving Averages, having all the graphs nicely displayed
• Alerts for changes in Trend, Moving Average 1 Period, Moving Average 2 Period, Profitability
• Different types of Moving Averages are available to choose from in the indicator settings (SMA, EMA, RMA, WMA, VWMA, DEMA, TEMA, HullMA, TMA).
The range for Moving Average 1 Period, Moving Average 2 Period and Time can be changed in the indicator settings (suggested optimal values are displayed on the chart).
This affects the loading speed (smaller range, faster to load), as well as the accuracy of the signals.
The indicator switches to the most profitable Moving Average 1 Period and Moving Average 2 Period parameters automatically, in real-time.
It scans across the entire historical data made available by TradingView.
The Smart Moving Average system works on all timeframes and symbols available on TradingView.
Exception for when the Volume Weighted Moving Average is used - it doesn't work for symbols without volume data.
It does not repaint!
But several aspects must be considered:
- 1. TradingView periodically removes access to old data while giving access to new data in real-time.
____ The frequency depends on the timeframe, amount of data. It can happen daily for second charts, weekly for minute charts.
____ Since the Indicator wouldn't have access to that old data anymore, the Profitability may change its value, causing a certain degree of repainting.
- 2. The starting time for Backtest must be inserted in the settings panel.
____ As long as the starting time has available price data, the Smart Moving Averages will NOT get repainted.
____ A suggested starting date for the analysis is shown on the chart. Insert the date in the indicator settings.
This indicator is compatible with the Wrapper Module of the Risk Management System indicator, which means they can work together as a trading bot.
Automatic
Auto Fibonacci Retracement Levels A Fibonacci retracement is a popular tool that traders can use to identify support and resistance levels, and place stop-loss orders or target prices.
The indicator connects any two points that are relevant, a high and low point.
The percentage levels provided are areas where the price could stall or reverse.
Levels should not be relied on exclusively. For example, it is dangerous to assume the price will reverse after hitting a specific Fibonacci level. It may, but it also may not.
Fibonacci retracement levels are most frequently used to provide potential areas of interest. If a trader wants to buy, they watch for the price to stall at a Fibonacci level and then bounce off that level before buying.
The most commonly used ratios include 23.6%, 38.2%, 50%, 61.8% and 78.6%. These represent how much of a prior move the price has corrected or retraced.
Triple MA 5-period forecast [Siem]This script calculates 3 MAs and forecasts where these MAs will be in the next 5 future periods.
Automatic mode - price will be based on current price ("flat") or an X-period linear regression ("linreg").
Manual mode - enter your own value('s): let's see where the MA's will be when your favourite equity all of a sudden hits 1 million tomorrow!
based on Triple MA Forecast by yatrader2 , idea by anthnyl
Auto FibonacciAutomatic fibonacci tool.
Still in beta, but works.
will be updating in the future with better improvements, depending on popularity.
Feedback and suggestions welcome.
Auto Pivot PointsThis indicator plots a Pivot Point and 3 Support and Resistance lines that automatically adapt to the Timeframe
These can also be plotted against a Custom Timeframe
Resistance of VolumeIt is used to detect volume resistors in a personalized way, since it allows the user to enter the volume in which he wishes the resistance to jump automatically.
It does not mark the black line and the graphic that's just to help understand how it works
in the above image can see the indicator works on 30 minutes chart
in the above image can see the indicator works on 5 minutes chart
therefore, it can be configured to go through several temporalities.
ARES StrategyIntraday strategy focused on 30M,1H, 4H & Daily TF
Better results with Heiken Ashi Candles
Automatic Golden Ratio Support & ResistanceThe golden ratio is also called the golden mean or golden section.
It has been used to analyze the proportions of natural objects as well as man-made systems such as financial markets.
The mathematics of the golden ratio and of the Fibonacci sequence is intimately interconnected. The Fibonacci sequence is: 1, 1, 2, 3, 5, 8, 13, 21, 34, 55, 89, 144, 233, 377, 610, 987, ....
This Golden Ratio indicator automatically plots 5 support levels and 5 resistance levels based on the golden ratio for current timeframe. It shows a possible price range for current session, you can easily identify the major and minor support/resistance levels from the chart.
The levels of support and resistance are formed at the beginning of a new session
This indicator works on all default time frames.
It will never repaint.
There is no parameter. All you need to do is to load it to your chart.
Click the image links to view it in original size.
3.bp.blogspot.com
2.bp.blogspot.com
2.bp.blogspot.com
3.bp.blogspot.com
2.bp.blogspot.com
2.bp.blogspot.com
1.bp.blogspot.com
////////////////////////////////////////////////////////////
// Technical Analysis & Research Patternsmart
//
// Custom indicators, Strategies, SCAN, Screener, Backtesting, Converting service for:
// Tradingview, NinjaTrader, Thinkorswim, MetaTrader, MetaStock, Multicharts, Prorealtime, etc.
////////////////////////////////////////////////////////////


