MarketMind PRO v1.0 🜁 MarketMind PRO v1.0 — Multi-Session Real-Time Context Engine
Find opportunity faster. Trade with clarity and conviction.
🜁 MarketMind PRO is a real-time, session-aware context intelligence engine designed to answer one essential question:
Is this ticker truly in play today?
Its analysis adapts instantly to the current trading phase—Early Flow (Pre-Market), Volatility Burst (Open), Low-Vol Window (Midday), Rebuild Phase (Afternoon), or Power Hour (Pre-Close)—so the score and bias signals you see always reflect the conditions that matter right now.
This makes 🜁 MarketMind PRO a multi-timeframe environment engine with a strong emphasis on deep real-time analysis during the two highest-edge windows of the day: Pre-Market and Pre-Close .
By fusing macro alignment, sector flow, liquidity quality, volatility regime, microstructure behavior, and options-driven pressure into a single visual framework, 🜁 MarketMind PRO turns noisy charts into clean, decision-ready environments.
Whether you're hunting high-quality overnight setups in the final hour, scanning gap-driven opportunities before the open, or evaluating structure during the regular session, 🜁 MarketMind PRO highlights the context that matters—and filters out everything that doesn’t.
⭐ WHAT 🜁 MARKETMIND PRO ACTUALLY DOES
🜁 MarketMind PRO performs continuous real-time analysis across all trading phases.
It:
• detects when a ticker is aligned with broader market forces
• highlights high-quality conditions for intraday or overnight trades
• warns you when macro, VWAP, or gap conditions make the setup unsafe
• reveals trend, structure, liquidity, and flow context instantly
• consolidates cross-market awareness into one simple, unobtrusive chart
It’s built for traders who want clarity without complexity.
⭐ THE CORE OF 🜁 MARKETMIND PRO: THE SQS SCORE (0–100)
SQS (System Quality Score) compresses nine critical dimensions of market and setup readiness:
✓ Gap Behavior
✓ Sector Flow
✓ Liquidity Quality
✓ Relative Strength
✓ Macro Alignment
✓ Microstructure Strength
✓ Price Stability
✓ Options Flow
✓ Bonus Context (trend confluence, regime reinforcement)
SQS is fully session-aware and adjusts its weighting model in real time.
It automatically adapts to the two highest-opportunity phases:
• Pre-Close (15:30–16:00 ET) — for overnight hunters
• Pre-Market (04:00–09:30 ET) — for gap traders & open-drive setups
Scores translate into an intuitive tier:
• GO – High-quality environment
• WATCH – Developing conditions
• PASS – Low-quality environment
• SKIP – Hard block triggered (Macro, VWAP, Gap)
SQS doesn’t tell you what to trade — it tells you when the environment is worth your attention.
⭐ OPTIONS FLOW ENGINE v1.0 — A NEW DIMENSION OF CONVICTION
🜁 MarketMind PRO v1.0 introduces a dedicated Options Flow Engine, designed for traders who rely on flow-aligned environments.
Powered by a multi-layer fusion model, Options Flow measures:
• directional bias (Call vs Put)
• macro confirmation state
• RS, volatility, and trend bursts
• volume-imbalance pressure (buy/sell dominance)
• expansion bars & spike behavior
• early reversal/compression signals
• pre-market flow acceleration
• contextual flow multiplier (momentum × volatility × VWAP × sector alignment)
The output is a smooth, conservative, non-inflated flow signal that highlights genuine options pressure—not noise.
When enabled, Options Flow integrates directly into SQS as a weighted component, adding a powerful second layer of confirmation without overwhelming the trader.
⭐ THE HUD — EVERYTHING THAT MATTERS, INSTANTLY
The on-chart HUD is designed for ultra-fast interpretation and adapts automatically to your current session in real-time:
✔ Macro Bias (overall market tone & volatility environment)
✔ Sector Bias (how strong your ticker’s sector is today)
✔ Trend Bias (the chart’s structure, trend quality, VWAP position)
✔ Micro Bias (how similar tickers are behaving — peer confirmation)
✔ SQS Score (0–100) with tiers for GO / WATCH / PASS / SKIP
✔ Hard Block Reason (Macro, VWAP, or Gap — conditions that stop a setup from qualifying)
✔ Breakdown Panel (full 9-factor score display)
✔ Key Driver Analysis (which factor moved SQS the most)
✔ Options Mode Output (direction, expiry, delta, flow%)
Every element is tuned to reduce cognitive load and turn complex market states into clean, actionable context.
⭐ PRE-CLOSE MODE — IDENTIFY HIGH-QUALITY OVERNIGHT SETUPS
During 15:30–16:00 ET, 🜁 MarketMind PRO shifts into its highest-precision overnight model, emphasizing:
• structural integrity
• trend continuation
• sector agreement
• macro confirmation
• liquidity quality
• stability conditions
This helps uncover tickers building strength into the close—ideal for selective overnight positions.
⭐ PRE-MARKET MODE — FIND THE BEST GAP PLAYS BEFORE THE BELL
In the pre-market window, weightings shift toward:
• gap magnitude × character
• early liquidity quality
• volatility expansion vs compression
• microstructure acceleration
• macro alignment ahead of the open
• premarket flow strength (if Options Mode enabled)
You immediately see which tickers are warming up, which are accelerating, and which are fading before the open.
⭐ OPTIONS MODE (OPTIONAL FEATURE)
When activated, 🜁 MarketMind PRO displays:
• Call/Put direction
• Expiry (0DTE / 1DTE / 2DTE)
• Delta
• Options Flow %
• Flow Direction Bias (Bullish / Bearish)
This mode is ideal for:
• flow-confirmation traders
• macro-aligned momentum plays
• premarket sweep/chase setups
• intraday continuation plays
Options Mode is fully optional.
SQS remains complete and accurate without it.
⭐ WHY TRADERS USE 🜁 MARKETMIND PRO
✓ Avoid low-quality environments
No more wasting time in chop, illiquid tickers, or dead setups.
✓ Spot opportunity faster
A single glance tells you whether a ticker is heating up or not worth your time.
✓ Build confidence and clarity
You understand why the environment is favorable—or why it isn’t.
✓ Streamline your scanning routine
🜁 MarketMind PRO was engineered for fast, repeatable workflows.
✓ Stay aligned with broader market structure
Bias and regime context are always visible.
⭐ WHO 🜁 MARKETMIND PRO IS FOR
• Day traders
• Swing traders
• Options traders
• Pre-Market scanners
• Pre-Close overnight hunters
• Momentum, trend, and structure traders
• Systematic/algo traders who need human-readable context
If you value context first, decisions second, this tool was built for you.
⭐ RECOMMENDED SETTINGS & WORKFLOW
• Use Pre-Close Mode 15:30–16:00 ET for overnight setups
• Use Pre-Market Mode 07:00–09:30 ET for gap filtering & open-drive candidates
• Enable Options Mode only if your strategy benefits from flow context
• Keep HUD in Top Right for the cleanest chart layout
• Turn OFF Inputs/Values in Status Line for optimal display
⭐ IMPORTANT NOTES
• 🜁 MarketMind PRO is a context engine, not a buy/sell signal
• It pairs best with your existing strategy or system
• No proprietary signals or predictions are provided
• SQS is session-aware and adapts automatically
• Options Flow is intentionally conservative—greens are rare and meaningful
⭐ FINAL THOUGHTS
🜁 MarketMind PRO v1.0 is built for the modern trader who wants clarity, speed, and conviction.
It provides the macro, micro, structure, and flow context needed to choose smarter setups—without guessing or over-analyzing.
If you want a clean, disciplined way to identify when a ticker truly deserves your attention…
🜁 MarketMind PRO is the missing piece of your workflow.
Based

Volume Profile Auto POC📌 Overview
Volume Profile Auto POC is a trend-following strategy that uses the automatically calculated Point of Control (POC) from the volume profile, combined with ATR zones, to capture reversals and breakouts.
By basing decisions on volume concentration, it dynamically visualizes the price levels most watched by market participants.
⚠️ This strategy is provided for educational and research purposes only.
Past performance does not guarantee future results.
🎯 Strategy Objectives
Automatically detect the volume concentration area (POC) to improve entry accuracy
Optimize risk management through ATR-based volatility adjustment
Provide early and consistent signals when trends emerge
✨ Key Features
Automatic POC Detection : Updates the volume profile over a defined lookback window in real time
ATR Zone Integration : Defines a POC ± 0.5 ATR zone to clarify potential reversals/breakouts
Visual Support : Plots the POC line and zones on the chart for intuitive decision-making
📊 Trading Rules
Long Entry:
Price breaks above the POC + 0.5 ATR zone
Volume is above average to support the breakout
Short Entry:
Price breaks below the POC - 0.5 ATR zone
Volume is above average to support the downside move
Exit (or Reverse Position):
Price returns to the POC area
Or touches the ATR band
⚙️ Trading Parameters & Considerations
Indicator Name: Volume Profile Auto POC
Parameters:
Lookback Bars: 50
Bins for Volume Profile: 24
ATR Length: 14
ATR Multiplier: 2.0
🖼 Visual Support
POC line plotted in red
POC ± 0.5 ATR zone displayed as a semi-transparent box
ATR bands plotted in blue for confirmation
🔧 Strategy Improvements & Uniqueness
This strategy is inspired by traditional Volume Profile + ATR analysis,
while adding the improvement of a sliding-window mechanism for automatic POC updates.
Compared with conventional trend-following approaches,
its strength lies in combining both price and volume perspectives for decision-making.
✅ Summary
Volume Profile Auto POC automatically extracts key market levels (POC) and combines them with ATR-based zones,
providing a responsive trend-following method.
It balances clarity with practicality, aiming for both usability and reproducibility.
⚠️ This strategy is based on historical data and does not guarantee future profits.
Always use proper risk management when applying it.

Time-based LiquidityThis indicator automatically marks important time-based liquidity levels on your chart, helping you stay aware of where major price reactions may occur and the market is forced to show its hand.
Key Features:
Previous Month’s, Week’s, and Day’s Highs and Lows: Displays PMH/PML, PWH/PWL, and PDH/PDL — key reference points where liquidity often accumulates.
Intraday Session Highs and Lows: Divides the trading day into quarters (00:00–06:00, 06:00–12:00, etc. following Day’s Quarterly Theory) and tracks session highs and lows dynamically across these periods.
Current Session 90-Minute Quarters: Splits the active session into 90-minute intervals to highlight short-term liquidity structures and potential reaction zones.
Level Alerts: Tracks when each liquidity level is reached and enables customizable alerts so you don’t miss important price movements.
Use Case:
This tool provides an organized, time-based framework for identifying where liquidity is likely to concentrate across different timeframes and intraday cycles. Use these levels for forming bias, planning entries, exits, or anticipating price reactions at key points in the market structure.
Customization Options:
Enable/disable liquidity levels to display (Daily, Weekly, Monthly, Sessions, Session Quarters)
Customize the appearance of each level (color, style, line width)
Enable or disable tracking and alerts for level interactions

Volume Change Indicator 0.1 [PATREND]
(Volume Change Indicator)
It is an analytical tool that studies the trading volume and its changes.
This indicator uses the Simple Moving Average (SMA) to calculate the average volume for a specific period of time.
Only candles that meet the required conditions are determined when the trading volume is greater than or equal to the calculated average.
This means that the indicator identifies a volume candle only when there is a significant change in trading volume compared to the average.
This indicator is distinguished from other similar indicators in that it allows the user to determine the required percentage of change as an additional condition for determining the volume candle.
If the conditions are correct, the indicator will display a diamond below the candle that meets the requirements specified by the user.
The indicator also displays lines above and below the candle and places "A" and "B" marks next to them to determine the start and end points.
__________________________________
(Volume Change Indicator)
It is a useful analytical tool for traders who rely on volume analysis strategies in their trading decisions.
This indicator helps traders identify important volume candles and search for trading opportunities more accurately.
Traders can use this indicator to determine trends and search for potential entry and exit points.
The indicator helps determine when there is a significant change in trading volume compared to the average, indicating a possible change in direction.
In general
This indicator benefits traders who use volume analysis strategies in their trading decisions and who want additional information about trading volume and its changes.
It can also be used for all markets and on different time frames.
_________________________________
Settings:
1. The user is allowed to determine whether they want to display the indicator through the "Show Indicator" box.
2. The user is allowed to determine the required percentage of change through the "Percent Change" box.
3. The user is allowed to determine the type of candles they want to display (Bearish, Bullish, both) through the "Candle Type" box.
4. The user is allowed to calculate the average candle volume using the "Average Vol" box.
5. The user is allowed to determine the length of lines and number of lines they want to display through "Max Lines" and "Line Length" boxes.
_________________________________
We hope you find (Volume Change Indicator) useful in your analysis.
Feel free to try this indicator and customize its settings to meet your trading needs.
We look forward to seeing your opinions and comments on this indicator.
______________________________________________________________________________________________________
(Volume Change Indicator)
هو أداة تحليلية تعمل على دراسة حجم التداول وتغيراته.
يستخدم هذا المؤشر متوسط الحجم المتحرك (SMA) لحساب متوسط الحجم لفترة زمنية معينة.
يتم تحديد الشموع التي تلبي الشروط المطلوبة فقط عندما يكون حجم التداول أكبر من أو يساوي المتوسط المحسوب.
هذا يعني أن المؤشر يحدد شمعة الكميات فقط عندما يكون هناك تغير كبير في حجم التداول مقارنة بالمتوسط.
يتميز هذا المؤشر عن غيره من موشرات الممثاله بأنه يتيح للمستخدم تحديد النسبة المئوية المطلوبة للتغيير كشرط إضافي لتحديد شمعة الكميات.
إذا كانت الظروف صحيحة، فسيعرض المؤشر ماسًا أسفل الشمعة التي تلبي المتطلبات المحددة من قبل المستخدم.
كما يعرض المؤشر خطوطًا فوق وتحت الشمعة ويضع علامتي "A" و "B" بجانبهما لتحديد نقاط البداية والنهاية.
________________________________________
(Volume Change Indicator)
هو أداة تحليلية مفيدة للمتداولين الذين يعتمدون على استراتيجيات تحليل الحجم في قراراتهم التداولية.
يساعد هذا المؤشر المتداولين على تحديد شموع الكميات المهمة والبحث عن فرص تداولية بشكل أكثر دقة.
يمكن للمتداولين استخدام هذا المؤشر لتحديد الاتجاهات والبحث عن نقاط الإدخال والخروج المحتملة.
يساعد المؤشر على تحديد متى يكون هناك تغير كبير في حجم التداول مقارنة بالمتوسط، مما يشير إلى احتمالية حدوث تغير في الاتجاه.
In general
يستفيد من هذا المؤشر المتداولون الذين يستخدمون استراتيجيات تحليل الحجم في قراراتهم التداولية والذين يرغبون في الحصول على معلومات إضافية حول حجم التداول وتغيراته.
كما يمكن استخدامة لجميع الاسواق وعلى مختلف الفواصل الزمنية .
_________________________________________
Settings:
1. يُتيح للمستخدم تحديد ما إذا كان يرغب في عرض المؤشر من خلال خانة "Show Indicator".
2. يُتيح للمستخدم تحديد النسبة المئوية المطلوبة للتغير من خلال خانة "Percent Change".
3. يُتيح للمستخدم تحديد نوع الشموع التي يرغب في عرضها (Bearish, Bullish, both) من خلال خانة "Candle Type".
4. يُتيح للمستخدم حساب متوسط حجم الشموع باستخدام خانة "Average Vol".
5. يُتيح للمستخدم تحديد طول الخطوط وعدد الخطوط التي يرغب في عرضها من خلال خانات "Max Lines" و "Line Length".
_________________________________________
نأمل أن تجدواه مفيدًا في تحليلاتكم .
لا تترددوا في تجربة هذا المؤشر وتخصيص إعداداته لتلبية احتياجاتكم التداولية.
نتطلع إلى رؤية آرائكم وتعليقاتكم حول هذا المؤشر.

[CLX][#02] Registry (type-based)This script only provides a basic __setter and __getter registration function with a type-based limitation.
We don't want to blow the code with additional conditions. The suggestion was to get the basic functionality.
Benefits:
- Get/set/update global-like variables between functions
- No init needed. You can call a entry before you set it.
Get-Functions:
- f_reg_getInt(_key)
- f_reg_getFloat(_key)
- f_reg_getBool(_key)
- f_reg_getString(_key)
- f_reg_getColor(_key)
- f_reg_getLabel(_key)
- f_reg_getLine(_key)
Set-Functions:
- f_reg_setInt(_key, _value)
- f_reg_setFloat(_key, _value)
- f_reg_setBool(_key, _value)
- f_reg_setString(_key, _value)
- f_reg_setColor(_key, _value)
- f_reg_setLabel(_key, _value)
- f_reg_setLine(_key, _value)
Feel free to contribute for an extended version. :)
We hope you enjoy it! 🎉
CRYPTOLINX - jango_blockchained 😊👍
Disclaimer:
Trading success is all about following your trading strategy and the indicators should fit within your trading strategy, and not to be traded upon solely.
The script is for informational and educational purposes only. Use of the script does not constitute professional and/or financial advice. You alone have the sole responsibility of evaluating the script output and risks associated with the use of the script. In exchange for using the script, you agree not to hold dgtrd TradingView user liable for any possible claim for damages arising from any decision you make based on use of the script.

Auto Fib Time Zones and Trend-Based Fib Time by DGTFibonacci time zones, based on the Fibonacci number sequence, are vertical lines that represent potential areas where a swing high, low, or reversal could occur.
Trend-Based Fib Time shows probable price corrections in an existing trend. A useful tool to use in addition to Elliot Wave counting, Fib Time helps to identify how far the wave is likely to travel
Please note, Time zones aren't concerned with price, only time
Disclaimer :
Trading success is all about following your trading strategy and the indicators should fit within your trading strategy, and not to be traded upon solely
The script is for informational and educational purposes only. Use of the script does not constitute professional and/or financial advice. You alone have the sole responsibility of evaluating the script output and risks associated with the use of the script. In exchange for using the script, you agree not to hold dgtrd TradingView user liable for any possible claim for damages arising from any decision you make based on use of the script


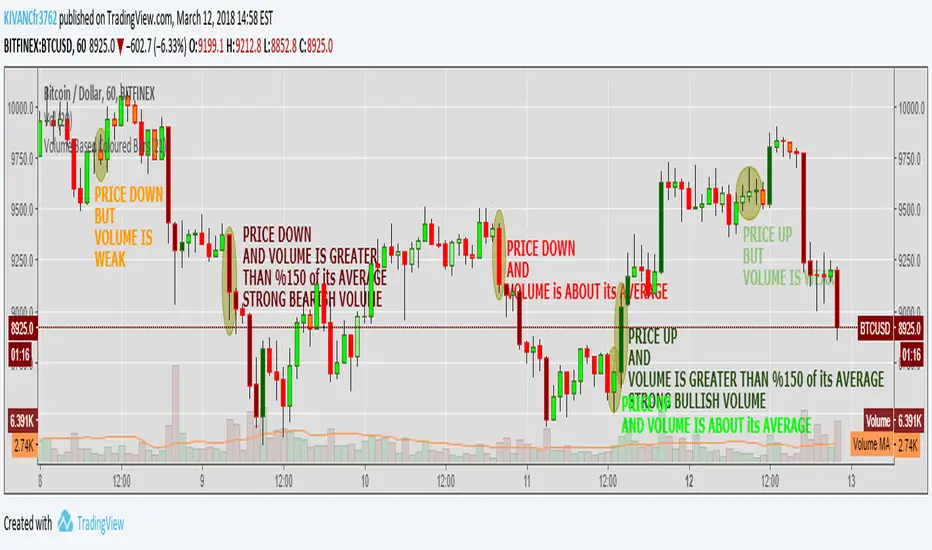
Volume Based Coloured BarsVolume Based Coloured Bars:
Most of the time traders are confused about if the price movements were supported by VOLUME .
This indicator colors the bars into volume weighted signals...
When prices go down bars are red and contraversely when up, bars are green. Additionally we have two more colors for each
situation:
PRICE BARS ARE:
DARK RED when prices go down and VOLUME is bigger than 150% of its (default 21 day) average, that indicates us price action is supported by a strong BEARISH VOLUME
RED when prices go down and VOLUME is BETWEEN 50% AND 150% of its (default 21 day) average, at this situation we can think that volume is neither strong nor weak
ORANGE when prices go down and VOLUME is just less than 50% of its (default 21 day) average, so the volume is weak and doesn't support the price action much
DARK GREEN when prices go UP and VOLUME bigger than 150% of its (default 21 day) average, that indicates us price action is supported by a strong BULLISH VOLUME
GREEN when prices go UP and VOLUME is BETWEEN 50% AND 150% of its (default 21 day) average, at this situation we can think that volume is neither strong nor weak
LIGHT GREEN when prices go UP and VOLUME is just less than 50% of its (default 21 day) average, so the volume is weak and doesn't support the price action much
21 day Simple Moving Average used as default value which can be changed in the settings menu,
21 day is considered as a month for STOCK Markets, it would be more accurate to set the value to 30 for CRYPTO CURRENCIES