BEST Ultimate Engulfing ScreenerHello traders
Continuing deeper and stronger with the screeners serie. I keep getting requests private messages and requests saying that screeners aren't possible with TradingView.
My answer is always... "Reallyyy ??" (I never find a better answer than that...)
I'll publish a few screeners just for everyone to understand what can be done with Pinescript. We don't have to wait for TradingView to allow screener based on custom indicator - we can build our own ^^
I - What is an engulfing pattern
Let's start with a screener to check for a very famous candlestick pattern called engulfing
Engulfing candles tend to signal a reversal of the current trend in the market. This specific pattern involves two candles with the latter candle ‘engulfing’ the entire body of the candle before it.
The engulfing candle can be bullish or bearish depending on where it forms in relation to the existing trend
Source and more info here
These engulfing candles indicate a strong shift in direction, and when combined with observation of the price-trending direction that precedes it, this shift creates the opportunity for a trading strategy.
II - How did I set the screener
I added an optional filter being Price vs SMA. The idea is to select only the engulfing whenever the price also breaks an SMA - this usually translates a stronger move - but could sometimes give the signal too late (#meh #trading #ain't #easy)
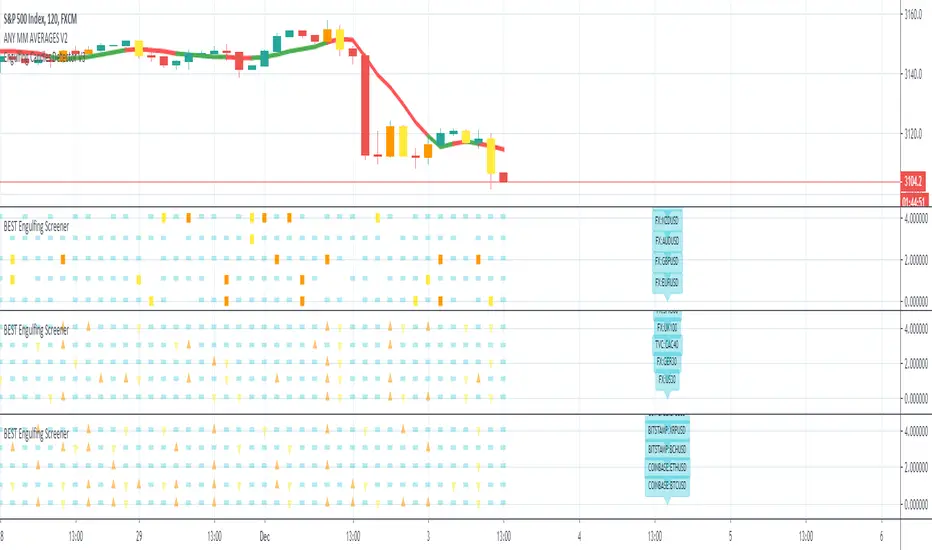
The visual signals are as follow:
- square: whenever the engine detects an engulfing and an SMA breakout
- triangle: the engine only detects an engulfing
- dash: none of the above
Then the colors are:
- orange when bullish
- yellow when bearish
- aqua/dash when none of the above
Cool Hacks
"But sir... what can we do with only 5 instruments for a screener?" I agree not much but...
even if I allow only 5 instruments per indicator - nothing prevents you from adding multiple times the same indicator and changing the selected instruments for each. I also show why the SPX500 gave a yellow triangle (bearish engulfing) and how to match it with the screener.
=> imgur.com
Wishing you all the BEST trading
Dave
Bestindicator
Ultimate EMA ScreenerHello traders
Very busy preparing a few stuff for Black Friday but wanted to remind that I still know Pinescript and how to step up my game :)
My master @RicardoSantos once again showed me how to push the pinescript limits one step/dimension further. Kudo also to my client (Judy) for this amazing idea.
I inspired myself from his script () to display multiple assets in the same panel - without breaking the chart scaling.
In that case, I'm comparing 5 EMAs relatively to each other and display:
- a square if they're stacked properly
- a triangle if two of them are stacked properly
- a dash otherwise
For those interested, the conditions are in the f_securitys function.
I posted in the past a few screeners using labels but we're limited to 50 labels per script. There isn't such limitation when using the plotshape function - giving us more complete screeners. #uhuuuu
I'll post a few more examples this week with different trading strategies/combinations. The possibilities here are (close to) limitless.
I'm using the security built-in function to call external assets (here different forex pairs) and we're limited to 40 security calls per script.
But nothing preventing us from duplicating the same script a few times and calling different assets each time :) If you'd like to display 10 forex pairs, you only need to add that script on your chart twice and select 5 pairs for the first panel, 5 other pairs for the second panel.
You're welcome <3
All the BEST
Dave

Algorithm Builder - Multiple TrendsHello traders
I. SCRIPTS ACCESS AND TRIALS
1. For the trial request access, they have to be done through my website .
2. My website URL is in this script signature at the very bottom (you'll have to scroll down a bit and going past the long description) and in my profile status available here : Daveatt
Due to the new scripts publishing house rules, I won't mention the URL here directly. As I value my partnership with TradingView very much, I prefer showing you the way for finding them :)
3. You may also contact me directly for more information
II. Algorithm Builder - Multiple Trends
2.1 Forewords
This indicator is available only to our PREMIUM users. Our PREMIUM indicators offer more trading analysis capabilities and opportunities.
A few words of caution: the Algorithm Builders - Multiple Trends are more advanced and as such, would require slightly more time to be mastered.
They're not that much difficult, but we understand that designing a trading system with 2 trends might be slightly more complicated - however, there is nothing to be scared of :).
The time spent to learn how to use our PREMIUM tools might be rewarded handsomely.
2.2 Concept
The Algorithm Builder - Multiple Trends is made to detect the convergence of many unrelated indicators and give a BUY or SELL signal whenever all the selected sub-indicators are converging in the same direction.
This is an upgrade of the PRO package giving access to the Algorithm Builder - Single Trend - designed to show 1 unique entry per trend - whereas the Multiple Trends offers re-entries in the same direction of the trend if the indicator detects good convergences to accumulate more positions.
III. Multiple Trends versus Single Trend
3.1 Multiple Trends benefits
A friend asked us recently Why using the Multiple Trends if we can use the Single Trend in a smaller timeframe, and get more entries that way?
We thought this was an excellent question, but the answer is obvious.
Using a Single Trend on a smaller timeframe to solely getting more entries will reduce the security of the given trades.
We designed the Algorithm Builders to take a trade in an identified trend but reducing the timeframe too much will mostly increase your risk - and might lead to capital loss.
By the way, this is a universal rule valid also for a big majority of indicators.
We're absolutely not saying that the Single Trend won't work on small timeframes because actually it really does. But, if you find out a great configuration for your Single Trend, and want to get more signals without increasing your risk - then the Multiple Trends would be a very viable option.
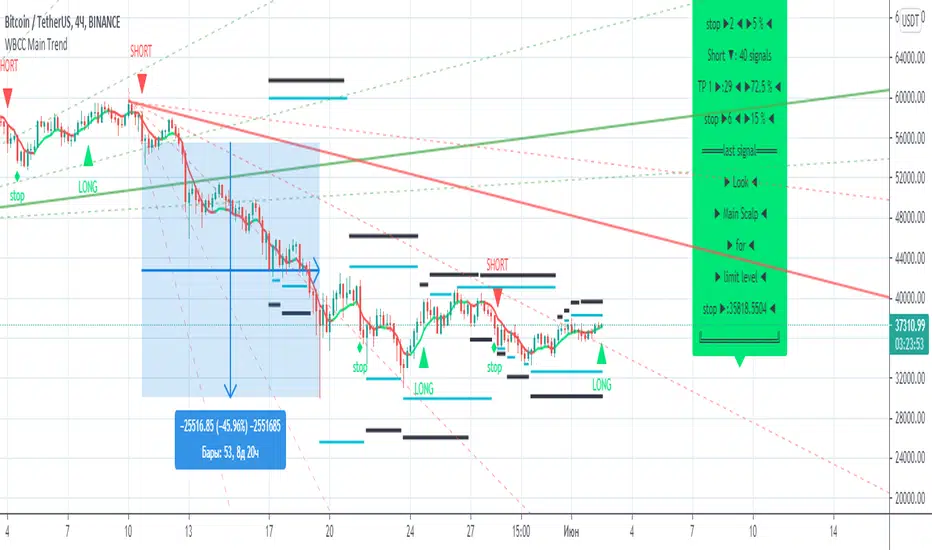
3.2 Main signal versus secondary signals
For the main and secondary trends, the color green symbolizes any identified "BUY" trend. And the color red symbolizes any identified "SELL" trend.
-The MAIN trend symbol is unique and symbolized by a triangle.
- The SECONDARY (could also be called re-entries) trends are multiple and symbolized by a diamond.
In the Algorithm Builder indicator settings, they're identified with the Additional keyword.
3.3 How the convergences are calculated
Extremely important: The diamonds (or re-entries) are displayed, as long as a triangle (or main/primary signal) is displayed.
For a trend change (buy to sell or sell to buy), the system waits for ALL selected re-entries sub-indicators , to give a convergence/confluence in the opposite direction.
For example, let's assume a BUY/green convergence based on 3 indicators. One or Two of them going turning red, won't be enough for a trend change.
But, if all of them turn red, then we'll see a red triangle - signaling the beginning of a new downtrend.
3.4 Why multiple entries?
Here are a few use cases :
1. The main use case why we made those Multiple Trends indicators: A trader got invalidated or stopped out on a trade, but wants a system to let hin/her jump back in with a minimum of security. (security depending on the configuration of the Algorithm Builder as a whole).
This is very frustrating to get in a trade, being stopped out, and finally, see the trade going in the expected direction.
Even more frustrating to jump back in at the end of a trend, and get stopped out again - we all agree on this.
2. You want to add more positions on your main trade as your Algo Builder identified a solid trend - this is a nice way to possibly maximize your gains.
Once again, we don't/won't guarantee any performance result (not because we don't believe in our tools, but for legal reason), all depends on the time spent reading our documentation and playing with the Algo Builder - as explained on our Tutorials.
More info available on our website. URL available in this script signature and on my profile status.
IV. Why the Algorithm Builder Multiple Trends may help you
I worked with many traders during my career, and their feedback about trading is often pretty similar.
They all tried a lot of complicated indicators, losing their capital, and finally getting back to the basics (even to the basic indicators if I might say)
The art is finding a good combination of indicators and setting strict money/risk management rules.
Easy in concept, but more than 90+% of traders lose money on the markets... which teach us that trading is not only about drawing trendlines, or using cool indicators but finding ways to ease our psychology while trading.
4.1 The Algorithm Builder trading framework
The sub-indicators (full list on our website) weren't chosen randomly. They're based on a trading method we've developed over the last 6 years - while working with traders and other trading quants.
The Algo Builders are made to detect a convergence - and as such, will give a signal once a trend has been identified.
They're not made to detect reversal but have been designed to give a signal when all sub-indicators are either ALL bullish (green) or ALL bearish (red).
We provide a framework based on indicators we selected because they:
1. make sense to be used altogether
2. work on asset classes like INDEX, CRYPTO, STOCK OPTIONS, FOREX, COMMODITIES
3. it may expand your knowledge about what detecting a convergence with pre-selected indicator really means
4.2 Supports and Resistances
The indicator displays the main algorithmic supports and resistances according to our trading method.
I think they're relevant for all asset classes, but you're absolutely free to use any different supports/resistances logic if you want to.
I'm not against it because I know that pivots, Fibonacci levels, etc. may work very well also.
4.6 Hard Exits
Our trading method is known for the hard exits, also called invalidation.
The Single Trend+ includes a hard exit based on a MACD - settings are flexible and you may update them.
Having a stop-loss protecting your trade is a best practice - Protecting your stop-loss also from getting hit is incredible.
We prefer invalidate a few positions, even if sometimes we don't want to. Rather than the market hard exiting on us, and leaving with our hard-working money.
4.7 Alerts
Alerts are enabled for:
- BUY/SELL MAIN triangles signals
- BUY/SELL SECONDARY diamond signals
- Hard Exits
V. Pain points that we're trying to solve with our Algorithm Builders
Issue #1 There are many informations / indicators / strategies / backtests / noise. Finding the right ones is not a simple task.
Solution #1 A reliable system that removes the external noise is much needed in trading to stay "in the game".
Issue #2 Trading could be quite stressful - The majority doesn't lose in trading because technical analysis is hard, but because managing our psychology is one of the hardest things a human can do.
Solution #2 Some ways to reduce the "trading stress" could be: getting better quality signals and trading like a "machine". Forgetting about Twitter and trusting the system you designed.
Issue #3 Trading without strict rules and only based on what we feel, or what we think the market should do is the fastest way to kiss our money goodbye.
Only 1 indicator generally is not enough. Traders generally use a combination of several indicators but they're monitoring them individually.
It's normal then to feel exhausted at the end of the day ^^ (to say the least)... and exhaustion leads to mistakes which leads to..... (I'm sure you got it) ... capital loss.
Solution #3 As a trader, I needed a trading framework and a method. I offer our trading method but they're plenty others out there. We cannot claim obviously it's the best ever ....but let's say we're using those exact same
scripts ourselves for our trading. And this what we've been recommending our clients to trade with for the past years. Also, having a tool detecting the convergence of several indicators and giving 1 unique signal
for BUY/SELL position will save you a lot of time/energy, and perhaps might help you out getting better trading performance.
VI. Resolving a complex puzzle and having fun in the process
Trading has to stay a passion and not (only be) a source of intense stress.
The most successful traders I know are "trading geeks" - literally always looking for optimizing, searching for the best possible entries, setups, indicators, tools, etc.
For them, it's not even about the money anymore, but only about beating their previous performance.
Why are they doing this? Because it's fun
Might appears as a bold statement, but I guarantee that looking for setups is fun.
One of our users even told us, that it's like playing with "Legos" and we couldn't possibly agree more.
VII. Designing a system that "makes sense"
Another bold statement now. Brace yourselves ladies and gentlemen
The Algorithm Builders allow to design trading systems quickly. What could takes days/weeks/months to find out... might be now within your reach in less than a few hours.
With a bit of practice, less than an hour might be enough per asset/timeframe to find a system that makes sense to you and adapted to your trading capital and psychology.
Assuming our users read our guides and are fully committed to learning a new way of trading - then we do guarantee you'll be able to design kick-ass trading systems that make sense.
"Making sense" doesn't mean at all it's guaranteed to win, it means you're the one defining the convergence of indicators, using your Algorithm Builder, and observe that most of the time - whenever there is a BUY signal, the candlesticks are going upwards - whenever there is a SELL signal, it's going downwards.
This is a necessary step to make real progress from a trading analyst perspective - and hopefully could lead to profits.
VII. Algorithm Builder versus the main trader enemy(=psychology)
This indicator has the goal to help solving one of the MAIN issues encountered by traders.
Most of traders realize, they can't perform with only 1 indicator (or 1 price pattern or 1 price action) and need a combination of multiple indicators before getting in a trade.
Far from being a magic pill, if it could at least reduce the stress you have while trading, then we'll consider we made a great job - it's a technical "useless noise remover", and needs to be followed strictly.
Such trust in a trading system can only be built by testing your Algorithm Builder configuration on either:
1. a demo account
2. or a live account with small bids. And then, increasing progressively the bids if your capital increases progressively.
Though, you should still use your common sense. (for instance: if we get a BUY signal right on a big timeframe resistance we're hitting for the first time).
I'm aware this is a new way of trading but for many, and while we cannot foresee the future, neither predict performance, we believe it might save you a lot of time to find good signals.
My maximum level of happiness will be reached the day when our users will contact me and showing me setups being mine.
I'm sure that even I can learn from my users and, we can all learn from each other Algorithm Builder configuration
VIII. What is a wrong or bad configuration?
Simply put. If you see that most of your signals react such as described below:
1. a buy triangle predicts, most of the time an upwards move
2. a sell triangle predicts, most of the time a downwards move
3. you estimated yourself the stop-loss needed to give enough room for your trades.
4. take profits based on algorithmic support and resistances or your own take profit method.
So what's a good Algorithm Builder configuration? A configuration you're happy with and makes sense.
A better Algorithm Builder setup is one used in demo or a live account w/ small bids for a few weeks, and you're consistent in your trading performance.
If you have any doubt or question, please hit me up directly or ask in the comments section of this script.
I'll never claim I have the best trading methodology or the best indicators. You only will be the judge, and I'll appreciate all the questions and feedback you're sending my way.
They help me a ton to develop indicators based on all the requests I received.
Kind regards,
Dave

WBCC Scalp StrategyИндикатор для Scalp сделок, использовать рекомендуется исключительно на временных интервалах от 1 часа и ниже.

WBCC Main TrendИспользуется для определения движения основного тренда (Long/Short), а так же успешно может быть применен и на более маленьких временных интервалах.
WBCC Level StrategyКраткое описание настройки:
Trend Period - количество свечей для расчета тренда.
WBCC_Level - уровень влияет на быстроту сигнала, чем меньше уровень тем быстрее сигнал появится, чем выше уровень тем меньше ложных сигналов и стабильней входы в Long и Short (рекомендованные параметры - 0.45-0.65)
Рекомендованное использование на Time Frame графика от 1 часа и выше.

TEDong Price Velocity MotionHi Folg,
TEDong Price Velocity Motion indikator for XBT is based on Physics Newton Law.
It gives a Buy signal when the Line value crosses up its EMA and a Sell signal when it crosses down its EMA .
Cross over markers Directional bgcolor, where RED for bearish (S) and GREEN for bullish (B)
If you include volume analyses in your trading strategy, automating EDong Price Velocity Motion will give buy signals whenever volume and price are rising altogether.
HINT:
Bullish when line/BG is green, bearish when line/BG is red. BUY on first green candle, SELLl on first red candle.
DONATE/TIP
BTC: 13nhMN2H4LoRi4VMcPcyR96jitxrH3uivB

TEDong Velocity/Acceleration: Physics Newton LawHi Folg,
In physics, equations of motion are equations that describe the behavior of a physical system in terms of its motion as a function of time.
Kinematics motion is simpler as it concerns only variables derived from the positions of objects, and time. In circumstances of constant acceleration, these simpler equations of motion are usually referred to as the SUVAT equations, arising from the definitions of kinematic quantities: displacement (s), initial velocity (u), final velocity (v), acceleration (a), and time (t).
A differential equation of motion, usually identified as some physical law and applying definitions of physical quantities, is used to set up an equation for the problem. Solving the differential equation will lead to a general solution with arbitrary constants, the arbitrariness corresponding to a family of solutions. A particular solution can be obtained by setting the initial values, which fixes the values of the constants. To state this formally, in general an equation of motion M is a function of the position r of the object, its velocity (the first time derivative of r, v = dr/dt
), and its acceleration (the second derivative of r, a = d2r/dt2), and time t.
The following indikator is called TEDong Velocity/Acceleration, with alert LONG/BUY and SHORT/Sell.
DONATE/TIP
BTC: 13nhMN2H4LoRi4VMcPcyR96jitxrH3uivB


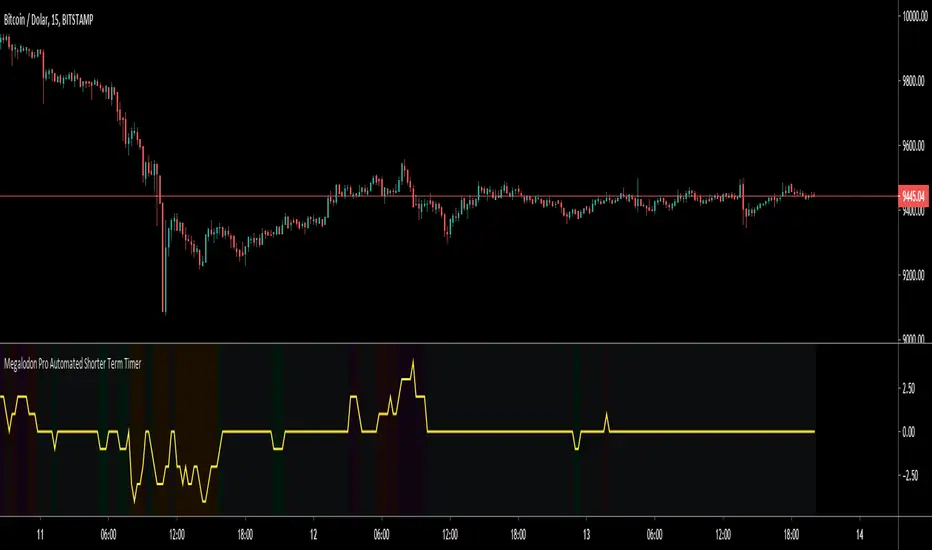
Megalodon Pro Automated Shorter Term TimerHow to use?
It should be used on 1 minute time frame for finding potential market reversal points.
It shows reversal signals by printing Green for Buy - Orange for Strong Buy - Red for Sell - Purple for Strong Sell signals.
Megalodon Pro Automated Longer Term TraderHow to use?
Yellow line isolates between 0-100.
It should be used on DAILY time frame for understanding the market state.
It prints Green for Bull - Orange for Strong Bull - Red for Bear - Purple for Strong Bear signals.

UncleBoUncleBo looks for the institutional finger prints, the whales or the big boys.
Looks for price, volume , momentum analysis tools and COMBINES the most famous indicators.
Works for any kind of market.
Only thing you have to do is forget about any indicator you used before and look at lines. This helps you overcome your emotions.
Another Millionaire toolBack with another Millionaire tool script, put like a solid 12 minutes here curve fitting the moving averages. THIS WILL MAKE YOU A MILLIONAIRE. It is so easy, it makes one of the hardest industries very very easy. Works on any market. I'VE DECIDED TO SHARE THE SCRIPT AND MAKE IT PUBLIC SO WE CAN ALL BE RICH TOGETHER, MILLIONAIRES

Millionare tool1. No lag, proprietary algorithm gives signal when position is triggered.
2. Ideal for ones who have tight stop losses but book profits very soon and miss the BIG move.
3. Works on Intraday/ positional/investment long term
4. Works on INDEX/ EQUITY/ FOREX/ CRYPTO CURRENCY
5. Works in any market all over the world, USA,LONDON, JAPAN,INDIA etc
6. 5d,1m,3m ,6m,1yr,5yr no problem.
7. Ideal for trend traders who want to catch the biggest move
8. All human emotions/temptations, silly indicators are out, get the signal? take the entry. simple as ABC
9.Use a breakeven stop loss or max 0.3%, never have a big loss, only big profits
*BUY on long signal, book profits when content, or on next short signal, can initiate fresh shorts too.
*Works in all markets mentioned
*Its your best friend to catch the trend. money
Some examples-
1) postimg.org
2) postimg.org
3) postimg.org
4) postimg.org
5) postimg.org
