ProfitunityCandlesProfitunity Candles have 4 labels, based off Bill Williams' work, particularly in his "Trading Chaos" book....Candles will generally be a Green, Squat, Fade or Fake. This is determined by Volume and MFI....Basically alerting you to the efficiency of the market at any given moment. You can research the meaning of the 4 types on your own, Google is your Friend.
Bill Williams Indicators


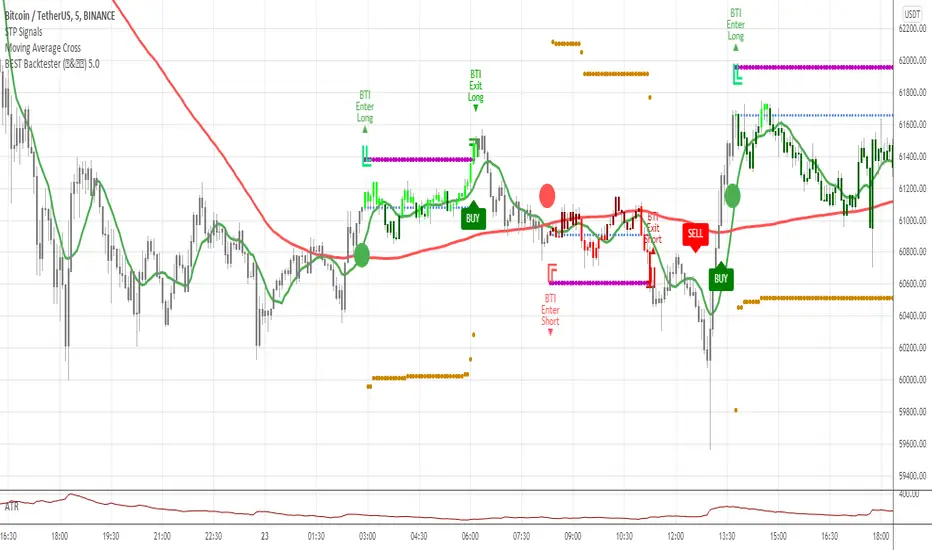
Full Range Trading Study with Alerts and DCA
Introduction
This is the study version of my range trading strategy. It is designed to be a “drop in” replacement for its twin strategy. I have replicated the analysis logic and entry and exit procedures to produce a nearly identical result set to the strategy. Other than the properties tab, the inputs dialog is exactly the same. Backtest the strategy to determine the best inputs to trade. Then apply the same inputs to this study to forward test. Alerts are available for trade entry, take profit close and stop-loss exit. Please see the strategy version for a complete description of the trading behavior of this script.
In brief, this script is intended to benefit from a range bound market. The trading behavior is to buy on weakness and sell on strength. As such trade orders are placed in a counter direction to price pressure. What you will see on the chart is a short position on peaks and a long position on valleys. This is accomplished by calculating pivot points from the price stream. Rising pivots are shorts and falling pivots are longs. I refer to pivots as a vertex in the inputs dialog box. The cone based measurement adds a peak, sides and a base to the calculation elements. This allows the inputs to focus on adjusting the location of trades and not just trend lines. The pivot points can be plotted on the backtest. You can use the vertex input values to move the pivots where you want trades to be. This script can be traded in four different modes: Long, Short, BiDir, and Ping Pong. When trading in “Ping Pong” mode long and short positions are intermingled continuously as long as there exists a detectable vertex. I also have a trend following version of this script for those not interested in trading the range.
This script employs a DCA feature which enables users to experiment with loss recovery techniques in the backtest. Here in the study the summary report displays the “Debt Sequence” number which can be used to manually increase the order size on subsequent trades at the broker. The script keeps track of debt incurred from losing trades. When the debt is recovered the “Debt Sequence” resets to zero so orders can return to the base size. Be sure to set the limiter to prevent your account from depleting capital during runaway markets.
Consecutive loss limit can be set to report a breach of the threshold value. Every stop hit beyond this limit will be reported on a version 4 label above the bar where the stop is hit. Use the consecutive loss limit to manually halt live trading on the broker side.
Design
This script uses twelve indicators on a single time frame and is approximately 1800 lines of Pine 4 code. The original trading algorithms are a port from a much larger program on another trading platform. I’ve converted some of the statistical functions to use standard indicators available on TradingView. The setups make heavy use of the Hull Moving Average in conjunction with EMAs that form the Bill Williams Alligator as described in his book “New Trading Dimensions” Chapter 3. Lag between the Hull and the EMAs form the basis of the entry and exit points. The vertices are calculated using one of five featured indicators: Volume, Histogram, Fractal, Candle and Macro. The backtest is used to determine the best fit for your desired trading instrument. The incorporation of five distinct pivot point calculations broadens the scope of the markets where this tool can be beneficial.
Example configurations for various instruments along with a detailed PDF user manual is available.
Indicator Repainting
Please see the strategy script for a more detailed description of the repaint problem. The goal of my repaint prevention in the study script is simply to ensure that my signal trading bias remains consistent between the strategy, study and broker. This script employs the following conventions in effort to avoid indicator repainting:
1. This script uses only 1 time frame. The chart interval.
2. Every entry and exit condition is evaluated on closed bars only.
3. Entry and exit plots are not triggered off trend line crossovers.
4. No security functions are called to avoid a look-ahead possibility.
5. Every contributing factor specified in the TradingView wiki regarding this issue has been addressed. Except the use of the exponential moving average which is essential to my strategy.
6. I’ve run a 10 minute chart live for a week and compared it to the same chart periodically reloaded. The two charts were highly correlated with no instances of completely opposite real-time signals
This script does indeed bring up the TradingView warning dialog. The only reason for this is due to “peculiarities of the algorithm” regarding the EMA as stated in the wiki article.
The Bottom Line. Does this script repaint. Yes, it will repaint about as much as every other trading platform which combines backtest data with real time prices in a live trading scenario.
Usage
Please be aware that the purpose of the study script is to perform forward testing of the configuration established in the backtest process. Therefore, the usage here in the study begins with the backtest configuration parameters. The following steps provide instructions to get this study script connected to the TradingView alert notification system. For a detailed description of how to create a range trading system using this script please see the strategy version.
Step 1. Create a chart with the trading instrument and interval used in the backtest.
Step 2. Find this script in the “Invite Only” section of the Indicators Dialog and apply it to the current chart.
Step 3. Copy the values from the backtest input dialog to the study.
Step 4. Open the TradingView Alert window.
Step 5. In the “Condition” drop down field find and select the name of the script.
Step 6. A new drop down field will appear with the alerts available in the script. This script exposes the following six signals:
Long Entry Signal
Long Profit Signal
Long Stop-loss Signal
Short Entry Signal
Short Profit Signal
Short Stop-loss Signal
Select the signal for which you want notification.
Step 7. In the “Options” field select the frequency of the alert. Typically, "Once Per Bar" or "Once Per Bar Close" will be sufficient.
Step 8. Set the expiration date and time.
Step 9. Select the action of the alert. Currently TradingView offers six different actions:
Notify on App
Show Popup
Send Email
Webhook URL
Play Sound
Send Email to SMS
Step 10. Create a message to to transmitted with the alert. The script provides a default message which can be overridden with any custom description. The price, time and other reserved chart elements can be included in the message
Step 11. Click the “Create” button to generate this single alert.
Step 12. Repeat steps 1 through 11 for every signal you wish to receive.
This script is open for beta testing. After successful beta test it will become a commercial application available by subscription only. I’ve invested quite a lot of time and effort into making this the best possible signal generator for all of the instruments I intend to trade. I certainly welcome any suggestions for improvements. Thank you all in advance.

FractalsMLCombine 2 Fractals into one indicator with default left and right bars are 6 and 24 respectively.
It's for Forex Traders Vietnam group.

Study Bot IgnaceThis INVIT-ONLY strategy is based on EMA / Fixe SL / William and you optimize for 1min scalping on bitmex
Please use comment section for any feedback.
I have also a study with alarms Long Entry / Long Exit / Short Entry / Short Exit
For any question DM me for any request.
## DISCLAIMER
1. I am not licensed financial advisors or broker dealers. I do not tell you when or what to buy or sell. I developed this software which enables you execute manual or automated trades multiple trades using TradingView. The software allows you to set the criteria you want for entering and exiting trades.
2. Do not trade with money you cannot afford to lose.
3. I do not guarantee consistent profits or that anyone can make money with no effort. And I am not selling the holy grail.
4. Every system can have winning and losing streaks.
5. Money management plays a large role in the results of your trading. For example: lot size, account size, broker leverage, and broker margin call rules all have an effect on results. Also, your Take Profit and Stop Loss settings for individual pair trades and for overall account equity have a major impact on results. If you are new to trading and do not understand these items, then I recommend you seek education materials to further your knowledge.
**YOU NEED TO FIND AND USE THE TRADING SYSTEM THAT WORKS BEST FOR YOU AND YOUR TRADING TOLERANCE.**
**I HAVE PROVIDED NOTHING MORE THAN A TOOL WITH OPTIONS FOR YOU TO TRADE WITH THIS PROGRAM ON TRADINGVIEW.**


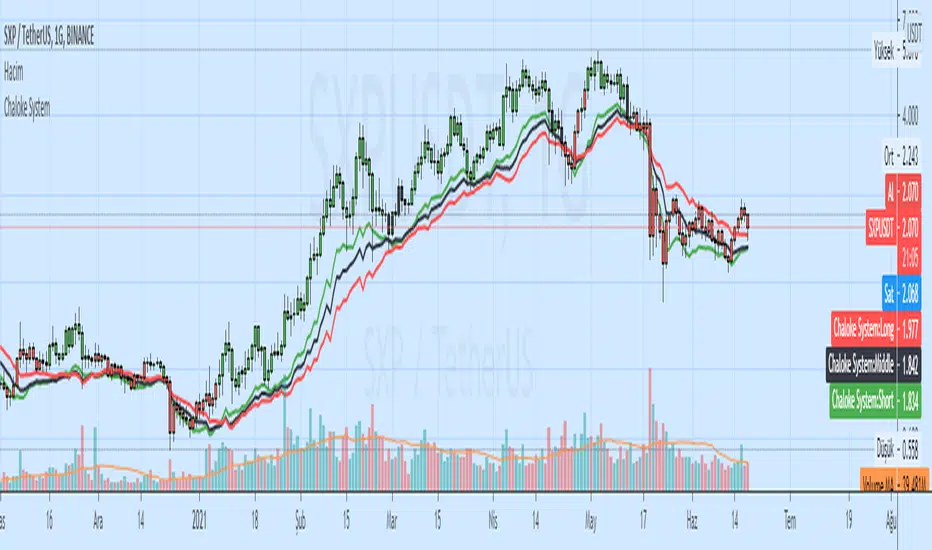
Chaloke SystemChaloke System
Buy=Short>Middle and Close > Short ,barcolor(green)
Sell=Close < Long or Short
[Aill3urs V.0.5] Study AlbertIt's the Study of the this Aill3urs-V-0-4-Strategy-Albert-EMA-Level-S-R-William you can find below.
For any info DM me.
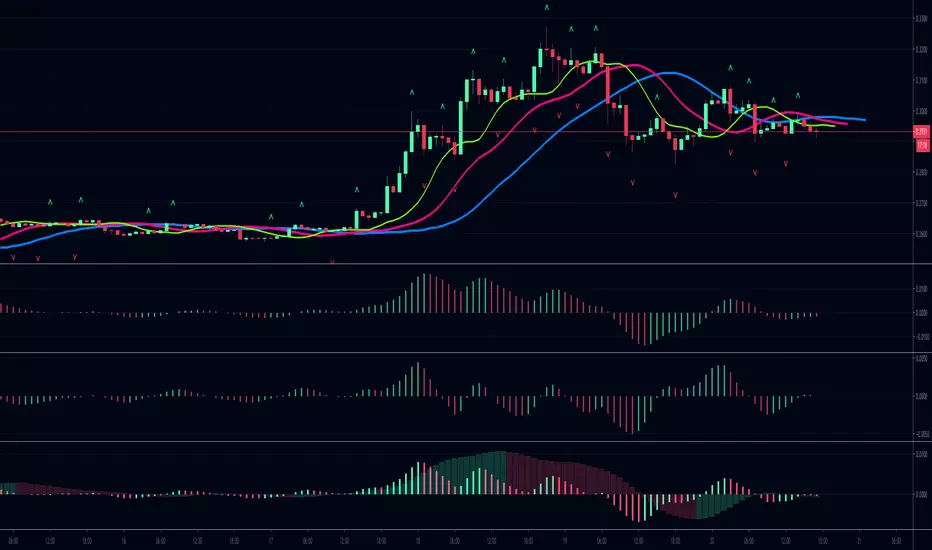
Market Structure Bias_edIdentify trends:
based on William Fractal pivots,
market structure shifts with bar close
wicks based on standard deviation

Backtest PREMIUM Suite+ (Plug & Play)Hello traders
I. 💎 SCRIPTS ACCESS AND TRIALS 💎
1. For the trial request access, they have to be done through my website .
2. My website URL is in this script signature at the very bottom (you'll have to scroll down a bit and going past the long description) and in my profile status available here : Daveatt
Due to the new scripts publishing house rules, I won't mention the URL here directly. As I value my partnership with TradingView very much, I prefer showing you the way for finding them :)
3. Many video tutorials explaining clearly how all our indicators work are available on our website > guides section.
4. You may also contact me directly for more information
II. 🔎 Backtest PREMIUM Suite+ (Plug & Play) 🔎
2.1 Forewords
This indicator is available only to our PREMIUM 12 months users. YES! I said indicator, and not strategy or backtest for an excellent reason.
We wanted to make it as generic as possible and allow anyone to connect any indicator of his/her choice in a few clicks only.
This is NOT possible (in TradingView) with a strategy/backtest, but only with an indicator - that's why we worked on recoding the whole backtest logic as an indicator.
The PRO edition does not handle any pyramiding/re-entry - as such enters only once per trend by design. This feature is reserved for our PREMIUM users.
2.2 Concept
This is an indicator that I saw on TradingView and was introduced by the @Pinecoders account on TradingView.
I inspired myself from his Backtest Engine to offer a version more adapted to my vision - The benefits of connecting yourself any indicator to our Backtest engine are amazing and huge.
The concept can't be more simple. Imagine using any indicator and connecting to a backtest system in a single click.
You may connect your Algorithm Builder also to this complete backtesting system in a single click.
What's better between paying thousands for each backtest, or connecting yourself your indicators to your backtest with a click?
That was a rhetoric question, but you can still share your answer with me if you want to :)
III. The amazing benefits of our🔌&🕹️ (Plug&Play) system
Issue #1 💲 A BACKTEST SYSTEM IS COSTLY 💲
Hiring a developer to code a custom indicator is costly. For a custom backtest it's even more expensive as those scripts are very often way more complicated.
Now imagine, that now that you see your idea live on a chart, you'll realize you'll have to finance another backtest system, as the one you have is not compatible with your new idea.
Solution #1 💲💲 YOU COULD BE SAVING SOME MONEY 💲💲
just because it won't be needed to hire someone else for each of your trading idea.
We will never guarantee your success on the market, but THIS I stand by it any day any hour.
You can connect any indicator or your choice by updating your indicator slightly and connecting it to our Backtest engine. We send the tutorial for doing it to all our customers.
Issue #2 🕔 IT'S TIME-CONSUMING 🕔
Even if someone is doing all the coding for you, it might require days/weeks depending on your overall trading strategy/idea.
Without even counting the time for you to test/validate the work done and all the back-and-forth to fix all the issues.
Solution #2 SAVING TIME MIGHT EQUATES TO SAVING MONEY : 🕔 = 💲💲💲
I wish it could be as easy as going from weeks of coding to "1 single click" :)
I did the heavy-lifting, but you'll have to make the last effort the cross the finishing line. I made it easy for you to play with it and find a configuration that makes sense to YOU and for your strategy/asset/timeframe
Issue #3 ❌ IT'S COMPLICATED ❌
Someone did a backtest code for you, but... you can't update it because you either :
- don't know anything in programming
- ... and don't have time to learn (most of us have a job/family/...life)
- The system you have is way too specific for one of your previous idea, but can't be updated easily for your next trading ideas. I see a lot of traders nodding right now thinking "that's soooooo true !!!!"
Solution #3 🎉 WE MADE IT EASY AND FUN 🎉
Our goal is to externalize the technical stuff that you don't want to take care of - so that you can finally focus on your trading and optimizing your ideas. #bold #statement
In case you're wondering, no we're not reading your mind :), but we're also traders who didn't know how to code before and had to hire external programmers to do the heavy work for us.
You can be sure that most of the frustrations (trading, technical, ...) you have/had, we had them also and that's why we created this backtest indicator.
III. 🔌&🕹️
Hope you're ready to be impressed. Because, what I'm about to introduce, is my best-seller feature - and available across many of my indicators.
In TradingView, there is a feature called "Indicator on Indicator" meaning you can use an external indicator as a data source for another indicator.
I'm using that feature to connect any external indicator to our Backtest PREMIUM Suite+ (Plug & Play) - hence the plug and play name. Please don't make it a plug and pray :) it's supposed to help you out, not to stress you even more
Let's assume you want to connect your Algorithm Builder Multiple Trends+ to your Backtest PREMIUM Suite+
I mentioned an Algorithm Builder but you may connect any oscillator (MACD, On balance volume, stochastic RSI, True Strenght index, and many more..) or non-oscillator (divergence, trendline break, higher highs/lower lows, candlesticks pattern, price action, harmonic patterns, ...) indicators.
THE SKY IS (or more likely your imagination) is the limit :)
Fear no more. The Plug&Play technology allows you to connect it and use it the backtest calculations.
This is not magic, neither is sorcery, but certainly is way beyond the most awesome thing I've ever developed on TradingView (even across all brokers I know). #bolder #statement
TradingView is the best trading platform by far and I'm very grateful to offer my indicators on their website.
To connect your external indicator to ours, we're using a native TradingView feature, which is not available for all users.
It depends on your TradingView subscription plan ( More info here )
If you intend to use our Algorithm Plug&Play indicator, and/or our Backtest Plug&Play suites, then you must upgrade your TradingView account to enjoy those features.
We value our relationship with our customers seriously, and that's why we're warning you that a compatible TradingView account type is required - at least PRO+ or PREMIUM to add more than 1 Plug&Play indicator per account.
We go in-depth on our website why the Plug&Play is an untapped opportunity for many traders out there - URL available on my profile status and signature
IV. 📊 Make it nice! 📊
Now we're getting right into the fun stuff.
Let's explore briefly each display option (symbolized by an 👁️🗨️ in the Backtest UI) :
- Color Traded Background : Color the chart background is green when in a BUY trade, in red when in a SELL trade. If the Backtest is not in a trade, then the background won't be colored.
- Show Entry/Exit Markers : Displays the entries (Enter Long/Enter Short), and exits (Exit Long/Exit Short) labels.
- Show Entry Level : Displays a blue level line to easily identify the entry price of a trade.
- Show Take Profit Level : Display a purple line to visualize where the Take Profit level is (we'll explain below how to set it up).
- Show In-Trade Stops : Display the stop-loss
V. Backtesting filters
A backtest should have some filters helping the traders testing a few hypotheses. Well.... we included a ton of them.
Once again, thank you @Pinecoders for the help and support you gave me
5.1 ↑ Trade Direction ↓
- Both: The backtest takes the BUY, and SELL trades.
- Longs only/Short only: To be used if the trader wants to take the trades in a unique direction only
5.2 ▲🔷Pyramiding🔷▼
The Backtest PRO allows 1 entry per identified trend
Pyramiding has many names such as Re-entry, secondary trend, Additional entry, ...
Basically, it refers to entering multiple times in the same trend.
Maximum Number of Pyramiding Entries: Literally the max number of re-entries in the same trend.
For instance, if set to 2, then depending on the signals, you'll get at most 2 re-entries in the same trade direction.
- Position Size Multiple of Original Entry Position: Option to add X multiples of the original position size for the re-entries.
Example: Position size multiple = 2, and First entry size is $100. Then, the re-entries position sizes will be ($100 X 2 = $200).
5.3 ▄ █ Position sizing █ ▄
- 1. % of Equity: If selected, the position size used is the input to the right of 1. % of Equity.
Example: The trader starts with a capital of 100K. After a winning trade, your total capital is $103K - for the next trade the position size will be 3% of $103K
- 2. % of Capital: If selected, the position size used is the input to the right of 2. % of Capital.
In other words, the position size will always be the same position size as calculated on the initial capital.
Example: The trader starts with a capital of 100K. After a winning trade, your total capital is $103K - for the next trade the position size will be 5% of $100K. (As 100K is the initial capital used in our dummy example)
5.4⛔ Entry Stops and In-Trade Stops ⛔
We didn't reinvent the wheel here. Any good backtest should offer an entry stop-loss and an in-trade stop-loss.
Giving only here also an example among all the use cases. For instance, the trader sets a stop-loss 2% at the time of entry on your trade, but once the trade moves in the desired direction, the trader might want a trailing stop-loss using a 4% input.
Example: A trader goes LONG on only 1 "ABC" stock evaluated $10 per share.
1) The entry-stop loss will be 2% away so set at $8
2) A candle
3) The trailing stop will activate, and move the stop-loss from the entry stop-loss level (=$8) to $8.32 (=4% move up from $8) - and so on, and so forth for each time the price moves 4% up
The entry and in-trade stop losses can absolutely be identicals. There is no universal rule, and as always you know the drill - all depends on your backtest, and trading strategy as a whole.
5.5 ❌ Hard Exits ❌
⚠️The Backtest PRO Suite offers the hard exit on MACD only.
Our Backtest PREMIUM Suite offers 2 more indicators to invalidate your trades on :
1. MACD
2. Trend Direction
3. RSI divergence (Regular, and Hidden)
The hard exit (or invalidation) is a fundamental part of my trading method.
I explained numerous times on TradingView, our website, and social media channels why I "love" this concept so much, and how it saved my trading account numerous times from getting savagely wrecked by the market.
5.6 💲💲 Take Profit 💲💲
We only included 1 level of Take Profit so far. We'll work on adding at least one more soon.
You can set your Take Profit level based on either a:
1- Fixed value
2 - Percentage value
5.7 📆 Date Range Filtering 📆
If enabled, the backtest only uses the data between the starting and the ending dates of the defined range.
5.8 ⏱️ Hourly Range Filtering ⏱️
Please note that the hours filtering is based on the broker time - not on your chart time.
In other words, if your chart is UTC+1, but you're trading an asset from a US EAST COAST broker, then the timezone used is the UTC-4 timezone.
You'll must be wary of this when filtering and probably do a quick (but simple) calculation before setting up this option.
The easiest would be to set your chart timezone on the broker local timezone (and no math is needed).
Let's add a quick note that the hourly filter is also included in our Algorithm Builders PRO/PREMIUM 12 months. #shameless #self #advertising
5.9 ❗❗ Fees and Slippage ❗❗
Too often completely ignored by many traders, the fees can eat gains out quickly/deepen one's capital faster than expected.
⚠️The fees vary between brokers, and asset traded - it could be recommended to check on your broker page what are the fees for the asset on your chart, and insert that percentage number.
Another cost ignored, even more, is the Slippage.
i.e. think about a Stop-Loss being hit, and we're so confused because we see on the chart that NEVER the price came even close to your SL level, but... it got hit anyway.
Yes! we know how frustrating it is, but that's the game we're playing, and trading should never be about blaming the game, but only blaming the players/traders/ourselves.
Blaming the game constantly is likely to not end with good performance results, but accounting for this "risk", and being able to quantify it is an incredible hedge. #bold #statement #level #10000
5.10 🔔 Alerts 🔔
By design, the alerts aren't available for strategy scripts. But this script is an... indicator so why should we not enjoy all the cards in our hands the fullest.
We enabled the alerts on the:
1. Main BUY/SELL Entry
2. Pyramiding BUY/SELL Entries
3. Exit Signals such as stop-loss, take-profit, hard-exits
You're welcome :)
VI. 📝 Where are the backtest results? 📝
Answer: in the Data Window section of your TradingView
Now the cherry on the cake if we might say so. A backtest is cool, but visualizing results is actually the end goal here.
Our PREMIUM users benefit from way more analytics than the PRO users.
More info available on our website.
The Data Window is dynamic - it means whenever you'll mouseover at a give time on your chart, the data on that panel automatically updates.
Let's assume you're backtesting your idea between Sept 1st, 2019, and Oct 1st, 2019.
If your mouse cursor is located (or hovered) at a candle on Sept 14th, 2019 (data chosen randomly for this example), then the data displayed only includes the results between Sept 1st, and Sept 14th.
More info available on our website with a nice tutorial video. Data window metrics and filters explained on our website
Here's what the data window looks like: imgur.com
If you have any doubt or question, please hit me up directly or ask in the comments section of this script.
I'll never claim I have the best trading methodology or the best indicators.
You only will judge and I'll appreciate all the questions and feedback you're sending my way.
They help me a ton to develop indicators based on all the requests I received.
Kind regards,
Dave

Double Trend Market FlowArea Green and pink is moneyflow per candle
line green and red is wave per candlle
blue is true volume
and histogram is volume
Mid line is Neutral
below Mid line is Bearish Zone
above Mid line is Bullish Zone
Line dot 53-60 at above or below is become Manipulated if opposite to true volume
moneyflow cross up in bearish zone is not safe
moneyflow cross down in bullish zone is correction

Volume-supported Fractal SRModified version of SynapticEX's Volume-supported Fractal S/R with EMA instead of SMA, pinescript 4 port, and EMA20/EMA50 defaults for support and resistance.
EMA20 = red/green
EMA50 = orange/yellow

Double Gaussian Awesome Oscillator by KviateqThis is an experimental indicator based on Bill Williams' Awesome Oscillator, however this one is coded using Gaussian Smoothed MAs, and showing both short and long-term trend.
The bright line histogram shows short term trend, the columns show long term trend.
To be used the same way as Bill William's strategy for AO, with added confirmation of longer trend.
Gaussian Acceleration/Deceleration by KviateqBill Williams' AC (Acceleration/Deceleration), made using Gaussian-smoother Moving Averages and a 5-period EMA instead of the usual SMA.
Since Gaussian MA's are faster reacting than the typical SMAs values have been adjusted accordingly.
See also Gaussian Alligator and GaussianAO for a complete gaussian chaos trading system.
These scripts are made to honor Bill and his amazing work and my humble attempt at contributing to his work

Gaussian Awesome Oscillator by KviateqBill Williams' Awesome Oscillator, made using Gaussian-smoother Moving Averages.
Since Gaussian MA's are faster reacting than the typical SMAs values have been adjusted accordingly.
See also Gaussian Alligator and GaussianACDC for a complete gaussian chaos trading system.
These scripts are made to honor Bill and his amazing work and my humble attempt at contributing to his work

Gaussian Alligator by KviateqBill Williams' Alligator, made using Gaussian-smoother Moving Averages.
Since Gaussian MA's are faster reacting than the typical SMAs values have been adjusted accordingly.
See also GaussianAO and GaussianACDC for a complete gaussian chaos trading system.
These scripts are made to honor Bill and his amazing work and my humble attempt at contributing to his work


Fractal Framer added buy sellThis script was written by Brobear and published. I only modified by adding buy and sell signal when price crossover fractal channel.
buy_breakout=crossover(close,fracLevelHigh) and OsMA >OsMA and emaRSI >emaRSI
sell_breakout=crossunder(close,fracLevelLow) and OsMA
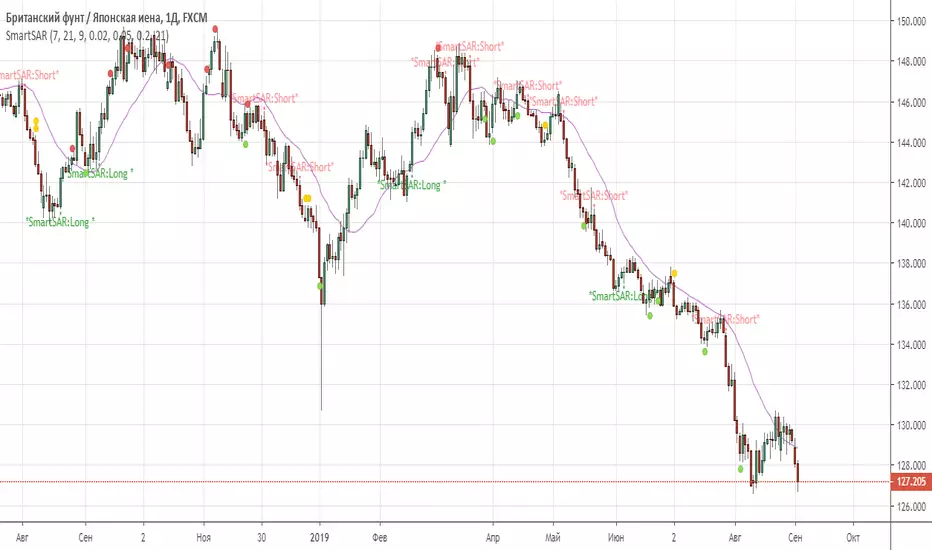
SmartSARSAR signal filtered by 3 indicators: MACD, AC, RVI.
This combination of trend indicator(SAR), 2 oscillators (MACD, RVI) , and 1 Bill Williams (AC) give us good Enter point.
Recommended timeframes: from 30 min and higher.
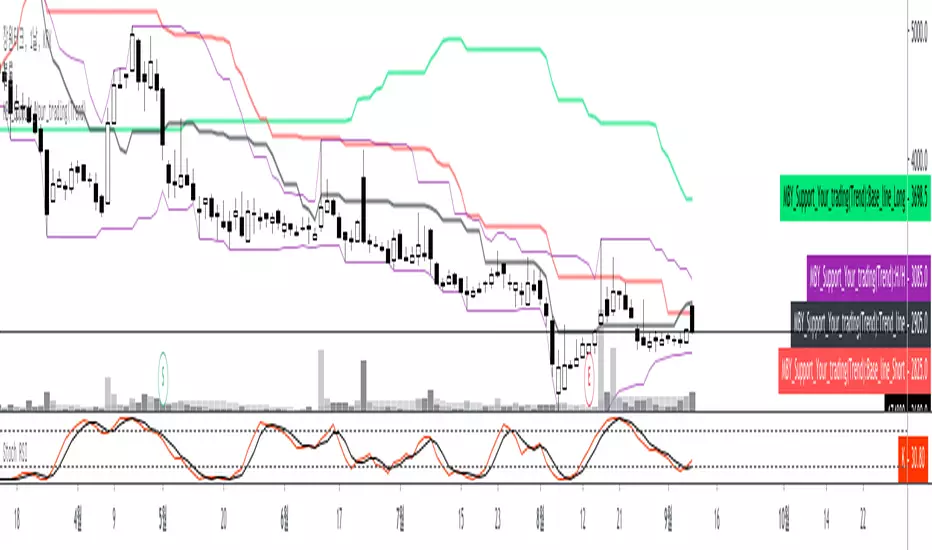
[MBY]Support Your Trading(Trend ver)Hi, this is Yong.
This indicator Support Your Trading,
based on Trend channel & etc.,
this version only for test.