Trend Range Detector (Zeiierman)█ Overview
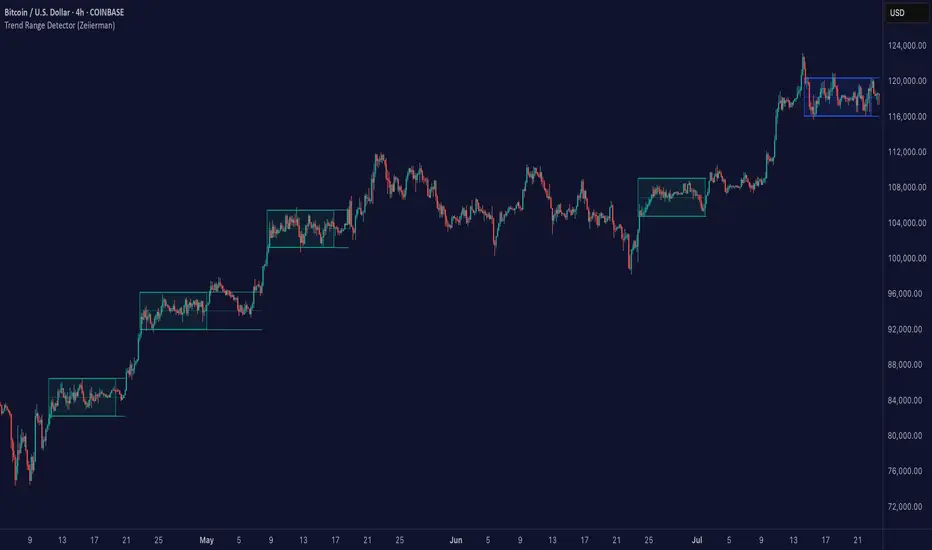
Trend Range Detector (Zeiierman) is a market structure tool that identifies and tracks periods of price compression by forming adaptive range boxes based on volatility and price movement. When prices remain stable within a defined band, the script dynamically draws a range box; when prices break out of that structure, the box highlights the breakout in real-time.
By combining a volatility-based envelope with a custom weighted centerline, this tool filters out noise and isolates truly stable zones — providing a clean framework for traders who focus on accumulation, distribution, breakout anticipation, and reversion opportunities.
Whether you're range trading, spotting trend consolidations, or looking for volatility contractions before major moves, the Trend Range Detector gives you a mathematically adaptive, visually intuitive structure that maps the heartbeat of the market.
█ How It Works
⚪ Range Formation Engine
The core of this indicator revolves around two conditions:
Distance Filter: The maximum distance between all recent closes and a dynamic centerline must remain within a volatility envelope.
Volatility Envelope: Based on an ATR(2000) multiplied by a user-defined factor to account for broader market volatility trends.
If both conditions are satisfied over the most recent length bars, a range box is drawn to visually anchor the zone.
⚪ Dynamic Breakout Coloring
When price breaks out of the top or bottom of the active range box, the box color shifts in real-time:
Blue Boxes represent areas where price has remained within a defined volatility envelope over a sustained number of bars. These zones reflect stable, low-volatility periods, often associated with consolidation, equilibrium, or market indecision.
Green Boxes for bullish breakouts.
Red Boxes for bearish breakdowns.
This allows traders to visually spot transitions from consolidation to expansion phases without relying on lagging signals.
█ Why Use a Weighted Close Instead of SMA?
A standard Simple Moving Average (SMA) treats all past closes equally, which works well in theory, but not in dynamic, fast-shifting markets. In this script, we replace the traditional SMA with a speed-weighted average that reflects how aggressively the market has moved bar-to-bar.
⚪ Here's why it matters:
Bars with higher momentum (larger price differences between closes) are given more weight.
Slow, sideways candles (typical in noise or low volume) contribute less to the calculated centerline.
This method creates a more accurate snapshot of market behavior, especially during volatile phases. As a result, the indicator adapts to market conditions more effectively, helping traders identify real consolidation zones, not just average lines distorted by flat bars or noise.
█ How to Use
⚪ Range Detection
Boxes form only when price remains consistently close to the speed-weighted mean.
Helps identify sideways zones, consolidations, and low-volatility structures where price is “charging up.”
⚪ Breakout Confirmation
Once price exits the top or bottom boundary, the box immediately highlights the direction of the break.
Use this signal in conjunction with your own momentum, volume, or trend filters for higher-confidence trades.
█ Settings
Minimum Range Length: Number of candles required for a valid range to form.
Range Width Multiplier: Adjusts the envelope around the weighted average using ATR(2000).
Highlight Box Breaks: Enables real-time coloring of breakouts and breakdowns for immediate visual feedback.
-----------------
Disclaimer
The content provided in my scripts, indicators, ideas, algorithms, and systems is for educational and informational purposes only. It does not constitute financial advice, investment recommendations, or a solicitation to buy or sell any financial instruments. I will not accept liability for any loss or damage, including without limitation any loss of profit, which may arise directly or indirectly from the use of or reliance on such information.
All investments involve risk, and the past performance of a security, industry, sector, market, financial product, trading strategy, backtest, or individual's trading does not guarantee future results or returns. Investors are fully responsible for any investment decisions they make. Such decisions should be based solely on an evaluation of their financial circumstances, investment objectives, risk tolerance, and liquidity needs.
Indicators and strategies
Bollingr+supertrend Hybrid ProIntroducing the Bollinger & Supertrend Hybrid Pro — a powerful all-in-one trend-following and volatility mapping tool designed for modern traders in Forex, Indices, Commodities, Crypto, and Stocks.
How it works:
The indicator overlays classic Bollinger Bands to capture market volatility, squeeze breakouts, and dynamic support/resistance zones.
Integrated Supertrend logic highlights trend direction using ATR (Average True Range), making trend reversals clear and visually clean.
Automatic Buy & Sell signals appear when trend direction flips — helping you stay on the right side of momentum.
Dynamic background fill colors show uptrend and downtrend zones for quick chart scanning.
Customizable Inputs:
Adjust Bollinger Band length, deviation, and MA type (SMA, EMA, WMA, SMMA, VWMA).
Fine-tune Supertrend ATR period and factor to match your strategy style.
Labels and signals for clear on-chart alerts.
Ideal For:
Intraday, swing, and positional traders.
Beginners and advanced users looking for a clean hybrid trend system.

Multi-Timeframe SMTSummery
The Multi-Timeframe SMT indicator is designed to identify and visualize Higher Timeframe (HTF) data on a Lower Timeframe (LTF) chart, allowing traders to see the broader market context without changing their current chart's resolution. It accurately draws pivots and SMT divergences from higher timeframes on the corresponding candles of your current lower timeframe chart.
Its core features include:
Multi-Timeframe Analysis: Configure and monitor pivots on up to four independent timeframes, from intraday to monthly.
Customizable Pivot Detection: Define the strength of pivots by adjusting the number of bars to the left and right.
SMT Divergence: Automatically identifies bullish and bearish SMT divergences by comparing the price action of the main chart symbol with a chosen correlated asset.
Early SMT Detection: A unique feature that monitors a lower "detection timeframe" to provide early warnings of potential SMT setups before they're confirmed on the main timeframe. Note that this early detection is only shown on timeframes equal to or lower than the "Detection timeframe" you have set.
Visual Cues & Alerts: Clear on-chart labels, lines, and fully customizable alerts notify you of confirmed pivots and SMT divergences, ensuring you don't miss key opportunities.
Important Nuance Regarding Pivot Label Display
Due to a self-imposed limit within this script's drawing management logic, the indicator might quickly reach its drawing capacity if you enable pivot crosses for multiple timeframes simultaneously. When this internal drawing limit is exceeded, the script is designed to automatically remove the oldest drawings to make space for new ones.
Therefore, to ensure optimal performance and visibility of the most recent and relevant pivots, it's highly recommended to only enable the "Show Pivot Crosses" option for one timeframe at a time. If you wish to view pivots for a different timeframe, simply disable the pivot crosses for the currently active timeframe and then enable them for your desired one. This approach prevents the rapid cycling and disappearance of pivot labels, providing a clearer and more stable visual experience.
In-Depth Explanation of the Logic
This script is built on two primary concepts: pivot points and Smart Money Technique (SMT) divergence. It systematically collects historical data on multiple timeframes, identifies pivots, and then compares them between two assets to find divergences.
Pivot Point Identification
A pivot is a turning point in the market. A pivot high is a candle that has a higher high than the candles to its immediate left and right. Conversely, a pivot low is a candle with a lower low than its neighbors.
How it Works in the Script:
The script tracks the highest high and lowest low for each period of the selected timeframe (e.g., for each 4-hour candle). When a new high-timeframe candle closes, it stores that high/low value and its bar index in an array. The checkForPivot() function then checks if a recently stored high or low qualifies as a pivot.
Key Inputs:
Left Strength (leftBars1): The number of candles to the left that must have a lower high (for a pivot high) or higher low (for a pivot low).
Right Strength (rightBars1): The number of candles to the right that must meet the same criteria.
For example, with Left Strength and Right Strength both set to 3, a pivot high is only confirmed when its high is greater than the highs of the 3 previous high-timeframe candles and the 3 subsequent high-timeframe candles. Increasing these values will identify more significant, longer-term pivots.
Smart Money Technique (SMT) Divergence
SMT Divergence is a concept popularized by The Inner Circle Trader (ICT). It occurs when two closely correlated assets fail to move in sync. For instance, if Asset A makes a higher high but Asset B fails to do so and instead makes a lower high, this creates a bearish SMT divergence. It suggests that the "smart money" may not be supporting the move in Asset A, signaling a potential reversal.
Bearish SMT: Main asset makes a higher high, while the correlated asset makes a lower high. This is a potential sell signal.
Bullish SMT: Main asset makes a lower low, while the correlated asset makes a higher low. This is a potential buy signal.
How it Works in the Script:
Data Request: For each timeframe, the script uses the request.security() function to fetch the high and low data for both the main chart symbol (syminfo.tickerid) and the chosen Comparison Asset.
Pivot Comparison: When a new pivot is confirmed on the main asset, the script checks if a corresponding pivot also formed on the comparison asset at the same time.
Divergence Check: It then compares the direction of the pivots. For a bearish SMT, it checks if the main asset's new pivot high is higher than its previous pivot high, while the comparison asset's new pivot high is lower than its previous one. The logic is reversed for bullish SMT.
Visualization: If a divergence is found, the script draws a red (bearish) or green (bullish) line connecting the two pivots on your chart and places an "SMT" label.
Early SMT Detection
This is a proactive feature designed to give you a heads-up. Waiting for a 4-hour or daily pivot to form can take a long time. The early detection system looks for SMT divergences on a much smaller, user-defined Detection timeframe (e.g., 15-minute).
How it Works in the Script:
Awaiting Setup: After a primary pivot (Pivot A) is formed on the main timeframe (e.g., a Daily pivot high), the script begins monitoring.
Intraday Monitoring: It then watches the Detection timeframe (e.g., 15-minute) for smaller intraday pivots.
Potential Divergence: It looks for an intraday pivot that forms a divergence against the primary Pivot A.
Watchline & Alert: When this "potential" divergence occurs, the script draws a dashed white line and triggers a "Potential SMT" alert. This isn't a confirmed SMT on the main timeframe yet, but it's a powerful early warning that one may be forming.
Drawing & Object Management
To keep the chart clean and prevent performance issues, the script manages its drawings (lines and labels) efficiently. It stores them in arrays and uses a drawing limit to automatically delete the oldest drawings as new ones are created, ensuring your TradingView remains responsive.
How to Use the Indicator
Configuration
Enable Timeframes: Use the checkboxes (Enable Timeframe 1, Enable Timeframe 2, etc.) to activate the timeframes you want to monitor. It's often best to start with one or two to keep the chart clean.
Select Timeframes: Choose the higher timeframes you want to analyze (e.g., 240 for 4-hour, D for Daily, W for Weekly).
Set Pivot Strength: The default of 3 for Left/Right strength is a good starting point. Increase it to find more significant market structure points or decrease it for more frequent, shorter-term pivots.
Configure SMT:
Check Enable SMT for the timeframes where you want to detect divergence.
Enter a Comparison Asset . This is crucial. Ensure the assets are correlated.
To use the early warning system, check Enable early SMT detection and select an appropriate Detection timeframe (e.g., 15 or 60 minutes for a Daily analysis).

Trinity Multi Time Frame Trend Dashboard and SignalsUpdated the logic behind the buy and sell signals to them for more responsiveness and also included an ADX filter.

Basic ORB [MOT]🟢 Basic ORB – Opening Range Breakout Indicator by MOT
The Basic ORB is a high-performance Opening Range Breakout (ORB) tool built for serious intraday traders. This indicator is being provided to the public for free.
It automatically draws the high, low, and midline of the 9:30–9:45 AM ET session, giving you a visual framework for high-probability breakout and reversal opportunities. You can customize line colors and enable historical ORBs — all from a clean, intuitive interface.
📌 1. ORB High, Low & Midline Levels
Function: Automatically draws the high, low, and midpoint of the 9:30–9:45 session.
ORB High (green line by default)
ORB Low (red line by default)
Midline (white line) helps gauge control or range equilibrium
📸 Live ORB range drawing: high, low, and midline levels.
🔁 2. Show Previous ORBs
Function: Displays up to N previous days' ORBs for pattern recognition or confluence stacking.
Previous ORB count up to chart data maximum
Great for seeing whether price respects prior opening ranges
📸 Historical ORB ranges for confluence and support/resistance.
🏷️ 3. Dynamic Price Labels
Function: Price labels are placed next to each ORB for quick visibility.
Labels can be toggled on/off
Customizable text color, background color, and size
Offset control available
⚙️ 4. Fully Customizable Settings Panel
Function: Every visual element is adjustable, including:
✅ Line color and width
✅ Number of historical ORBs
✅ Label size, position, background/text color
📈 Use Case
Works best on 1m, 5m, or 15m charts
Ideal for breakout traders, reversal scalpers, or gap/ORB retest strategies
Applies to futures, stocks, ETFs, indexes, and crypto
⚠️ Disclaimer
This indicator is intended for educational and informational purposes only. It is not financial advice. Trading involves substantial risk. Always use proper risk management and test in a simulated environment before applying live. The author is not liable for any fi

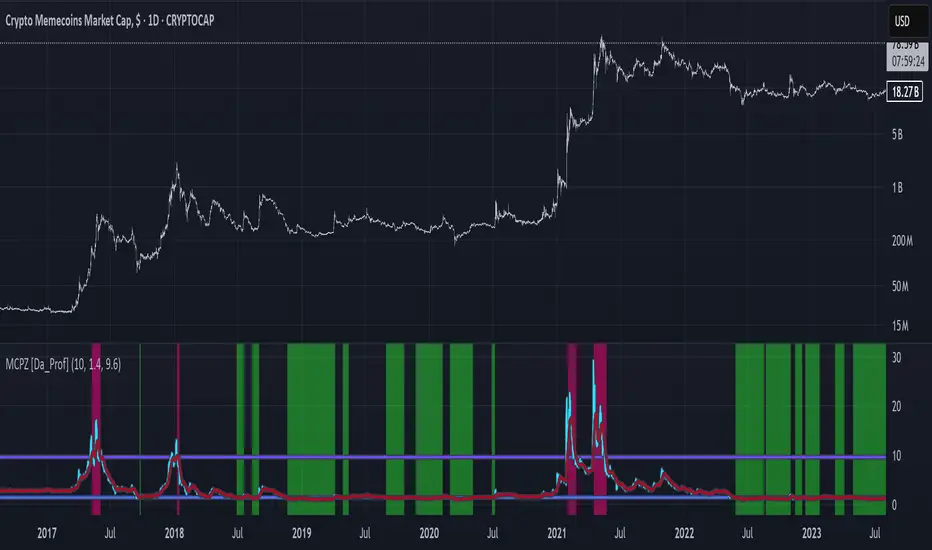
MCPZ - Meme Coin Price Z-Score [Da_Prof]Meme Coin Price Z-score (MCPZ). Investor preference for meme coin trading may signal irrational exuberance in the crypto market. If a large spike in meme coin price is observed, a top may be near. Similarly, if a long price depression is observed, versus historical prices, that generally corresponds to investor apathy, leading to higher prices. The MEME.C symbol allows us to evaluate the sentiment of meme coin traders. Paired with the Meme Coin Volume (MCV) and Meme Coin Gains (MCG) indicators, the MCPZ helps to identify tops and bottoms in the overall meme coin market. The MCPZ indicator helps identify potential mania phases, which may signal nearing of a top and apathy phases, which may signal nearing a bottom. A moving average of the Z-score is used to smooth the data and help visualize changes in trend. In back testing, I found a 10-day sma of the MCPZ works well to signal tops and bottoms when extreme values of this indicator are reached. The MCPZ seems to spend a large amount of time near the low trigger line and short periods fast increase into mania phases.
Meme coins were not traded heavily prior to 2020, but the indicator still picks a couple of tops prior to 2020. Be aware that the meme coin space also increased massively in 2020, so mania phases may not spike quite as high moving forward and the indicator may need adjusting to catch tops. It is recommended to pair this indicator with the MCG and MCV indicators to create an overall picture.
The indicator grabs data from the MEME.C symbol on the daily such that it can be viewed on other symbols.
Use this indicator at your own risk. I make no claims as to its accuracy in forecasting future trend changes of memes or any other asset.
Hope this is helpful to you.
--Da_Prof
Logarithmic Moving Average (LMA) [QuantAlgo Original Author: QuantAlgo
License: Creative Commons Attribution-NonCommercial-ShareAlike 4.0 International
Source: creativecommons.org
This script is originally developed by QuantAlgo and is shared under the CC BY-NC-SA 4.0 license.
I have reused and slightly modified it for personal learning and for the benefit of the TradingView community.
All core credits belong to QuantAlgo.
This version remains fully open-source and non-commercial, respecting the original license terms.
Anyone reusing or modifying this script must keep the same license and attribution.
— Modified & shared publicly by Mark804

Extreme Zone Volume ProfileExtreme Zone Volume Profile (EZVP) is a high-resolution, percentile-based volume profile tool designed for intuitive market structure analysis. Unlike standard profiles, EZVP emphasizes extreme zones — highlighting potential value rejection or accumulation areas using user-defined percentile thresholds.
Key Features:
Custom Lookback: Profiles volume over a defined number of bars (no rolling memory creep).
Zoned Percentiles: Segment volume by zones:
Zone B = extreme tails (e.g. 2.5% for one wing of ~2 Standard Deviations)
Zone A = outer wings (e.g. 14% for one wing of ~1 Standard Deviations)
Center = remaining bulk of traded volume
Rightward-Growing Bars: Clean, forward-facing display — avoids clutter in historical areas.
Colored Volume Bars: Each zone gets a distinct tone, helping spot high-interest levels fast.
Optional Lines: Toggle POC, Median, Mean, and zone boundary lines for cleaner setups.
This is built for clarity and control — a great fit for traders who want a visually expressive profile without overcomplication. Tweak the zoning percentages to match your strategy or instrument volatility.

Smart MTF S/R Levels[BullByte]
Smart MTF S/R Levels
Introduction & Motivation
Support and Resistance (S/R) levels are the backbone of technical analysis. However, most traders face two major challenges:
Manual S/R Marking: Drawing S/R levels by hand is time-consuming, subjective, and often inconsistent.
Multi-Timeframe Blind Spots: Key S/R levels from higher or lower timeframes are often missed, leading to surprise reversals or missed opportunities.
Smart MTF S/R Levels was created to solve these problems. It is a fully automated, multi-timeframe, multi-method S/R detection and visualization tool, designed to give traders a complete, objective, and actionable view of the market’s most important price zones.
What Makes This Indicator Unique?
Multi-Timeframe Analysis: Simultaneously analyzes up to three user-selected timeframes, ensuring you never miss a critical S/R level from any timeframe.
Multi-Method Confluence: Integrates several respected S/R detection methods—Swings, Pivots, Fibonacci, Order Blocks, and Volume Profile—into a single, unified system.
Zone Clustering: Automatically merges nearby levels into “zones” to reduce clutter and highlight areas of true market consensus.
Confluence Scoring: Each zone is scored by the number of methods and timeframes in agreement, helping you instantly spot the most significant S/R areas.
Reaction Counting: Tracks how many times price has recently interacted with each zone, providing a real-world measure of its importance.
Customizable Dashboard: A real-time, on-chart table summarizes all key S/R zones, their origins, confluence, and proximity to price.
Smart Alerts: Get notified when price approaches high-confluence zones, so you never miss a critical trading opportunity.
Why Should a Trader Use This?
Objectivity: Removes subjectivity from S/R analysis by using algorithmic detection and clustering.
Efficiency: Saves hours of manual charting and reduces analysis fatigue.
Comprehensiveness: Ensures you are always aware of the most relevant S/R zones, regardless of your trading timeframe.
Actionability: The dashboard and alerts make it easy to act on the most important levels, improving trade timing and risk management.
Adaptability: Works for all asset classes (stocks, forex, crypto, futures) and all trading styles (scalping, swing, position).
The Gap This Indicator Fills
Most S/R indicators focus on a single method or timeframe, leading to incomplete analysis. Manual S/R marking is error-prone and inconsistent. This indicator fills the gap by:
Automating S/R detection across multiple timeframes and methods
Objectively scoring and ranking zones by confluence and reaction
Presenting all this information in a clear, actionable dashboard
How Does It Work? (Technical Logic)
1. Level Detection
For each selected timeframe, the script detects S/R levels using:
SW (Swing High/Low): Recent price pivots where reversals occurred.
Pivot: Classic floor trader pivots (P, S1, R1).
Fib (Fibonacci): Key retracement levels (0.236, 0.382, 0.5, 0.618, 0.786) over the last 50 bars.
Bull OB / Bear OB: Institutional price zones based on bullish/bearish engulfing patterns.
VWAP / POC: Volume Weighted Average Price and Point of Control over the last 50 bars.
2. Level Clustering
Levels within a user-defined % distance are merged into a single “zone.”
Each zone records which methods and timeframes contributed to it.
3. Confluence & Reaction Scoring
Confluence: The number of unique methods/timeframes in agreement for a zone.
Reactions: The number of times price has touched or reversed at the zone in the recent past (user-defined lookback).
4. Filtering & Sorting
Only zones within a user-defined % of the current price are shown (to focus on actionable areas).
Zones can be sorted by confluence, reaction count, or proximity to price.
5. Visualization
Zones: Shaded boxes on the chart (green for support, red for resistance, blue for mixed).
Lines: Mark the exact level of each zone.
Labels: Show level, methods by timeframe (e.g., 15m (3 SW), 30m (1 VWAP)), and (if applicable) Fibonacci ratios.
Dashboard Table: Lists all nearby zones with full details.
6. Alerts
Optional alerts trigger when price approaches a zone with confluence above a user-set threshold.
Inputs & Customization (Explained for All Users)
Show Timeframe 1/2/3: Enable/disable analysis for each timeframe (e.g., 15m, 30m, 1h).
Show Swings/Pivots/Fibonacci/Order Blocks/Volume Profile: Select which S/R methods to include.
Show levels within X% of price: Only display zones near the current price (default: 3%).
How many swing highs/lows to show: Number of recent swings to include (default: 3).
Cluster levels within X%: Merge levels close together into a single zone (default: 0.25%).
Show Top N Zones: Limit the number of zones displayed (default: 8).
Bars to check for reactions: How far back to count price reactions (default: 100).
Sort Zones By: Choose how to rank zones in the dashboard (Confluence, Reactions, Distance).
Alert if Confluence >=: Set the minimum confluence score for alerts (default: 3).
Zone Box Width/Line Length/Label Offset: Control the appearance of zones and labels.
Dashboard Size/Location: Customize the dashboard table.
How to Read the Output
Shaded Boxes: Represent S/R zones. The color indicates type (green = support, red = resistance, blue = mixed).
Lines: Mark the precise level of each zone.
Labels: Show the level, methods by timeframe (e.g., 15m (3 SW), 30m (1 VWAP)), and (if applicable) Fibonacci ratios.
Dashboard Table: Columns include:
Level: Price of the zone
Methods (by TF): Which S/R methods and how many, per timeframe (see abbreviation key below)
Type: Support, Resistance, or Mixed
Confl.: Confluence score (higher = more significant)
React.: Number of recent price reactions
Dist %: Distance from current price (in %)
Abbreviations Used
SW = Swing High/Low (recent price pivots where reversals occurred)
Fib = Fibonacci Level (key retracement levels such as 0.236, 0.382, 0.5, 0.618, 0.786)
VWAP = Volume Weighted Average Price (price level weighted by volume)
POC = Point of Control (price level with the highest traded volume)
Bull OB = Bullish Order Block (institutional support zone from bullish price action)
Bear OB = Bearish Order Block (institutional resistance zone from bearish price action)
Pivot = Pivot Point (classic floor trader pivots: P, S1, R1)
These abbreviations appear in the dashboard and chart labels for clarity.
Example: How to Read the Dashboard and Labels (from the chart above)
Suppose you are trading BTCUSDT on a 15-minute chart. The dashboard at the top right shows several S/R zones, each with a breakdown of which timeframes and methods contributed to their detection:
Resistance zone at 119257.11:
The dashboard shows:
5m (1 SW), 15m (2 SW), 1h (3 SW)
This means the level 119257.11 was identified as a resistance zone by one swing high (SW) on the 5-minute timeframe, two swing highs on the 15-minute timeframe, and three swing highs on the 1-hour timeframe. The confluence score is 6 (total number of method/timeframe hits), and there has been 1 recent price reaction at this level. This suggests 119257.11 is a strong resistance zone, confirmed by multiple swing highs across all selected timeframes.
Mixed zone at 118767.97:
The dashboard shows:
5m (2 SW), 15m (2 SW)
This means the level 118767.97 was identified by two swing points on both the 5-minute and 15-minute timeframes. The confluence score is 4, and there have been 19 recent price reactions at this level, indicating it is a highly reactive zone.
Support zone at 117411.35:
The dashboard shows:
5m (2 SW), 1h (2 SW)
This means the level 117411.35 was identified as a support zone by two swing lows on the 5-minute timeframe and two swing lows on the 1-hour timeframe. The confluence score is 4, and there have been 2 recent price reactions at this level.
Mixed zone at 118291.45:
The dashboard shows:
15m (1 SW, 1 VWAP), 5m (1 VWAP), 1h (1 VWAP)
This means the level 118291.45 was identified by a swing and VWAP on the 15-minute timeframe, and by VWAP on both the 5-minute and 1-hour timeframes. The confluence score is 4, and there have been 12 recent price reactions at this level.
Support zone at 117103.10:
The dashboard shows:
15m (1 SW), 1h (1 SW)
This means the level 117103.10 was identified by a single swing low on both the 15-minute and 1-hour timeframes. The confluence score is 2, and there have been no recent price reactions at this level.
Resistance zone at 117899.33:
The dashboard shows:
5m (1 SW)
This means the level 117899.33 was identified by a single swing high on the 5-minute timeframe. The confluence score is 1, and there have been no recent price reactions at this level.
How to use this:
Zones with higher confluence (more methods and timeframes in agreement) and more recent reactions are generally more significant. For example, the resistance at 119257.11 is much stronger than the resistance at 117899.33, and the mixed zone at 118767.97 has shown the most recent price reactions, making it a key area to watch for potential reversals or breakouts.
Tip:
“SW” stands for Swing High/Low, and “VWAP” stands for Volume Weighted Average Price.
The format 15m (2 SW) means two swing points were detected on the 15-minute timeframe.
Best Practices & Recommendations
Use with Other Tools: This indicator is most powerful when combined with your own price action analysis and risk management.
Adjust Settings: Experiment with timeframes, clustering, and methods to suit your trading style and the asset’s volatility.
Watch for High Confluence: Zones with higher confluence and more reactions are generally more significant.
Limitations
No Future Prediction: The indicator does not predict future price movement; it highlights areas where price is statistically more likely to react.
Not a Standalone System: Should be used as part of a broader trading plan.
Historical Data: Reaction counts are based on historical price action and may not always repeat.
Disclaimer
This indicator is a technical analysis tool and does not constitute financial advice or a recommendation to buy or sell any asset. Trading involves risk, and past performance is not indicative of future results. Always use proper risk management and consult a financial advisor if needed.

Trend StrengthTrend Strength Dashboard (11-Point System)
Description:
This indicator is a visually enhanced dashboard that evaluates 11 key technical signals to assess bullish momentum for stocks and ETFs. Each condition is displayed in a easy reading table for quick interpretation and visual appeal.
Signals include:
Higher highs and higher lows
Price above EMA21 and SMA200
SMA50 > SMA200
Positive slope on SMA50 and SMA200
RSI trending upward
Ideal for traders who want a clean, at-a-glance summary of market strength without scanning multiple charts or indicators.

Zone Levels (Final 888)📌 Zone Levels Indicator – Buy & Sell Zones with Alerts
This script plots clearly defined buy and sell zones on the chart, with custom top/bottom price inputs for each zone. Ideal for traders who want to visually track high-probability reversal or entry areas.
✅ Key Features:
🔧 Fully customizable zones via settings
📏 Extends zones 240 bars to the left and 40 bars to the right
🏷️ Auto-labeled zones with proper price formatting (e.g. 3385–3390)
🔔 Built-in alerts when price enters any zone
🎯 Mid-zone line for key reference level
🟢 Buy Zones:
Buy Z1: 3415–3412
Buy Z2: 3405–3402
Buy Z3: 3400–3397
Buy Z4: 3390–3385
🔴 Sell Zones:
Sell Z1: 3430–3431
Sell Z2: 3434–3436
Sell Z3: 3439–3441
Sell Z4: 3445–3450
This indicator helps discretionary traders who rely on clean visual zones and precise price levels to act confidently without clutter.
Feel free to modify zone values in the settings to match your own strategy or market conditions.
Remark: This script created by AI


TrendShift [MOT]📈 TrendShift – Multi-Factor Momentum & Trend Signal Suite
TrendShift is a precision-built momentum and confluence tool designed to highlight directional shifts in price action. It combines EMA slope structure, oscillator confirmation, volume behavior, and dynamic SL/TP logic into one cohesive system. Whether you're trading with the trend or catching reversals, TrendShift provides data-backed clarity and visual confidence — and it’s available free to the public.
🔍 Core Signal Logic
Buy (🟢 Long) and Sell (🔴 Short) signals are triggered when multiple conditions align within a set bar window (default: 5 bars):
Stochastic RSI K/D cross
RSI crosses above 20 (long) or below 80 (short)
Stochastic RSI breaks 20 (long) or 80 (short)
Volume exceeds 20-bar average
🧭 Visual Trend Dashboard – Signal Table
A real-time on-chart dashboard displays:
EMA Trend: Bullish / Bearish / Mixed (based on 4 EMA slopes)
Stoch RSI: Oversold / Overbought / Neutral
RSI: Exact value with zone label
Volume: Above or Below average
Dashboard theme and position are fully customizable.
📐 Trend Structure with EMA Slope Logic
Plots four EMAs (21, 50, 100, 200) color-coded by slope:
Green = Rising
Red = Falling
These feed into the dashboard's EMA Trend display.
🎯 Optional Take Profit / Stop Loss Zones
When enabled, SL/TP lines plot automatically on valid signals:
Fixed-distance targets (e.g., 10pt TP, 5pt SL)
Auto-remove on TP or SL hit
Separate lines for long vs. short trades
Fully customizable styling
🔁 Trailing Stop Filter (Internal Logic)
A custom ATR-based trailing stop helps validate directional strength:
ATR period
HHV window
ATR multiplier
Used internally — not plotted — to confirm trend progression before entry.
⚙️ Customizable Parameters
Every core component is user-configurable:
EMA periods: 21 / 50 / 100 / 200
ATR trailing logic: period, HHV, multiplier
Oscillator settings: Stoch RSI & RSI
Volume length
SL/TP toggles and point values
Bar clustering window
Dashboard theme and location
🔔 Alerts Included
BUY Signal Triggered
SELL Signal Triggered
Compatible with webhook automation or mobile push notifications.
⚠️ Disclaimer
This tool is for educational purposes only and is not financial advice. Trading involves risk — always do your own research and consult a licensed professional before making trading decisions.

Order-Flow Market StructureOrder-Flow Market Structure by The_Forex_Steward
A precision tool for visualizing internal shifts, swing structure, BOS events, Fibonacci levels, and multi-timeframe alerts.
What It Does
The Order-Flow Market Structure indicator intelligently tracks and visualizes price structure using higher timeframe candles. It automatically detects:
• Internal bullish and bearish structure shifts
• Swing highs and lows (HH, HL, LH, LL)
• Break of Structure (BoS) confirmations
• Fibonacci retracement levels from recent swing moves
• Real-time alerts across LTF, MTF, and HTF modes
It’s a complete tool for traders who follow Smart Money Concepts, ICT, or institutional price action strategies.
How It Works
• You select a Higher Timeframe (HTF) to set the structural context
• Internal shifts are identified using HTF candle closes
• The indicator scans for swing highs/lows after each internal shift
• Breaks of previous swing points confirm BoS and plot horizontal lines
• Zigzag lines visually connect structural points (swings and BoS)
• Fibonacci levels are drawn between the latest swings
• Alerts can be configured for structure shifts, BoS events, and fib level breaks
How to Use It
Set your preferred HTF (e.g., 1H while trading on 5-minute)
Enable Fibonacci levels to visualize retracement zones
Watch for:
• Bullish internal shifts → HL to HH
• Bearish internal shifts → LH to LL
• BOS → Breakout confirmation
Enable alerts to catch structural events in real-time
Adjust the "Safe History Offset" if working with long lookbacks or volatile assets
Who It's For
• Traders using Smart Money, ICT, or market structure-based systems
• Scalpers, day traders, and swing traders
• Anyone needing precise structural insight across multiple timeframes
Features
• BoS detection with custom line styles and width
• HH, HL, LH, LL label plotting
• Optional Fibonacci retracement zones
• Custom alerts for swing shifts and fib level breaks
• LTF, MTF, and HTF alert modes
Stay aligned with structure, trade with precision, and get alerted to key shifts in real time.

Trent_Finder V3EMA Inputs
It uses 6 EMAs with customizable lengths (defaults: 30, 35, 40, 45, 50, 60).
Trend Conditions
Bullish Trend: All EMAs are strictly ordered from smallest to largest, meaning short-term prices are leading long-term prices upward.
Bearish Trend: All EMAs are ordered from largest to smallest, meaning short-term prices are falling below long-term ones.
Neutral: EMAs are mixed and do not meet the above criteria.
Trend Tracking
The script remembers the current trend and only flips when a full trend reversal condition is confirmed.
Signals
A Buy Signal appears when a bearish or neutral trend changes to bullish.
A Sell Signal appears when a bullish or neutral trend flips to bearish.
Visual Aids
All 6 EMAs are plotted on the chart.
Green Lines = Bullish trend
Red Lines = Bearish trend
Gray Lines = No trend (neutral)
Buy/Sell markers appear at turning points.

Dual ORB (5 & 15 Min) Retest SignalsThe Dual Orb Indicator allows you to see the orb effortlessly! it also gives you buy/sell signals on both the 5 minute timeframe and the 15 minute timeframe! if you have any questions or suggestions please comment below and let me know what you think!

CerberusFX Greedy SquirrelCerberusFX Greedy Squirrel
Ever wish you could trade with the cunning of a squirrel snatching the best nuts? Meet the CerberusFX Greedy Squirrel, a TradingView indicator that’s equal parts clever and cheeky! Licensed under Mozilla Public License 2.0, this script spots bullish and bearish signals with the finesse of a forest critter, using dual moving averages (MA) to filter out the market’s chaff.
Toggle it to signal on every candle for rapid-fire trades or stick to alternating buy/sell signals for a smoother ride. Choose your MA flavor (EMA or SMA), tweak fast and slow MA lengths, and decide whether to filter signals above/below one or both MAs. It’s like giving a squirrel a GPS to find the juiciest opportunities! Green triangles mark buy signals, red triangles flag sells, and alerts keep you in the loop. Perfect for traders who want precision without losing their sense of humor.

🟡🔵🟢🔴Beginner's Assistant by carljchapman🟡🔵🟢🔴
Overview
This indicator dynamically marks highs and lows of the premarket (4:00am-9:30amEST) and opening range. It displays Fair Value Gaps, 9 and 21 period Exponential Moving Averages (EMA) and the Volume Weighted Average Price (VWAP). To really help beginners, it marks suggested entry points on the chart with green or red triangles, when a reasonable trend appears.
Features
Automatically draws blue lines for Premarket High and Low values
Dynamically marks the opening Range region
Visual entry signals for long and short opportunities
Primarily used for stocks/funds , but works with forex and crypto
Quick configuration settings to tailor details for your experience level
Mobile friendly mode
Supports alerts
How To Use
Open your chart, and select a 1 or 2 minute timeframe.
Watch for green triangles and red triangles, hinting at entries for long or short positions. Pay particular attention to the price action as it approaches the bounds of the opening range and the premarket levels. I suggest also using a MACD indicator for confirmation of the trend.
For scalping 0dte Options, switch frequently between the 1 ,2 and 5 minute or higher timeframes. Do this so you will not miss an entry opportunity or be unaware of the overall trend.
As a beginner, until you have refined your strategy and develop risk management, take profits as low as 10%. A small profit can quickly become a much larger loss. With 0dte options, time will devour your profits even when the price doesn’t budge.
What makes this indicator so beginner friendly?
Charts with too many lines and colors are are a nightmare for beginners! And empty charts do not tell the whole story. Simple checkboxes in the configuration settings let you turn on and off features to match your comfort level. As you become more familiar you might try turning off the suggested entries to see if you would have selected the same or better ones yourself. Just one example of how you will learn and verify your knowledge. You will quickly spot Opening Range Breakouts and more.
Why are the triangle pointers not simply above or below the bars?
As a beginner, I like to review charts to see how much the price changed, then estimate how much a contract would move based on its delta. A mouthful, I know. But what price does an arrow pointing up below a bar reflect? Would I have entered at the open or close, low or high? This indicator helps by putting the marker close to the price when indicated. It can even display the actual price on the bar. This is helpful for you to make fast calculations without a measuring tool.
I am an experienced trader. Can this help me make winning trades?
Sure. It can also help you make losing ones! Profit is not guaranteed with any indicator or strategy. This indicator is designed to assist you as you learn and while you trade. You won't see the words BUY or SELL. This is not a signal bot! It is merely a tool to assist you. You can learn a lot by spending time observing price movement using this indicator without ever making a single trade.
🟡🔵🟢🔴

PSX OBV Divergence Labels (1H/4H/1D/1W, Enhanced)This script identifies and labels bullish and bearish OBV divergences on the price chart, specifically optimized for swing trading in the Pakistan Stock Exchange (PSX) but also works well across global equities, indices, and crypto.
🔍 What It Does
📈 Bullish OBV Divergence (Green “BUY” label):
Price makes a new low while OBV forms a higher low — suggesting accumulation and a potential reversal.
📉 Bearish OBV Divergence (Red “SELL” label):
Price makes a new high while OBV forms a lower high — indicating distribution and potential weakness.
All signals are confirmed on candle close and filtered for smart volume and OBV stability, helping reduce noise and false positives.
⚙️ How It Works
OBV Divergence Lookback: Scans the last N bars (default 20) for divergence patterns
Volume Spike Filter: Bullish divergences are only considered valid if volume exceeds a smoothed average × multiplier
OBV Slope Confirmation: Confirms that OBV is moving in the expected direction across recent bars before signaling
Multi-Timeframe Support: Designed for 1H, 4H, 1D, and 1W timeframes — ideal for position and swing traders
📈 Best Use Cases
✅ PSX stocks (KSE100, KMI30)
✅ Crypto, indices, or commodities where volume data is available
✅ Works best when combined with price action, support/resistance, or market structure
📎 Parameters
OBV Divergence Lookback: Length of historical window to evaluate OBV vs. price divergence
Volume Smoothing: Period for volume moving average
Volume Spike Multiplier: Threshold for volume strength (default = 1.0x)
OBV Stability Confirmation Bars: OBV must show consistent direction across this many bars before confirming divergence
🧠 Pro Tip
Use divergence signals in confluence with:
Fair Value Gaps
Market Structure Breaks (BMS)
HTF Order Blocks or key SR levels
… for much stronger trade setups.

5분 단타 루아 전략//@version=6
indicator("5분 단타 루아 전략", overlay=true)
// === 기본 지표 ===
src = close
ma = ta.ema(src, 20)
bb_upper = ta.sma(src, 20) + 2 * ta.stdev(src, 20)
bb_lower = ta.sma(src, 20) - 2 * ta.stdev(src, 20)
// === 매매 조건 ===
longCondition = ta.crossover(src, ma) and src < bb_upper
shortCondition = ta.crossunder(src, ma) and src > bb_lower
// === 진입가, 손절, 익절 계산 ===
var float entryPrice = na
var string position = ""
if (longCondition)
entryPrice := close
position := "long"
if (shortCondition)
entryPrice := close
position := "short"
takeProfit = position == "long" ? entryPrice * 1.012 : position == "short" ? entryPrice * 0.988 : na
stopLoss = position == "long" ? entryPrice * 0.994 : position == "short" ? entryPrice * 1.006 : na
// === 시각화 ===
plotshape(longCondition, title="롱 진입", location=location.belowbar, color=color.green, style=shape.arrowup, size=size.small)
plotshape(shortCondition, title="숏 진입", location=location.abovebar, color=color.red, style=shape.arrowdown, size=size.small)
plot(takeProfit, title="익절선", color=color.lime, linewidth=1, style=plot.style_linebr)
plot(stopLoss, title="손절선", color=color.red, linewidth=1, style=plot.style_linebr)

Williams FractalsBoaBias Fractals High & Lows is an indicator based on Bill Williams' fractals that helps identify key support and resistance levels on the chart. It displays horizontal lines at fractal highs (red) and lows (green), which extend to the current bar. Lines automatically disappear if the price breaks through them, leaving only the relevant levels. Additionally, the indicator shows the price values of active fractals on the price scale for convenient monitoring.
Key Features:
Customizable Fractals: Choose between 3-bar or 5-bar fractals (default: 3-bar).
Period: Adjust the number of periods for calculation
Visualization: Red lines for highs (resistance), green for lows (support). Lines are fixed on the chart and persist during scrolling or scaling changes.
Alert System: Notifications for the formation of a new fractal high/low and for level breaks (Fractal High Formed, Fractal Low Formed, Fractal High Broken, Fractal Low Broken).
How to Use:
Add the indicator to the chart.
Configure parameters: select the fractal type (3 or 5 bars) and period.
Set up alerts in TradingView to receive notifications about new fractals or breaks.
Use the lines as levels for entry/exit positions, stop-losses, or take-profits in fractal-based strategies.
Troubleshooting: If Levels Are Not Fixed on the Chart
If the levels (fractal lines) do not stay fixed on the chart and fail to move with it during scrolling or scaling (e.g., they remain stationary while the chart shifts), this is typically due to the indicator's scale settings in TradingView. The indicator may be set to "No scale," causing the lines to desynchronize from the chart's price scale.
What to Do:
Locate the Indicator Label: On the chart, find the indicator label in the top-left corner of the pane (or where "BoaBias Fractals High & Lows" is displayed).
Right-Click the Label: Click the right mouse button on this label.
Adjust the Scale:
In the context menu, look for the "Scale" or "Pin to scale" option.
If it shows "Pin to scale (now no scale)" or similar, select "Pin to right scale" (or "Pin to left scale," depending on your chart's main price scale—usually the right).
Refresh the Chart: After changing the setting, refresh the chart (press F5 or reload the page), or toggle the indicator off and on again to apply the changes.
After this, the lines should move and scale with the chart during scrolling (horizontal or vertical) or zooming. If the issue persists, check:
TradingView Limits: The indicator may draw too many lines (maximum ~500 per script). If there are many historical fractals, older lines might not display.
Chart Settings: Ensure the chart is not in logarithmic scale (if applicable) or that auto-scaling is enabled.
Indicator Version: Verify you are using the latest script version (Pine Script v6) and check for errors in the TradingView console.
This indicator is ideal for traders working with Bill Williams' chaos theory or those seeking dynamic support/resistance levels. It is based on standard fractals but with enhancements for convenience: automatic removal of broken levels and integration with the price scale.
Note: The indicator does not provide trading signals on its own — use it in combination with other tools. Test on historical data before real trading.
Code written in Pine Script v6. Original template: Mit Nayi.

Adaptive Trend Cloud + Smart Reversal Zones [@darshakssc]This indicator combines a volatility-adjusted trend cloud with RSI- and volume-based reversal signals to help traders visually spot potential trend continuation or reversal zones.
It’s designed to look clean, colorful, and informative — great for both beginners and experienced traders looking for chart clarity and actionable insights.
🔍 How It Works
🔵 1. Trend Cloud
1. The cloud is created using a 34-period EMA as the base and adjusted with a 14-period ATR multiplier.
2. When price is above the EMA, the cloud turns green (bullish).
3. When price is below the EMA, it turns red (bearish).
4. A neutral gray tone shows when price is inside the cloud, signaling potential indecision.
🔁 2. Smart Reversal Signal Logic
1. Signals appear only when price enters the cloud zone, indicating a potential change in direction.
2. To confirm the reversal, the following conditions must also be met:
3. RSI is below 40 (for bullish reversals) or above 60 (for bearish reversals)
4. A volume spike occurs (1.8× the 20-bar volume average)
5. A cooldown of 10 bars between signals prevents overplotting
🎯 3. TP & SL Labels
1. When a valid buy or sell signal appears:
🎯 TP (Take Profit) is placed at 2× ATR distance
🛑 SL (Stop Loss) is placed at 1× ATR distance
These levels are shown via chart labels for visual reference
🛎️ 4. Alerts
1. Built-in alerts trigger on:
🟢 Buy reversal signals
🔴 Sell reversal signals
✅ How to Use
1. Apply the indicator to any chart (works best on 5min–4h timeframes)
2. Look for the 🟢 Buy / 🔴 Sell labels when price touches the cloud
3. Use the visual TP/SL markers as reference zones — not financial advice
4. Combine with your own risk management, price action or confluence tools
⚙️ Customization Options
1. EMA & ATR lengths and multipliers
2. RSI and volume thresholds
3. Signal cooldown to reduce noise
4. Toggle TP/SL zones on or off
⚠️ Disclaimer
This script is for educational purposes only and does not constitute financial advice. Always test on demo accounts and combine with your own trading system.

RSI Shift Zone [ChartPrime] with MAThis is a modified version of the original *RSI Shift Zone * script.
What’s new?
➤ Added a customizable Moving Average (SMA/EMA) plotted on top of the RSI for better trend confirmation.
➤ Keeps the original RSI zone detection logic and highlights possible reversal or shift areas.
➤ Clean visual style with clear zone fills, labels, and optional RSI value display.
Settings:
- RSI Length and Levels
- Minimum Channel Length
- Display RSI Value Toggle
- Moving Average Length & Type (SMA or EMA)
License: This script is shared under the Mozilla Public License 2.0 and retains © ChartPrime as the original author.
I hope this helps traders get a better visual on trend shifts and confirmations.
Feel free to share feedback or suggestions!

Market Structure🏗️ Market Structure Indicator for TradingView (Pine Script v6)
Overview:
The Market Structure indicator is a robust tool for identifying swing highs and swing lows across multiple structural levels:
🟤 Short-Term Swings
🟠 Intermediate-Term Swings
🟢 Long-Term Swings
It helps traders visually interpret market structure by detecting confirmed pivot points and promoting them through a hierarchical system. This provides a clear picture of trend direction, breakouts, and reversals.
⚙️ Features and Functionality:
✅ Multi-level Swing Detection:
The indicator promotes confirmed swing points from short-term to intermediate and long-term levels using a structured algorithm.
✅ Full Customization:
Toggle visibility of each swing level independently.
Choose custom colors for short, intermediate, and long-term swings.
✅ Transparent and Commented Logic:
The code contains well-structured functions for identifying and confirming swing highs and lows.
Label arrays are used for precise control over swing detection and display.
✅ Detailed and Open Source Code:
Every function is thoroughly explained with inline comments.
Designed to be easy to understand, modify, and extend — perfect for learning or integrating into more advanced systems.
📜 Open and Documented Source Code
The script is entirely open-source, written in Pine Script v6, and includes full documentation inside the code itself. Key sections include:
🔧 Input settings and visual configuration
🧠 Swing detection and confirmation methods
🔁 Promotion logic between structure levels
📈 Real-time label drawing on each bar
Everything is fully accessible and explained — no obfuscation, no hidden logic.
