Smart Money Setup 08 [TradingFinder] Binary Options Gold Scalper🔵 Introduction
In the Smart Money methodology, the market is understood as a structure driven by liquidity flow. This structure forms through the movement of large orders, the accumulation of liquidity, and the reactions that occur around key price zones. The logic of Smart Money is based on the idea that price movement is not random and usually evolves with the intention of collecting liquidity and creating price inefficiencies known as imbalances.
Within this framework, several important stages including the liquidity sweep, the formation of a point of interest, the appearance of an imbalance and the transition of market structure play major roles and collectively define the broader direction of price.
In many bullish scenarios, the market begins by sweeping sell side liquidity and targeting important lows in order to collect the liquidity resting below them. This liquidity collection often becomes the starting point for creating a point of interest which usually marks the area where Smart Money begins to enter the market.
After price moves away from this point, it breaks a structural high and forms a change of character. This shift marks a transition in the balance of power between buyers and sellers and is considered the first clear signal that the market structure is changing.
After the change of character, new institutional order flow often creates a strong and rapid movement that leaves behind an imbalance. This imbalance is one of the most important elements in Smart Money analysis because price tends to return to this area in order to complete structure and restore balance.
The return into the imbalance becomes meaningful when it occurs together with the liquidity sweep, the presence of a validated point of interest and a confirmed structural transition. These conditions frequently mark the beginning of powerful movements within the Smart Money cycle.
Understanding the sequence of liquidity, point of interest, imbalance, change of character and market structure builds the foundation of Smart Money analysis and provides a clear view of the true direction of institutional strength.
Bullish Setup :
Bearish Setup :
🔵 How to Use
To use this framework effectively, the trader must analyze the market through the principles of Smart Money and observe how liquidity drives price. A trade becomes valid only when several essential components appear together in a clear and consistent order.
These components include the liquidity sweep, the formation of a point of interest, the confirmation of a change of character, the transition of market structure and the return of price into an imbalance. The method is built on the understanding that the market first collects liquidity, then shifts order flow and finally provides an entry opportunity inside an inefficient area or inside a point of interest.
For this reason, the trader must follow the path of liquidity from the moment the sweep occurs, through the point of interest and the change of character and finally into the return of price toward the imbalance. When applied correctly, this approach creates entries that are more precise, more structural and more aligned with the real behavior of the market rather than with superficial signals.
🟣 Long Position
A bullish setup in Smart Money structure begins with a liquidity sweep on the sell side. The market first targets the areas where sell side liquidity is located and collects the stops and resting liquidity under previous lows. This collection is the condition that Smart Money requires to begin creating a new order flow. After this liquidity has been taken, a point of interest forms which is usually the last bearish candle or the effective demand zone that initiated the upward movement.
Price then moves away from the point of interest and breaks a structural high which creates a change of character. This event confirms that the market structure has moved from a bearish state to a bullish one and that buying pressure has taken control of the order flow. Following this shift, a strong upward movement often occurs and creates an imbalance between candles. This imbalance reflects the entrance of strong Smart Money orders and is seen as an important confirmation of bullish strength.
When price returns to this imbalance after the displacement, the market enters a phase where Smart Money aims to complete the corrective movement and continue the upward direction. The reaction inside the imbalance when combined with the liquidity sweep, the confirmed point of interest and the change of character completes the bullish setup and forms a structure that often leads to a continuation of the bullish trend.
🟣 Short Position
A bearish setup follows the same Smart Money logic but in the opposite direction. The market begins by collecting buy side liquidity and targets the highs where buy side liquidity and resting stops are located. This liquidity sweep on the buy side becomes the starting phase for Smart Money to initiate a downward order flow. After the liquidity is collected, a bearish point of interest forms which is usually the last bullish candle or the supply zone that created the initial drop.
Price then moves away from this point and breaks the first structural low. This creates a change of character to the downside which confirms that the market structure has transitioned from bullish to bearish and that selling pressure has gained control. After this shift, a strong downward displacement appears and leaves behind a bearish imbalance that clearly shows the dominance of sellers.
As price returns to this imbalance and corrects the inefficient movement, the bearish setup becomes complete as long as the market structure remains bearish. The combination of the buy side liquidity sweep, the bearish point of interest, the change of character, the imbalance and the corrective return creates the ideal structure that Smart Money uses to continue the downward movement and develop a reliable selling opportunity.
🔵 Settings
🟣 Logic Settings
Pivot Period : Defines how many bars are analyzed to identify swing highs and lows. Higher values detect larger, slower structures, while lower values respond to faster patterns. The default value of 5 offers a balanced sensitivity.
🟣 Alert Settings
Alert : Enables alerts for SMS08.
Message Frequency : Determines the frequency of alerts. Options include 'All' (every function call), 'Once Per Bar' (first call within the bar), and 'Once Per Bar Close' (final script execution of the real-time bar). Default is 'Once per Bar'.
Show Alert Time by Time Zone : Configures the time zone for alert messages. Default is 'UTC'.
🔵 Conclusion
The Smart Money approach demonstrates that price movement is not random or based on surface level patterns. Instead, it develops through a clear cycle of liquidity collection, structural transition and corrective movement toward key price zones. By recognizing events such as the liquidity sweep, the formation of the point of interest, the change of character and the return into the imbalance, the trader gains the ability to understand order flow more accurately and identify the true direction of market structure.
Both bullish and bearish setups show that the alignment of these elements creates a transparent view of institutional behavior and reveals the source of strong movements in the market. When the trader correctly identifies this sequence, entry points become more reliable and more aligned with liquidity flow. The combination of liquidity, structure and imbalance provides a consistent framework that removes guesswork and guides decisions through the real logic of the market.
Binaryoption

Binary Options 1 Minute Signals [TradingFinder] 1 Min Strategy🔵 Introduction
At first sight, price movement in binary options appears random, but behind every move lies a clear logic of liquidity and market imbalance. The market is always driven by the hunt for liquidity and the continuous rebalancing that takes place around Fair Value Gaps (FVGs) and Order Blocks (OBs). These zones are where institutional activity is concentrated and where Smart Money creates the most significant reactions.
When price approaches a key liquidity zone, it often performs a Liquidity Sweep to capture orders resting around previous highs or lows. This move usually presents itself as a False Breakout. Price briefly breaks a level to trigger stop losses and collect liquidity, then quickly reverses direction. Understanding this false breakout behavior is essential for identifying high probability reversals in binary options trading.
After the liquidity sweep, price typically retraces into a Fair Value Gap or Order Block, where the market seeks balance and new orders are introduced. This interaction between liquidity, imbalance, and institutional order flow forms the core logic of every Smart Money trading model.
By focusing on Liquidity Sweeps, False Breakouts, and the structure of FVGs and OBs, traders can read the true intention behind price movements. What seems like random volatility becomes a structured cycle of liquidity collection and reaction, offering clear opportunities for precision-based binary entries.
Bullish Setup :
Bearish Setup :
🔵 How to Use
This indicator works within the Smart Money framework and focuses on the connection between Liquidity Sweep, False Breakout, Fair Value Gap (FVG) and Order Block (OB).
It is created to help traders identify the moment when the market finishes collecting liquidity and begins to show signs of reversal.
The indicator studies how price behaves around zones where liquidity is concentrated, such as previous highs and lows or areas with visible inefficiency. When a clear reaction forms and a valid candle pattern confirms the shift in direction, the indicator generates a signal that represents the activity of Smart Money.
This tool does not respond to random volatility or noise. It waits for structure, liquidity and confirmation to align together before providing an entry. As a result, every signal has a logical base related to institutional order flow rather than ordinary price fluctuations. This approach allows traders to focus only on the movements that reflect true liquidity behavior.
🟣 Long Setup
A bullish setup takes place when the market moves downward and reaches a sell-side liquidity zone located below previous swing lows. In this area, price performs a Liquidity Sweep by moving under key levels to trigger stop losses and capture liquidity from trapped sellers.
This movement usually appears as a False Breakout because the market breaks below a level for a short moment and then quickly moves back inside the range.
Around this zone, a bullish Order Block or Fair Value Gap (FVG) often exists, showing where institutional demand is active.
When the indicator detects the presence of liquidity collection together with a valid bullish confirmation candle near an OB or FVG, it creates a Call signal.
This marks the moment when Smart Money is shifting from selling pressure to accumulation, and a strong bullish move often follows. For binary entries, the best opportunity usually comes immediately after the confirmation candle closes.
The reaction tends to happen quickly because the liquidity grab has completed and new institutional buying pressure is entering the market. This type of setup often provides a clean and precise entry with a high probability of success.
🟣 Short Setup
A bearish setup happens when the market rises and enters a buy-side liquidity area above previous highs. Here, the market performs a Liquidity Sweep to trigger stop losses placed above those highs and to absorb liquidity from trapped buyers.
This pattern forms what traders recognize as a False Breakout because the price only breaks the level temporarily before reversing in the opposite direction. A bearish Order Block or Fair Value Gap (FVG) often appears around this zone, showing where institutional selling interest exists.
Once the liquidity sweep completes and a bearish confirmation candle closes, the indicator produces a Put signal that reflects the shift from buying to selling pressure by Smart Money.
This moment often leads to a fast downward reaction as the market rebalances and fills the nearby inefficiency.
The most effective entry for binary trading is right after the confirmation candle closes, when the false breakout and liquidity collection are both completed. The price usually reacts sharply as the market transitions from liquidity hunting to a new directional move. This setup represents a structured view of how liquidity drives market cycles and how Smart Money creates precise reversals through controlled imbalance and reaction.
🔵 Settings
Time Frame : Defines the timeframe used for analysis. If left blank, the indicator automatically uses the chart’s current timeframe.
Swing Period : Determines how many candles are used to identify structural turning points such as swing highs and swing lows. Higher values increase accuracy but reduce the number of signals.
Signal Type : Specifies the type of signal generated by the indicator. The option All shows every signal, Main Signal displays only the primary one, and Alternative Signal produces a secondary signal that appears one candle after the main signal for additional confirmation.
Candle Pattern : Enables candle pattern logic for reversal confirmation. When active, the indicator issues a signal only when a valid candle formation confirms the market reaction.
Candle LookBack Check : Verifies that the last few candles move in the opposite direction of the signal to be generated. This condition acts as a confirmation filter, ensuring that the signal appears only after a clear counter-move in price.
Last Candle Direction : Considers the direction of the most recent candle in the analysis. It helps determine whether the final candle moves with or against the current trend.
Last Candle Shadow Ratio : Sets the ratio between the last candle’s wick and body to refine confirmation accuracy. Higher values require longer wicks, indicating stronger rejection and a more reliable reversal pattern.
🔵 Conclusion
Trading with Smart Money logic means understanding how liquidity moves through the market.
Each Liquidity Sweep, False Breakout, Fair Value Gap (FVG) and Order Block (OB) reflects the process of collecting and redistributing orders.
This indicator captures that sequence and turns it into precise, structured signals for binary entries. When liquidity is absorbed and a candle confirmation appears, the market reveals its true direction.
At that moment, traders can act with confidence, following institutional flow instead of reacting to random price moves.
Success with this system comes from patience, confirmation, and a clear reading of liquidity behavior, the core principles behind every Smart Money reversal.

Binary Options Gold Scalping [TradingFinder] 1 & 5 Min Strategy🔵 Introduction
In binary options trading, price movements are often driven by the market’s tendency to reach key liquidity zones. These areas include Liquidity, Fair Value Gaps (FVGs), and Order Blocks (OBs), zones where a large number of pending orders are concentrated.
When price reaches one of these zones, it typically enters a Liquidity Sweep phase to collect available liquidity. After this process, the market often reacts sharply, either reversing direction or continuing its move with renewed momentum. Understanding this cycle forms the foundation of most smart money-based binary options strategies.
In this analytical approach, a Liquidity Sweep is usually seen as a False Breakout, often recognized through a distinctive candle confirmation pattern. The pattern appears when price briefly breaks a level to trigger stops, then quickly returns within range. This formation is one of the most reliable reversal signals for short-term trades and plays a central role in many binary options strategies.
After a liquidity sweep, price often returns to Fair Value Gap (FVG) or Order Block (OB) areas to restore balance in the market. These are zones where institutional orders are typically placed, and reactions around them can create high-probability trade setups. In binary options trading, this quick reaction following a sweep and retrace into an FVG or OB provides one of the best entry opportunities for short-term trades.
By combining the concepts of Liquidity Sweep, Fair Value Gap, and Order Block, traders can build a precise binary options strategy based on smart money behavior, allowing them to identify market reversals with greater confidence and enter at the optimal moment.
Bullish Setup :
Bearish Setup :
🔵 How to Use
This indicator is built on the Smart Money Concept (SMC) framework and serves as a core tool for accurately detecting Liquidity Sweeps, Order Blocks, and Fair Value Gaps in binary options trading.
Its logic is simple yet powerful : when price reaches high-interest liquidity zones and shows reversal signs, the indicator issues an entry signal immediately after a Candle Confirmation is complete.
Signals only activate when both the market structure and the candle confirmation pattern align, ensuring high accuracy in spotting genuine reversals.
🟣 Long Position
A bullish signal appears when the market, after a downward move, reaches sell-side liquidity zones where liquidity has built up below previous lows. In such conditions, a bullish Order Block or Fair Value Gap often exists in the same region, acting as a potential reversal point.
When the indicator detects the presence of liquidity, an imbalance zone (FVG), and a valid candle confirmation simultaneously, it triggers a green Call signal.
In a binary options strategy, the best entry moment is immediately after the candle confirmation closes, as this is when the probability of reversal is highest and the market tends to react strongly within the next few candles.
In the example below, after the liquidity sweep and candle confirmation, price quickly rallied, resulting in a Binary Win setup.
🟣 Short Position
A bearish signal occurs when price, after an upward move, reaches an area of buy-side liquidity and collects liquidity above recent highs. At this stage, the market is typically overbought and ready to reverse. If a bearish Order Block or Fair Value Gap exists in the same area and a candle confirmation pattern forms, the indicator displays a red Put signal.
This setup is highly accurate because multiple structural confirmations occur simultaneously : liquidity has been absorbed, price is rebalancing, and the confirmation candle has closed.
In binary options trading, this is the ideal moment to enter a Put (Sell) position, as the price reaction to the downside is usually quick and decisive.
In the example chart, the indicator generated a bearish signal right after the candle confirmation and completion of the liquidity sweep, price then dropped within minutes, resulting in another Binary Win.
🔵 Settings
Time Frame : Select the desired timeframe for analysis. If left blank, the indicator uses the chart’s current timeframe.
Swing Period : Defines how many candles are used to detect structural pivots (swing highs and lows). A higher value increases accuracy but reduces the number of signals.
Candle Pattern : Enables candle-based confirmation logic. When turned on, the indicator issues signals only if a valid reversal pattern is detected. You can also choose the confirmation filter strength, tighter filters show fewer but more precise signals.
🔵 Conclusion
A deep understanding of Liquidity Sweeps, Order Blocks, and Fair Value Gaps can make a decisive difference between ordinary and professional traders in the binary options market.
This indicator, combining smart money logic with candle confirmation, is one of the most precise tools for detecting true market reversals. When liquidity is collected and structural reversal signs emerge, the indicator automatically recognizes the price reaction and generates a reliable Call or Put signal.
Using this tool alongside market structure analysis and FVG detection allows traders to enter high-probability setups while filtering out false breakouts. For that reason, this binary options strategy is not only suitable for short-term trading but also valuable for understanding deeper smart-money behavior across timeframes.
Ultimately, success with this system comes down to two key principles: understanding the logic of the liquidity sweep and waiting for the candle confirmation to close. When these two conditions align, the indicator can pinpoint the best entry points with remarkable precision, helping you build a structured, intelligent, and profitable binary options strategy.

Binary Options Fast Scalping [TradingFinder] M1 & M5 Signals🔵 Introduction
In the structure of financial markets, spiky moments and sudden price movements play a key role in Liquidity Grabs and Market Structure Resets. These movements usually occur after the accumulation of orders in Buy Side or Sell Side Liquidity zones and are accompanied by rapid breaks in the form of Break of Structure (BoS) or Change of Character (CHoCH).
At this stage, the market temporarily moves in the direction of liquidity to trigger counter orders and then enters a Retracement or Pullback phase, a point where professional traders using the Smart Money Concept (SMC) look for candle confirmation to enter with precision.
This strategy is built upon the same logic : an initial spiky move as a signal of institutional or liquidity driven algorithms, followed by a controlled pullback toward areas such as the Order Block, Fair Value Gap (FVG), or Imbalance Zone, and finally an entry based on a strong confirmation candle (Engulf, Rejection, Breaker) that defines the true direction of order flow.
This combination of price behavior, especially on lower timeframes such as M1 or M5, provides an ideal setup for fast Scalping, Micro Structure Trading, and even short term directional prediction in Binary Options Trading.
Since the main focus of this method is on identifying liquidity phases, structural confirmations, and momentum confirmation candles, the trader can design entries with high probability and logical stop loss placement using the concepts of Fractal Market Structure and Multi Timeframe Confirmation.
In the scalping version, the main objective is to capture the move toward the next liquidity pool or opposite demand and supply zone, while in the binary version, only the prediction of the next candle’s direction matters. This strategy inherently operates based on Smart Money Behavior, Liquidity Engineering, and Order Flow Dynamics, allowing the extraction of fast and profitable moves from the internal logic of market structure.
🔵 How to Use
The operational logic of this strategy is based on Liquidity Sweep, Pullback, and Confirmation Candle. The trader should first identify the initial Impulse Move, which is often accompanied by liquidity absorption around Buy Side or Sell Side Liquidity areas. After that, the market enters the Retracement phase and returns to structural zones such as the Order Block or the Fair Value Gap (FVG).
At this point, a position is taken only when a confirmation candle (Engulf, Breaker, or Rejection Candle) closes in the direction of continuation and aligns with the new structure (BOS or CHoCH). Applying this model on lower timeframes offers the highest precision for fast Scalping or for predicting the next candle’s direction in Binary Option trading.
🟣 Bullish Setup
In the bullish setup, the market first forms a spiky upward move with a sudden increase in momentum, indicating the activation of liquidity flow in the Buy Side Liquidity zone. This movement is usually accompanied by a Break of Structure (BOS) to the upside and marks the beginning of the Impulse Move phase. After this move, the price enters the Pullback phase and returns to structural areas such as the Bullish Order Block, Fair Value Gap (FVG), or Mitigation zone.
At this stage, the trader waits for a bullish confirmation candle (Bullish Engulf or Breaker Candle) to validate the end of the retracement. Entry is made at the close of the confirmation candle or on a minor pullback, with the stop loss placed below the Swing Low or below the pullback zone. The target is set at the next Buy Side Liquidity or Equal Highs. In the binary version, only the direction of the next candle matters and the entry takes place immediately after the confirmation candle.
🟣 Bearish Setup
In the bearish setup, the market first forms a spiky downward move, signaling increased selling pressure and liquidity absorption at the Sell Side Liquidity zone. This movement is accompanied by a Break of Structure (BOS) to the downside and represents the beginning of a bearish momentum phase. After the spike, the price enters the Retracement phase and returns to the Bearish Order Block or bearish Fair Value Gap zone. Within these areas, the formation of a bearish confirmation candle (Bearish Engulf, Breaker, or Rejection Candle) validates the continuation of the downtrend.
The entry is taken at the close of the confirmation candle, with the stop loss placed above the Swing High or above the pullback zone, and the target set toward the next Sell Side Liquidity or Equal Lows. In binary applications, only the direction of the next candle is considered and the confirmation candle serves as the entry trigger.
🔵 Conclusion
This strategy, by combining the principles of the Smart Money Concept, Liquidity Dynamics, and Candle Confirmation Logic, offers a precise and multi functional approach to market entry. Its core structure, identifying the initial spiky movement, waiting for a structural pullback, and entering based on a confirmation candle allows quick interpretation of institutional liquidity behavior and provides trading opportunities with high accuracy and controlled risk.
On lower timeframes, this logic becomes a powerful tool for Scalping and Micro Structure Trading, while in binary markets it delivers high success rates due to its focus on predicting the next candle’s direction. Built upon the foundations of Order Flow, Market Structure, and Fractal Liquidity Behavior, this strategy demonstrates that even in the fastest and noisiest market conditions, the order of Smart Money remains observable and exploitable.

Ivan Gomes StrategyIG Signals+ - Ivan Gomes Strategy
This script is designed for scalping and binary options trading, generating buy and sell signals at the beginning of each candle. Although it is mainly optimized for short-term operations, it can also be used for medium and long-term strategies with appropriate adjustments.
How It Works
• The indicator provides buy or sell signals at the start of the candle, based on a statistical probability of candle patterns, depending on the timeframe.
• It is essential to enter the trade immediately after the signal appears and exit at the end of the same candle.
• If the first operation results in a loss (Loss), the script will send another trade signal at the start of the next candle. However, if the first trade results in a win (Gain), no new signal will be generated.
• The signals follow cycles of 3 candles, regardless of the timeframe. However, if a Doji candle appears, the cycle is interrupted, and no signals will be generated until the next valid cycle starts.
• The strategy consists of up to two trades per cycle: if the first trade is not successful, the second trade serves as an additional attempt to recover.
Key Points to Consider
1. Avoid trading in sideways markets – If price levels do not fluctuate significantly, the accuracy of the signals may decrease.
2. Trade in the direction of the trend – Using Ichimoku clouds or other trend indicators can help confirm trend direction and improve signal reliability. If the market is in an uptrend (bullish trend) and the indicator generates a sell signal, the most prudent decision would be to wait for a buy signal that aligns with the main trend. The same applies to downtrends, where buy signals may be riskier.
These decisions should be based on chart reading and supported by other technical analysis tools, such as support and resistance levels, which indicate zones where price might face obstacles or reverse direction. Additionally, Fibonacci retracement levels can help identify possible pullback points within a trend. Moving averages are also useful for visualizing the general market direction and confirming whether an indicator signal aligns with the overall price structure. Combining these tools can increase trade accuracy and prevent unnecessary trades against the main trend, reducing risks.
3. Works based on probability statistics – The algorithm analyzes candle formations and their statistical probabilities depending on the timeframe to optimize trade entries.
4. Best suited for scalping and binary options – This strategy performs best in 1-minute and 5-minute timeframes, allowing for multiple trades throughout the day.
Technical Details
• The script detects the candle cycle and assigns an index to each candle to identify patterns and possible reversals.
• It recognizes reference candles, stores their colors, and compares them with subsequent candles to determine if a signal should be triggered.
• Doji candle rules are implemented to avoid false signals in indecisive market conditions. When a Doji appears, the script does not generate signals for that cycle.
• The indicator displays visual alerts and notifications, ensuring fast execution of trades.
Disclaimer
The IG Signals+ indicator was created to assist traders who struggle to analyze the market by providing objective trade signals. However, no strategy is foolproof, and this script does not guarantee profits.
Trading involves significant financial risk, and users should test it in a demo account before trading with real money. Proper risk management is crucial for long-term success.

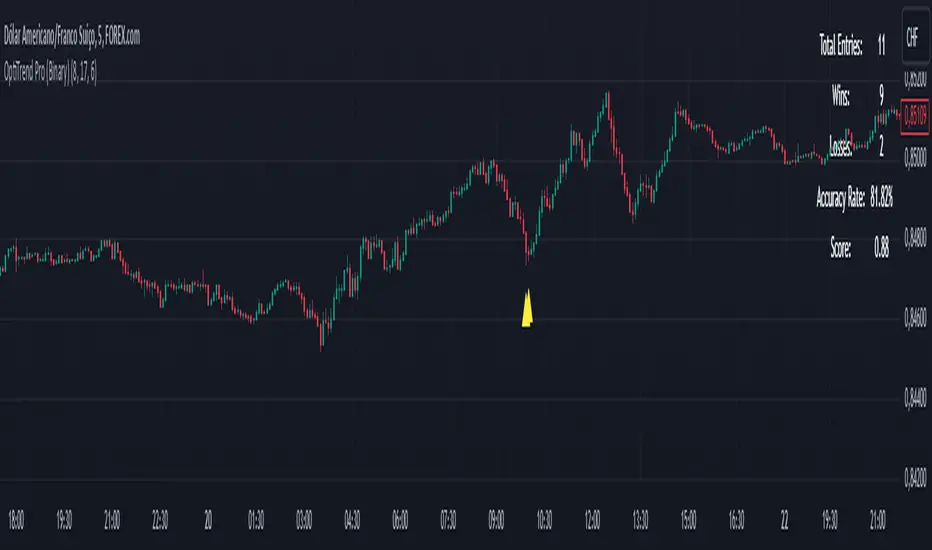
OptiTrend Pro (Binary)
OptiTrend Pro for Binary Options
The OptiTrend Pro indicator is specifically crafted for binary options trading, providing timely, accurate buy and sell alerts with clear arrow signals. This advanced tool combines multiple indicators, offering a comprehensive analysis of trends, volatility, momentum, and key levels, which help traders make well-informed decisions in digital asset markets.
Key Features:
Scoring System: OptiTrend Pro uses a scoring system based on the accuracy and frequency of signals, giving you an objective way to assess the quality of signals. This composite score considers both the hit rate and the number of entries, allowing you to focus on higher-quality setups. Alerts are only sent if the signal score is above 0.5, ensuring notifications are limited to strong signals.
Custom Time Filter: Designed to focus your trading to specific hours, the time filter aligns with the America/Sao_Paulo time zone. For optimal results, we recommend setting the time filter from 8 AM to 5 PM, especially when trading major Forex pairs like EURUSD, GBPUSD, USDJPY, AUDUSD, and USDCAD.
Result Tracking & Win/Loss Counts: Easily monitor win/loss ratios based on a set number of candlesticks (user-defined), which aids in assessing strategy success.
Flexible Alert System: Receive alerts for bullish and bearish signals with arrow markers, ensuring clarity for entries. Additionally, users can set a minimum score to trigger alerts, focusing only on high-quality signals.
How to Use:
Adjust the Parameters: Customize each indicator, time filter, and win/loss tracking period based on your binary trading needs.
Follow the Arrows: Look for bullish signals (up arrows) for buy opportunities and bearish signals (down arrows) for sell opportunities.
Monitor Performance: Leverage the win/loss tracking system and composite score to assess the effectiveness of the signals and optimize your setup.
Set Alerts: Enable alerts to stay informed of new signals as they happen, with filtering options based on your confidence level. Remember, alerts are triggered only if the signal score exceeds 0.5, ensuring that only strong opportunities prompt a notification.
Interpreting the Signals:
Bullish Signal (Up Arrow): Indicates a potential opportunity to enter a buy position as price may rise.
Bearish Signal (Down Arrow): Signals a potential sell position as price may decline.
Usage Tips:
Use OptiTrend Pro alongside other analysis tools for confirmation and additional context.
Adjust the indicator settings to suit the specific asset and timeframe you’re working with.
Apply the results simulation to refine your strategy and manage risk effectively.
This indicator is ideal for binary options on 5-minute and 15-minute charts, designed for entries of 20 and 90 minutes, respectively. For best performance, trade during the 8 AM to 5 PM window on major Forex pairs.
Disclaimer: OptiTrend Pro is a support tool for making trading decisions. It does not guarantee profits and should not be your sole basis for trading. Perform your own analysis and trade responsibly.
Try OptiTrend Pro now to refine your strategies with precise alerts and complete market insights!
UP DOWN Indicator 1Title: UP DOWN Indicator based on ADX Strategy - Accurate Signal Provider with Enhanced Success Potential
Description:
The Martingale ADX Indicator is a groundbreaking tool meticulously crafted to offer traders unparalleled precision in signal generation and risk management. Leveraging the power of the Average Directional Index (ADX), this indicator provides 100% non-repaint signals on the current candle, guiding traders to opportune and prepare for trade entry with remarkable accuracy.
With a focus on empowering traders across various financial markets, including Forex and Binary Options, this ADX Strategy-1 Indicator introduces a unique approach to trading dynamics. By seamlessly integrating the renowned Martingale Step-1 risk management strategy, this indicator not only minimizes losses but also enhances the potential for success, even in volatile market conditions.
Key Features:
Non-Repaint Signals: The Martingale ADX Indicator stands as a testament to reliability, offering 100% non-repaint signals. Traders can trust in the consistency and not removing losing Signals which is very important to trust the previous generated signals also, eliminating uncertainties and facilitating confident decision-making.
ADX-Based Precision: Built upon the robust framework of the Average Directional Index (ADX), this indicator delivers precise signals tailored to prevailing market trends and volatility levels. Whether trading in longer timeframes or engaging in Binary Options, traders can rely on the Martingale Step-1 ADX Indicator for superior insights.
Next Candle Trading: Seamlessly integrated into trading strategies, signals from the Martingale ADX Indicator prompt action on the subsequent candle. This real-time approach ensures traders stay ahead of market movements, seizing opportunities as they emerge. Giving Signals Once Candle ahead makes traders to prepare early and decide whether they want to enter the trade on presented Signal or not as per their own experience too. If the trading candle is loss then the very next candle shall be used for taking Martingale Sep-1 to enhance the Accuracy.
Enhanced Success Potential: With Martingale Step-1 risk management, this ADX Indicator offers more than just signal accuracy – it presents the potential for heightened success rates. Through strategic position sizing and leveraging experience and Price Action insights, traders can elevate overall accuracy to levels ranging from 80% to 90%.
Conclusion:
The UP DOWN Strategy-1 Indicator represents a paradigm shift in trading technology, combining precision signal generation with advanced risk management strategies. Whether you're a seasoned trader or just starting your journey, this indicator empowers you to navigate financial markets with confidence and achieve consistent results.
Experience the difference with the Martingale ADX Indicator – where reliability meets profitability, and success becomes attainable with every trade.
Trade wisely, and may your ventures be marked by prosperity and fulfillment.
Pardon for any descriptive language grammatical error and comment about this indicator and to get my other strategy as well. Happy trading !!
Risk Disclaimer:
Trading in financial markets carries inherent risks and should be approached with caution. It is imperative to exercise sound judgment and trade only with funds that you can afford to lose. We strongly advise against using borrowed funds for trading purposes. First practice on demo for own learning then make decision wisely.

Binary Option Ultimate Backtester-V.1[tanayroy]The Binary Option strategy backtester gives the user extensive power to test any kind of strategy with advance trade management rules.
The strategy tester accepts external scripts as strategy sources. You can add your strategy and test it for historical stats.
Few assumption regarding strategy tester:
We are opening position at next candle after signal come
We are taking the position at opening price
Our call will be profitable if we get a green candle and put will be profitable if we get a red candle
We can open only one trade at a time. So if we are in trade, subsequent signals will be ignored.
How to make your strategy code compatible for strategy backtesting?
In your strategy code file add following lines:
Signal = is_call ? 1 : is_put ? -1 : 0
plot(Signal, title="🔌Connector🔌", display = display.none)
Is_call and is_put is your buy and sell signal. Plot the signal without displaying it in the chart. The new TradingView feature display = display.none, will not display the plot.
All Input options
Group: STRATEGY
Add Your Binary Strategy: External strategy to back test.
Trade Call/Put: Select CALL, to trade Call, PUT, to trade Put. Default is BOTH, Trading Call and Put both.
Number of Candles to Hold: How many candles to hold per trade. Default 1. If you want to hold the option for 30 minutes and you are testing your strategy in 15m intervals, use 2 candle holding periods.
GROUP: MARTINGALE
Martingale Level: Select up to 15 Martingale. Select 1 for no Martingale.
Use Martingale At Strategy Level: Instead of using Martingale per trade basis, using Martingale per signal basis. Like if we make a loss in the first signal, instead of starting martingale immediately we’ll wait for the next signal to put the martingale amount. For example if you start with $1 and you lose, at the next signal you will invest $2 to recover your losses.
Strategy Martingale Level: Select up to 15 Martingale at strategy signal level. Only workable if Use Martingale At Strategy Level is selected.
Type of Trade: Martingale trade type. Only workable if we are using Martingale Level more than 1.
It can be:
“SAME”: If you are trading CALL and incur a loss, you are taking CALL in subsequent Martingale levels.
“OPSITE”: if you are trading CALL and incur a loss, you are taking PUT in subsequent Martingale levels.
“FOLLOW CANDLE COLOR”: You are following candle color in Martingale levels, i.e if the loss candle is RED, you are taking PUT in subsequent candles.
“OPPOSITE CANDLE COLOR”: You are taking opposite candle color trade, i.e if the loss candle is RED, you are taking CALL in subsequent candle.
GROUP: TRADE MANAGEMENT
Initial Investment Per Option: Initial investment amount per trade
Payout: Per trade payout in percentage
Use Specific Session: Select to test trade on specific session.
Trading Session: Select trading session. Only workable if Use Specific Session is selected.
Use Date Range: Select to use test trades between dates.
Start Time: Select Start Time. Only workable if Use Date Range is selected.
End Time: Select end Time. Only workable if Use Date Range is selected.
Early Quit: Select to quit trade for the day after consecutive win or loss
Quit Trading after Consecutive Win: Number of consecutive wins. Only workable if early Early Quit is selected.
Quit Trading after Consecutive Loss: Number of consecutive losses. Only workable if early Early Quit is selected.
Buy/Sell Flip: Use buy signal for sell and sell signal for buy.
GROUP:STATS
Show Recent Stats: Show win trades in last 3,5,10,15,25 and 30 trades.
Show Daily Stats: Day wise win trades and total trades.
Show Monthly Stats: Month wise win trades and total trades.
Result and stat output:
Back tester without any strategy.
Strategy added with default option.
Stats with 7 Martingales. You can test up to 15.
Optional Stats:
Example Strategy code used :
//@version=5
indicator("Binary Option Strategy",overlay = true)
length = input.int(7, minval=1)
src = input(close, title="Source")
mult = input.float(3.0, minval=0.001, maxval=50, title="StdDev")
basis = ta.sma(src, length)
dev = mult * ta.stdev(src, length)
upper = basis + dev
lower = basis - dev
fab_candle_upcross=(high< upper and low>basis)
fab_candle_downcross= (high< basis and low>lower)
up_cross=ta.barssince(ta.crossover(close,basis))
down_cross=ta.barssince(ta.crossunder(close,basis))
is_first_up=false
is_first_down=false
if fab_candle_upcross
for a=1 to up_cross
if fab_candle_upcross
is_first_up:=false
break
else
is_first_up:=true
if fab_candle_downcross
for a=1 to down_cross
if fab_candle_downcross
is_first_down:=false
break
else
is_first_down:=true
//strategy for buying call
is_call=(is_first_up or is_first_down ) and close>open
//strategy for selling call
is_put=(is_first_up or is_first_down ) and close

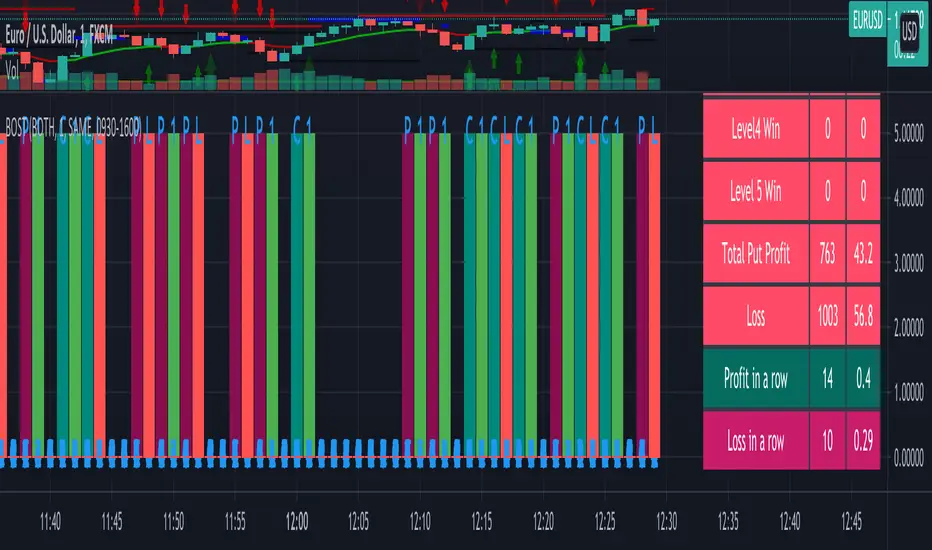
Binary Option Strategy Tester with Martingale-Basic V.2In Binary options, strategy testing is a bit different. The strategy result depends upon expiry intervals and payout ratio.
My previous script was a try to resolve this but has some bugs in specific choices. The new version overcame those and added some new features useful for binary option strategy testing.
Assumption:
We are opening position at next candle after signal come
Chart interval is option expiry time.
We are taking the position at opening price
Our call will be profitable if we get a green candle and put will be profitable if we get a red candle
We can open only one trade at a time. So if we are in trade, subsequent signals will be ignored.
All Input Options:
Test Call/Put individually or both. Default BOTH
Select up to 5 Martingale levels. Default 2
Type of Martingale Trade. Default “SAME”
“SAME”: If you are trading CALL and incur a loss, you are taking CALL in subsequent Martingale levels.
“OPSITE”: if you are trading CALL and incur a loss, you are taking PUT in subsequent Martingale levels.
“FOLLOW CANDLE COLOR”: You are following candle color in Martingale levels, i.e if the loss candle is RED, you are taking PUT in subsequent candles.
“OPPOSITE CANDLE COLOR”: You are taking opposite candle color trade, i.e if the loss candle is RED, you are taking CALL in subsequent candle.
Select Specific Trading Session. Please select “USE SPECIFIC SESSION”. Default: TRUE
Put the investment amount per option. Default: 10
Payout ratio. Default: 80%
The strategy is taken from Vdub Binary Options SniperVX v1 (by @vdubus). I have deleted extra parts and kept only the necessary parts.
Result Table
Signal and Win Levels:
Signal and Loss:
Please note that Binary options trading is very risky. You must be aware of the risk and be willing to accept them in order to invest in binary options. Only invest what you can afford to lose. The past performance of any trading system, strategy, or methodology is not necessarily indicative of future results.

MAGISTR Binary 3 EURUSD 1min The indicator is designed for use in binary options trading.
Designed for TF 1 minute, EURUSD pair (tested on Currency.com exchange instrument).
When the rules of the internal algorithm are triggered, the indicator generates a signal with the probable movement of the instrument on the next bar:
if a green bar appears at the bottom of the bar, it means that the indicator assumes that the next bar should close at a positive price growth value (it will be green) and vice versa, if a red bar appears at the bottom of the bar, then the indicator assumes that the next bar should close at a negative price growth value( will be red), the indicator also generates appropriate alerts about the expected price movement on the next bar.
In addition, the indicator counts the signals issued by it and the success of its processing for the period of time available in TradingView.
This indicator uses a set of values of such basic indicators as:
- Stochastic RSI;
- Bollinger Bands;
- Profile of Volumes;
- CCI;
- ADX;
- momentum;
and others.
I left all the settings "open", so it is quite possible, by slightly changing the parameters, to adjust it to another pair or time frame.
==========================================================================================================================
Индикатор разработан для применения в торговле на бинарных опционах.
Разработан для ТФ 1 минута, пара EURUSD (оттестирован на показателях инструмента биржи Currency.com).
При сработке правил внутреннего алгоритма - индикатор выдает сигнал с вероятным движением инструмента на следующем баре :
если появилась зеленая полоса внизу бара - значит индикатор предполагает, что следующий бар должен закрыться в положительном значении роста цены ( будет зеленым) и наоборот, если появилась красная полоса внизу бара - значит индикатор предполагает, что следующий бар должен закрыться в отрицательном значении роста цены( будет красным) , также индикатор выдает соответствующее оповещения о предполагаемом им движении цены на следующем баре.
Кроме того индикатором ведется подсчета выданных им сигналов и и успеха его отработки за доступный в TradingView период времени.
В данном индикаторе используются комплекс значений таких базовых индикаторов, как:
- Stochastic RSI;
- Bollindgers Bands;
- Profile of Volumes;
- CCI ;
- ADX;
- Momentum ;
и прочие.
Все настройки оставил "открытыми", так что его вполне можно, немного изменив параметры, подстроить под другую пару или тайм-фрейм.

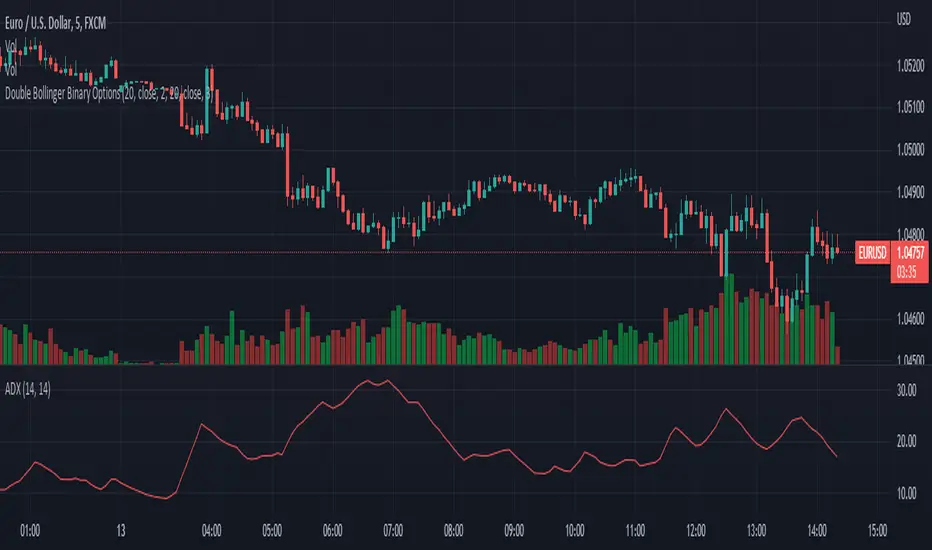
Double Bollinger Binary OptionsThis script uses 2 Bollinger bands and rsi oversold and overbought region to give signals. Basically, it detects those conditions where the market gets spiked in one direction aggressively(mostly during news) and then reverses back, although signals occur less frequently, this strategy is worth trying. Keep the timeframe for 5 minutes and trade for 5 candles i.e. 25 minutes :)
The GM Slip Signals - VIP Revactory - Public SignalsThe GM Slip Signals,
The GM Slip is a signal that uses the strategy based on Candlestick Formation.
This is the pattern formula of GM Slip signals :
1. BASIC SLIP STRATEGY,
- Bullish Basic Slip Pattern : ((BULLISH CANDLE) - (BULLISH CANDLE) - (BEARISH CANDLE) - (BULLISH CANDLE)) = BUY
- Bearish Basic Slip Pattern : ((BEARISH CANDLE) - (BEARISH CANDLE) - (BULLISH CANDLE) - (BEARISH CANDLE)) = SELL
2. COMBINATION SLIP STRATEGY,
- Bullish Combination Slip Pattern : ((BULLISH CANDLE) - (BULLISH CANDLE) - (BEARISH CANDLE) - (BULLISH OUTSIDEBAR CLOSE > UPPER BOLLINGER BANDS )) = BUY
- Bearish Combination Slip Pattern : ((BEARISH CANDLE) - (BEARISH CANDLE) - (BULLISH CANDLE) - (BEARISH OUTSIDEBAR CLOSE < LOWER BOLLINGER BANDS )) = SELL
// ----------- Add-ons Setting ----------- //
Setting for Basic Slip Strategy for Signals :
// ----------- Add-ons Setting ----------- //
Setting for Combination Slip Strategy for Signals :
--------
Recommendations Formula Entry for Binary Options,
// Formula : Timeframe X 1 = Expiration Entry
Ex,
Timeframe : M1 X 1 = 1 Minute
Timeframe : M5 X 1 = 5 Minute
Timeframe : M15 X 1 = 15 Minute
Etc.
--------
Signal Instructions,
1. Diamond BUY / SELL Arrow : PREPARATION SIGNAL
2. Highlight Line Arrow : OPEN POSITION SIGNAL
3. If lose, automatically will be appear "Highlight Line Arrow" on next bar for open position level 1 martingale
--------
Regards Profit Digdaya,
- VIP Revactory Indonesia
--------
DISCLAIMER: No sharing, copying, reselling, modifying, or any other forms of use are authorized for our documents, script / strategy, and the information published with them. This informational planning script / strategy is strictly for individual use and educational purposes only. This is not financial or investment advice. Investments are always made at your own risk and are based on your personal judgement. I am not responsible for any losses you may incur. Please invest wisely.*

Binary Option Strategy Tester with MartingaleIn Binary options, strategy testing is a bit different. The script is just a try to test Binary options strategies.
Assumption:
We are opening position at next candle after signal come
We are taking the position at opening price
Our call will be profitable if we get a green candle and put will be profitable if we get a red candle
We can open only one trade at a time. So if we are in trade, subsequent signals will be ignored.
The script is not counting your profit or loss, it just counting the winning and losing trades.
Input Options:
Choose long only or short only test. Default is both.
You can continue your trade with Martingale Level, up to 5. Default is 1 (no Martingale)
You can choose Martingale trade type
SAME: if call subsequent trade will be call only and vice versa
OPPOSITE: if call subsequent trade will be put
FOLLOW CANDLE COLOR: Subsequent trade will follow previous candle color
OPPOSITE CANDLE COLOR: Subsequent trade will opposite of previous candle color
You can choose trading session to test. Default is false.
The strategy is taken from Vdub Binary Options SniperVX v1 (by @vdubus) . I have deleted extra parts and kept only the necessary part.
Without Martingale
Result Table
With Martingale
I am very new to Pine script, so waiting for your comments and review.
Consecutive Color Reversal for Binary Option TradingThis indicator is only for Binary Option trading. It alerts when a specific number of consecutive same color candlesticks are generated and it signals for a reversal. As an example, when it signals "Long", a long trade should be opened for a few of next candlesticks (upto 2 to 3 candles).

KayeDinero Ranger HFX NFXThis script combines my favorite indicators with an added flare.
The mindset for this strategy is a ranging market, where price is moving in a consistent wave like pattern.
The most unique concept of this script is the candlestick indications. This is different from other scripts on the platform because of the close tie in with the relative strength index as well as the on balance volume.
Best Traded during Hours 3am to 12am EST (NY Time).
This method works best in volatile markets.
Time Frame, 1,3,5,15,30min
Currency Pairs: All Major, Exotic,
Here's The Strategy:
Uptrend and Buy: When those are present, proceed to take a buy (call) option.
Downtrend and Sell: When those are present, proceed to take a sell (put) option.
Keep in mind, timeframe will depend on your time of trading in the markets.
Morning typically 2-4min
Afternoon / Evening: 3-5min
Hint:
Best Trades on reversals at top and bottom of Bollinger bands.
binary angelMeasure angles of many indicators and create score base on this information, it can be use as helper for direction decision in binary option or classic trading

QQE-CCI Hello guys;
This indicator is a simple combination of two oscillators "Quantitative Qualitative Estimation Signals"(based on RSI) and "Commodity Channel Index".
To summarize, the method of signaling from this indicator is that by observing the "Long" signal and CCI cross with the midline upwards simultaneously, we open the buy position; and if we see the "Short" signal and CCI cross with the midline down at the same time, we open a sell position.
I have designed this indicator for use in Binary options; 70% of the trades I have made based on this indicator signals have been successful.
I put my telegram ID here incase if U need, txt me :)
@QQECCi

Catalogador Binarias Padron MHI DejaVuTradesQuadrant patterns with 1 minute cataloging.
This script simulates the quadrants between candles from minute 1 to 5.
set your time frame to 1M.
Ready, now we have our quadrants and we will do the analysis of these patterns using them.
Green circles indicate winning trades, and blue circles Martingale steps.
Counting candles within the quadrants (time frame m1 )
MHI
There are several variants of MHI . In our cataloguer we offer 3 variants. MHI 1, 2 and 3.
The analysis is carried out from the last three candles in the last quadrant. And the entry is made: on the first candle of the current quadrant ( MHI 1), on the second candle of the current quadrant ( MHI 2) and on the third candle of the current quadrant ( MHI 3).
MHI 1
Entry into the first candle after the quadrant analysis. First martingale (in case of loss) in the second candle and second martingale (in case of two losses) in the third candle.
MHI 2
Entry into the second candle after the quadrant analysis. First martingale (in case of loss) on the third candle and second martingale (in case of two losses) on the fourth candle.
MHI 3
Entry into the third candle after the quadrant analysis. First martingale (in case of loss) on the fourth candle and second martingale (in case of two losses) on the fifth candle.
The million dollar pattern
It is an analysis very similar to that of the MHI , with the difference that it is in the entire quadrant.
The million analysis consists of looking at all the candles in the last quadrant and entering the first candle of the current quadrant saying that that first candle will be the same color as most of the last quadrant.
In cases where we have the same number of candles (3 red and 3 green) we do not trade! And the cataloger will not count these operations.
Three Neighbors Pattern
The analysis of the pattern of the three neighbors will always be in the third candle of the quadrant. Either in M5 or M1 . And it consists of observing the third candle and entering the following ones saying that it will be the same.
Pattern C3
The C3 pattern is also an analysis in the candlestick count. We will enter the first
quadrant candle saying that it will be equal to the first candle of the last quadrant.
In the case of 1 martingale we will enter the third candle saying that it will be equal to the third candle of the last quadrant.
And finally, in need of a second martingale, the entry will be in the fifth candle saying that it will be similar to the fifth of the last candle.
Moonwalker Pattern
The moonwalker pattern is also a quadrant pattern. Our entries will be in the first, second and third candles of the current quadrant.
The analysis is performed on the third, second and first candle of the last quadrant.
The entry of the first candle will be observed in the third candle of the last quadrant, being the opposite color to that observed. Being necessary a martingale, we make our entry into the second candle that claims the opposite color to the second candle in the last quadrant. Finally, our second martingale will be on the third candle of the current quadrant with analysis in which the color will be opposite to the first candle of the last quadrant.

Whole NumbersThis is a simple indicator for the whole numbers.
It breaks down every pair for 10 pips.
Its also simple and nice to use

Binary Option Turbo M1 by MercalonaAuto risk
You are diving into a high-risk investment. We are not responsible for losses, the only certainty is that they will come, the most important thing is to manage them. Test this script on a demo account, and use the backtest. Make sure you are familiar with it before using real money. Use all your experience and other assistance for better accuracy. Do not risk more than 5% per day. Try to use a maximum of 1-2%.
Recommendations
It is highly recommended whenever trying to make entries in stronger areas
Try to make entries when the graph is in trend and with good movements. It is better to lose an entry than to lose money.
Check if the chart is already with good accuracy before making your entry. At least 65%.
Try to make entries when the payout is above 75%. This will help you with risk / return.
About the Script
This script was developed to identify good entry areas quickly and safely. We recommend using in binary option, where the next candle is successful. Although it can also be used in other markets, using a larger timeframe, such as 1h or 4h.
How it works?
This script is based on trends, up and down, where up trend, we look for "CAL" entries in retractions, and down trends, the entries will be "PUT". Always operate in favor of the trend for better accuracy. A session filter is also displayed. The Filter is based on the New York and London session. In these periods there is a greater market volatility, where it is recommended to operate and avoid losses. In addition, there is also a (no trend) filter. Where it shows whether the chart is volatile or not, even during open market sessions.
What is the final result?
This script will show good entries areas. These areas are represented with lines. The lines closest to the current price are thinner lines. And the lines far from price are thicker. The thick lines represent stronger areas and are resistant to price. This means that there is a greater possibility of reversal when prices touch these lines.
Settings (mode)
There are 2 configuration modes:
1. MODERATELY
2. AGGRESSIVE
Using the "MODERATELY" mode, the signals are rarer, here we expect the price to hit the best areas indicated. To place the entry. Here we expect greater accuracy.
In "AGGRESSIVE" mode, we don't expect good entries. Whenever the price hits entry areas it will be considered an entry. In this case, the accuracy is less, since the areas do not have a great potential for reversion.
Settings (Length)
Here the number of bars can be configured for the calculation of support and resistance areas. A low amount may not be enough to check for good areas. And a very large area can be confused with areas that really matter. Try to check the best quantity for the chart you want to trade.
Settings (Win Rate Limit)
Place the limit of analyzed signals in this field. It is restricted to the “Win Rate Max Bars” field, which will be explained below. If the configured limit is not reached, the cause is that there were not enough signals within the configured bar limit. ATTENTION: Understand that a high value will cause a slow calculation of the script.
Settings (Win Rate Max Bars)
This is information is used to limit the number of bars in the “Win Rate” calculation. ATTENTION: Understand that a high value will cause a slow calculation of the script.
Settings (Sessions)
There are 2 other configurations. New York session and London session. You can see how it works reading below.
Indicator “Stars of Recommendation”
The indicator has 3 stars of recommendation.
NO TRADE (There is no positive point to take chances)
In Session (At least 1 open market, this is a positive point to take chances)
In Trend (There is a good probability of assertiveness when it is on trend)
More than one identified area. (Generally, when there is more than one area, the more distant areas become stronger and stronger. This is a positive point when the price reaches them.)
Good luck ❤️
Please feedback us.
We hope this helps you!

Binary KillerThis Binary Options strategy is for the 1-minute timeframe and utilized the martingale strategy. If it does not win the first one, and there is a signal to re-enter, 2.5x your trade amount and enter. (The most I have seen this strategy lose is four times in a row.) If you follow the signals, you are looking at a very high win percentage (relative term) when you combine the re-entries for the win.
1. Set alerts on ONCE PER BAR, do not set for bar end.
2. Once the alert signals, go to the chart and watch to make sure the signal CLOSES at the end of the candlestick. (While you are doing this you should have your binary options broker up, setting up your trade. Make sure you start your trade small. Nobody ever went broke taking a profit)
3. Set your trade time for 1 minute, enter as soon as the candle CLOSES, and the signal is confirmed. (It will go away if it is not a confirmed entry, DO NOT enter if the signal goes away)
4. If the trade is losing, look for a re-entry signal, enter at the close of the candle. Continue as long as you get signals or until you win.
*Trade this at your own risk, it is a risky strategy, know your limits, and do not overtrade. Get a few wins and get off.
Try not to mess with the settings too much, these are optimized for every forex pair.
This indicator is a combination of Bolinger Bands, Stoch, and RSI methods to ensure the best possible entry.

Williams Fractals with Alerts by MrTuanDoanCustom William Fractals for alerts and educational purpose.
Added custom alerts for Williams Fractals.
Also added filter to show less fractals on chart.
The simple idea how I use fractals in Binary Option is to determine temporary resistance and support.
Simple strategy:
- Mark Resistance/Support on higher time frame (e.g. 5M)
- Set an alert for new fractal
- Whenever a new fractal that appears close to your marked Resistance/Support, go to lower time frame (e.g. 1M)
- Wait for rejection at the level that lower than new down fractal (or higher than new up fractal).
- Enter with the same expiry of lower time frame.
Good luck and happy trading. :-)

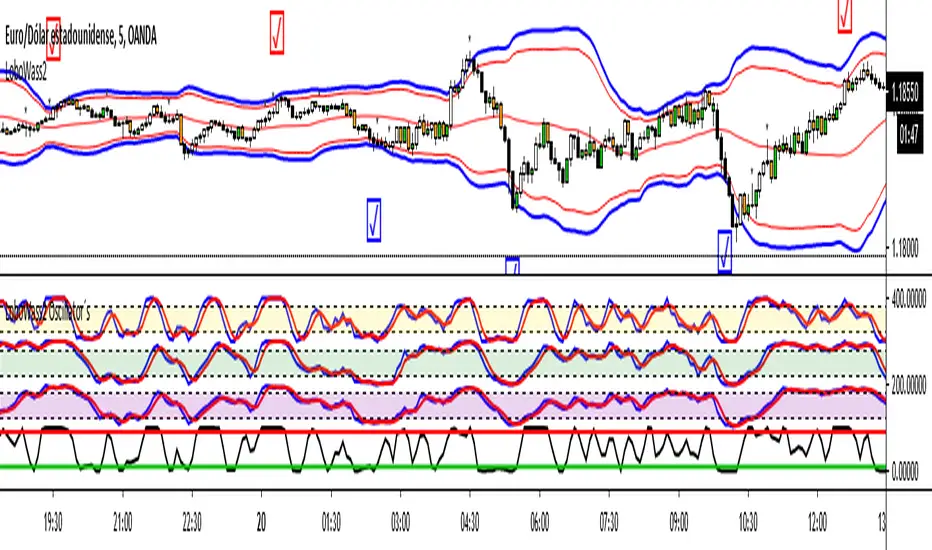
LoboWass2 Oscillator´s by Hashtag_binaryThis indicator composed of several oscillators was designed to be used with the strategy called LoboWass2 to be applied with Binary Options.
The idea of these oscillators is to be able to observe when all together appear in the same position, either overbought or oversold, and take the trade.
Remember that this is a confirmation tool, you must carry out prior analysis as your capital could be at risk. I recommend using this tool for the indicated strategy, as it was designed for that purpose. By working properly and professionally you can achieve great results, it all depends on you.