High Timeframe POCBecause the big Bitcoin crash I have been looking a lot at high timeframe metrics. I never spent much time learning POC so I decided to create a little script for determining these on higher timeframes.
Currently included: Monthly, 3 months and 6 months.
/* DEFINITION */
Point Of Control (= POC) is a price level at which the heaviest volumes were traded.
Value Area High/Low (=VAH/VAL) is a range of prices where the majority of trading volume took place. Naturally, Value Area High being the top price level and Value Area Low being the lowest. POC always is between the two.
/* HOW TO TRADE WITH THIS INDICATOR */
The basis for POC is determining bias on whichever timeframe you choose.
1. Identify a POC on the timeframe of your choosing.
/* If you choose a "low" timeframe (monthly here) then make sure to look at the higher timeframes to see how it is playing against a higher timeframe POC.
2. When the price is moving away from the POC (either to the upside or downside) this will confirm or invalidate the trade.
3. You can now enter the trade on bias or wait for a retest of the same POC.
/* EXAMPLE TRADES /*
Here is a screenshot of some of the trades that are possible solely using the POC and some common sense.
s3.tradingview.com
Bitcoin (Cryptocurrency)

Bitcoin Daily Support/ResistanceA new indicator for tradingview.
Indicator Overview
The 2-Year MA Multiplier is intended to be used as a long term investment tool.
It highlights periods where buying or selling Bitcoin during those times would have produced outsized returns.
To do this, it uses a moving average (MA) line, the 2yr MA, and also a multiplication of that moving average line, 2yr MA x5.
Note: the x5 multiplication is of the price values of the 2yr moving average, not of its time period.
Buying Bitcoin when price drops below the 2yr MA (green line) has historically generated outsized returns. Selling Bitcoin when price goes above the 2yr MA x 5 (red line) has been historically effective for taking profit.
Why This Happens
As Bitcoin is adopted, it moves through market cycles. These are created by periods where market participants are over-excited causing the price to over-extend, and periods where they are overly pessimistic where the price over-contracts. Identifying and understanding these periods can be beneficial to the long term investor.
This tool is a simple and effective way to highlight those periods
MA 50/100/150 was historically good support and resistance. When we cross them we have a new trend that is established.

Godson BTFD ScriptHMA to find trends and signal Long or Short
DMI to ensure momentum is high enough
STDEV to find variance and signal the BTFD/STFR signals

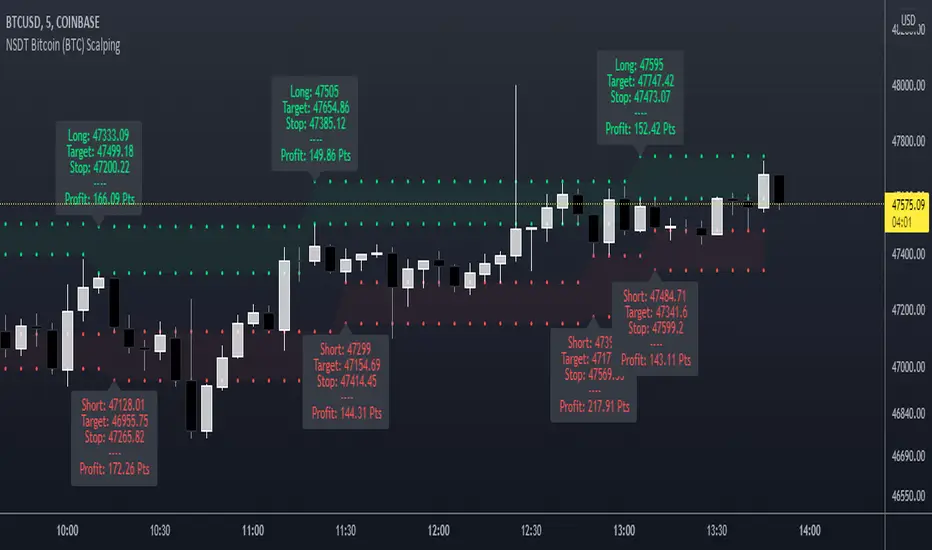
NSDT Bitcoin (BTC) ScalpingThis indicator is specifically designed for scalping Bitcoin (BTC). It looks for a particular price pattern/sequence and displays a label on the chart to show a potential entry, target, and stop based on that analysis. Basically enter long through the green zones and short through the red zones. These levels are not guaranteed to be hit. Trading is risking and you can lose money. Trade at your own discretion and risk. This indicator is only providing potential scalping zones based on recent price action.
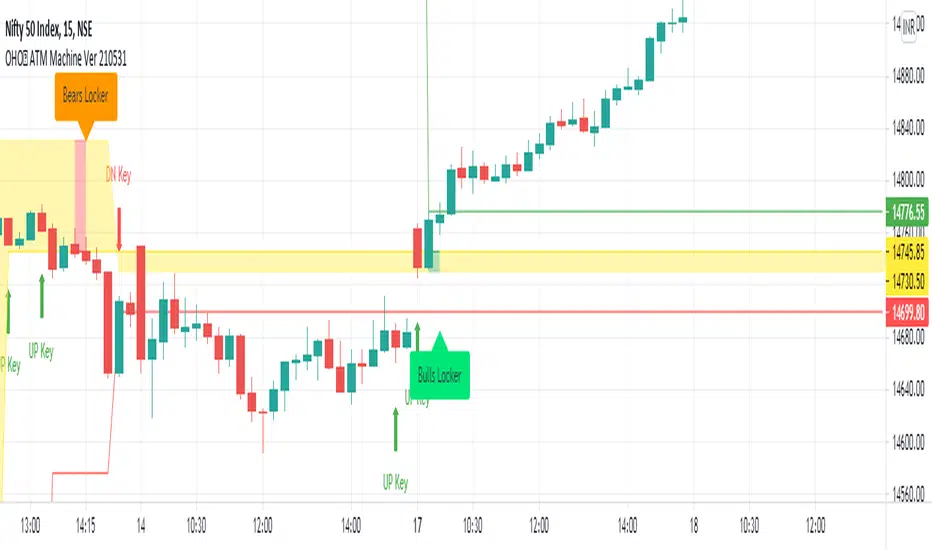
OHO ATM MachineStudies Used:
We have used different type of candle stick patterns, open, close, high, low, Moving Averages, volumes and Average True Ranges in creation of this indicator.
Usage:
It can be used for scalping and intra-day trading. It works best on Nifty 5 Minutes , 15 Minutes, 1 Hour, Daily, Weekly and Monthly Time Frames.
It provides easy to visualize multiple information:
1) It gives the correct Entry on Time. Yellow ATM Area, Means No Trade.
2) Fake Signals are shown when There is Sell Signal and Below is ATM Area.
3) Fake Signals are shown when There is Buy Signal and Above is ATM Area.
4) It gives proper Target at the time of Entry.
5) Stop Loss is Hit when The Candle Closes below ATM Area in Buying and vice versa.
6) No Trade is Recommended, when ATM Area is Yellow.
How to read OHO ATM Machine Indicator?
Buy - When ATM Area is Turned Green in Color First Time after Last Red.
Sell - When ATM Area is Turned Red in Color First Time after Last Green.
Stop Loss - When The Candle Closes below ATM Area in Buy Trade and When The Candle Closes above ATM Area in Sell Trade.
Target - Thin Green Line for Buy Trade and Thin Red for Sell Trade.
Trailing SL - We can Trail the Trade, till the Stop Loss is HIT.
Recommendations:
This can be used for Nifty, Bank Nifty, Stocks, Commodities, Bitcoin, Currency and any other tradable instrument.
What time frame should I use?
5 Minutes and 15 Minutes are best time-frames for Intra-day Trades.
15 Minutes and Hourly are best time-frames for Swing Trades.
Hourly and Daily are best time-frames for Short Term Trades.
But you can check different time-frames in Strategy Testing section or as per your requirements.
Disclaimer:
Past performance is not the guarantee of future performance.
For any type of queries kindly send us personal message.
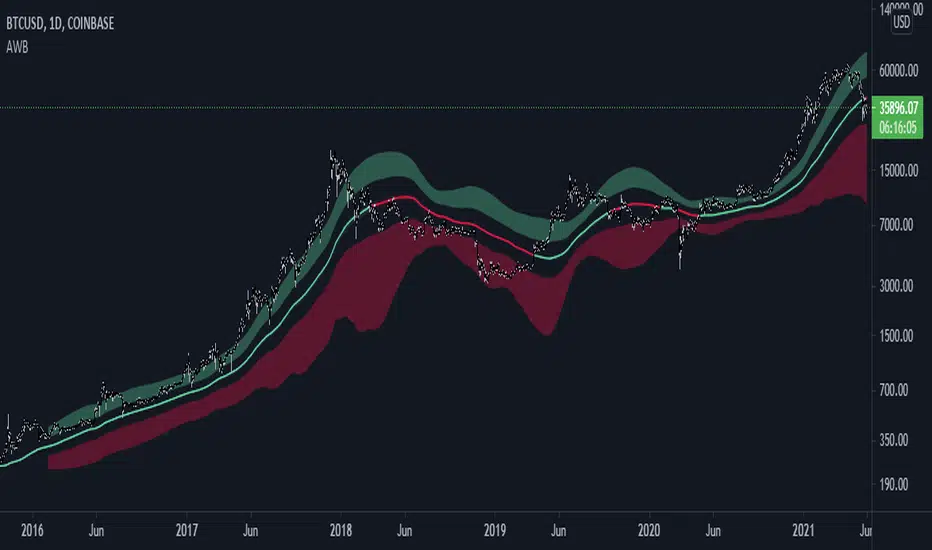
AWB - Alma Weird Bands [SilentShiller]A simple experiment that using Arnaud Legoux Moving Average tries to help visualize an extended trend and its reversal . You can play with:
Alma length
Alma offset ( needs sigma not to be 0 )
Alma sigma
I hope you find it useful. Feel free to modify it and let me know to test your scripts!
Crypto RSI Oscillator [marksc]This is my main indicator of pricing trend reversals.
It consists of two main indicators:
1. The green/red oscillator shows a general rising (green) or falling (red) price trend over a smoothed average of a number of periods (length).
2. The yellow "OverUnder Line" shows the Relative Strength Index adjusted price trend in real time.
How to use it:
- You will need to adjust the Overbought and Underbought (green and red) horizontal lines such that the yellow line rarely peaks past them. This will depend on historical data and the time-scale you're using. So if you configure it on a 15minute timescale and then switch to hourly the lines will need-readjusted. This is because the yellow line's movement is "Relative" to a number of periods of time in the timescale.
Predicting Pricing Reversals:
Adjust the Overbought and Underbought lines such that, in the past, the yellow line has rarely peaked over or under them.
When the yellow line peaks over or under one of the Over/Underbought lines again the price will likely make a strong reversal.
(Conversely, if the yellow line is not peaking but staying mostly flat or only slightly angled then the pricing trend is likely to continue.)
Predicting "Pump and Dumps":
If the price makes a sharp reversal while the yellow line was far from the over/underbought lines (ie. the yellow line was near the center), this indicates that a larger purchase or sale than has happened in a long time just happened. In most cases the price will quickly correct back to where it was because this sharp price reversal was was abnormal over the length*period used in the RSI calculation.

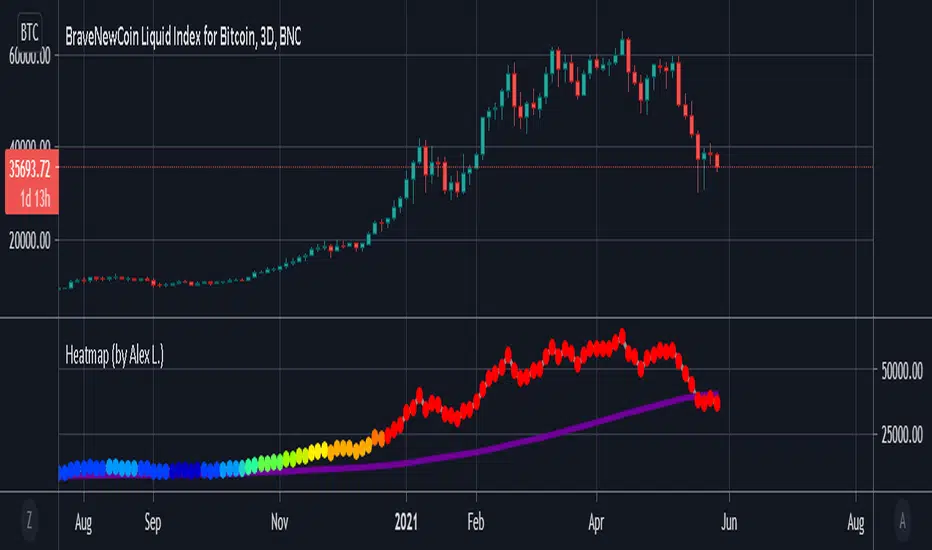
Bitcoin Heatmap (by Alex L.)This indicator is a based on "200 Week Moving Average Heatmap" by Plan B. It shows "heatmap" of a security based on % increase of its 200 week (or other) moving average. It can be used for Bitcoin, as well identifying overheated Stocks (like TSLA). Plan B designed this indicator for Bitcoin using MA = 1400 (which is 200 trading days in Crypto), I personally found it useful to indicate overheated Stock Market stocks using MA = 250 (which is ~1 year of net trading days, excluding weekends and holidays).
Enjoy!
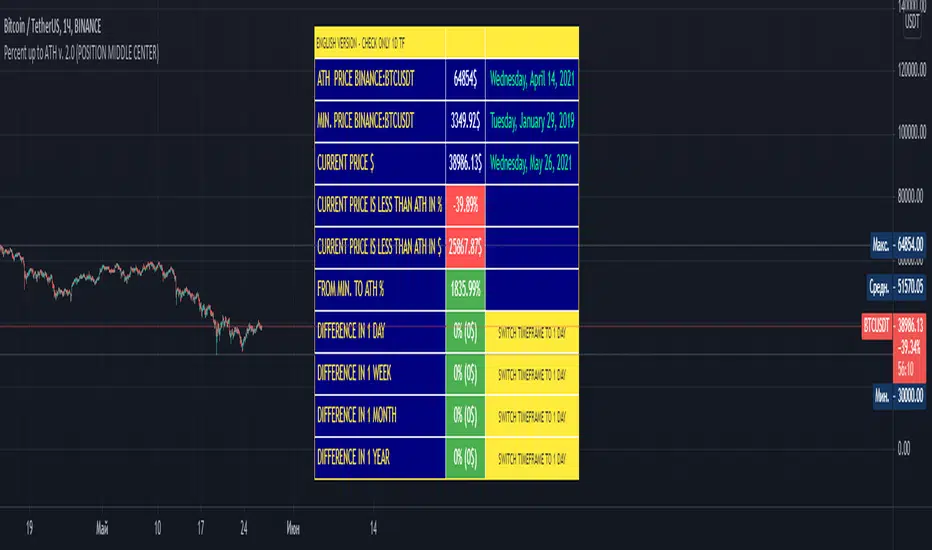
Percent up to ATH v. 2.0 (CHECK 1D TIMEFRAME)for the label to display the price change for 1 day, 1 week, 1 month and 1 year, you must switch the graph to the daily (1D) timeframe
this script shows:
- the maximum price and the date of this maximum
- the minimum price and date of this minimum
- current price and date of this price
- the difference between the current price and the maximum price in percent (%) and in dollars ($)
- the difference between the minimum price and the maximum price in percent (%) and in dollars ($)
- price change in percent and dollars for 1 day, 1 week, 1 month and 1 year
this script displays information in two languages - English and Russian
---------------------------------------------------------------------------------------------------------------------------------------------------------------------------------------------------------------
Чтобы на метке отображалось изменение цены за 1 день, 1 неделю, 1 месяц и 1 год, необходимо переключить график на дневной (1D) таймфрейм
этот скрипт показывает:
- максимальную цена и дату этого максимума
- минимальную цена и дату этого минимума
- текущую цена и дату этой цены
- разница между текущей ценой и максимальной ценой в процентах (%) и в долларах ($)
- разница между минимальной ценой и максимальной ценой в процентах (%) и в долларах ($)
- изменение цены в процентах и долларах за 1 день, 1 неделю, 1 месяц и 1 год
этот скрипт отображает информацию на двух языках - английском и русском.
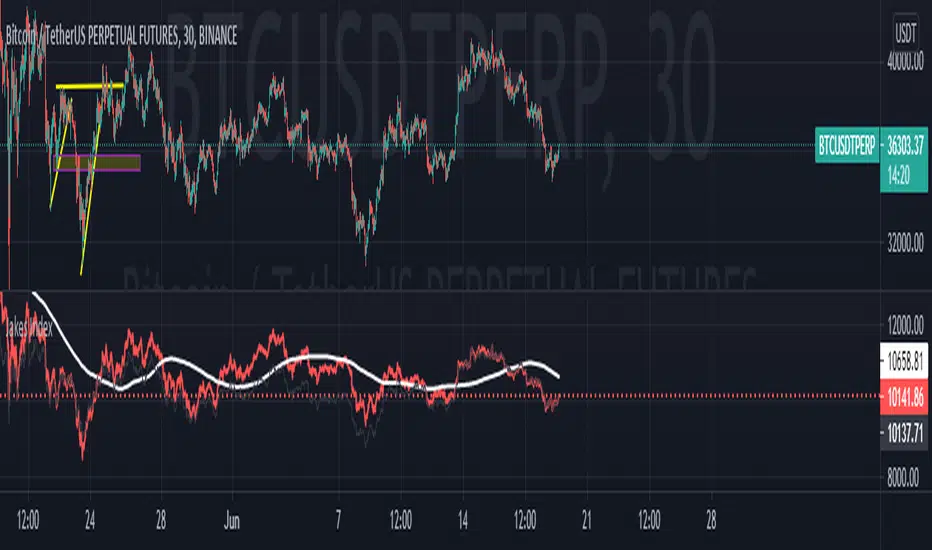
BTC aggregated volume Index [Benson]Aggregate 10 most significant BTC trading pairs' volume on the market.
Bitfinex:BTCUSD
Bitstamp:BTCUSD
Coinbase:BTCUSD
Kraken:BTCUSD
Kraken:BTCEUR
Bitflyer:BTCJPY
BINANCE:BTCUSDT
HUOBI:BTCUSDT
OKEX:BTCUSDT
Bitstamp:BTCEUR
Setting (user input)
1. You can set length to see how SMA moves. Default is 7.
2. You can set std difference. If the volume is difference*std higher than average, the pillar would be orange, if difference*std is less than average, the pillar would be green, otherwise the pillar would be black. Default is 1.
3. You can set the volume in USD or in BTC. Default is in USD.

Beam Bands + Fibonacci LevelsThis indicator calculates the Fibonacci retracement levels based on beam bands. As you can see the price very often reacts to these levels.

Bitcoin Logarithmic Regression RainbowI know there are a lot of BTC rainbows out there, I just wanted to publish my version with my fittings to the BTC price.
The grey channel at the bottom encloses the March 2020 Corona dump.
For best experience USE WEEKLY TIMEFRAME .

Jakes Index------------
English
I introduce the community to the Jakes Index. Basically, this is an index containing the top 10 cryptocurrencies, classified according to their Marketcap. The purpose of this index is to show a general market context, without being tied to a single crypto. With an overview of the market, it is easier to identify the market trend, in addition to being an excellent indicator to gauge the performance of your Crypt portfolio. Supply data comes from CoinMarktCap, and price data comes mostly from Binance, however some crypts are not yet available for trading by it, so the prices used come from the first broker indicated by TradingView in the search.
Given that one of the crypts was launched very recently, Internet Computer to be more exact, I decided to leave it out of the index, adding "//" to the code in all references to it. If you want to see the performance of the index with the included cryptography, just delete the bars that follow in front of your code, such parts: "ASSET8; SUPPLY8; PESO8; QOC8; FINM8" after that add "//" in "PESO11" and remove the bars from "PESSO11F", in addition to also removing the F. Do the same with "JAKESINDEX" at the end of the code, and you will have the result with the Internet Computer included.
The calculation of the index takes into account the Marketcap of the crypto, which is divided by the sum of the Marketcap of all the others, and then the result is multiplied by the market value of the Cryptocurrency. Thus, we have an index weighted by Marketcap with the 10 most important cryptocurrencies in the market AT THE TIME. It is important to remember that this index must be updated, both in terms of the currencies that change their place in the ranking with certain frequency, as the Supply that each one has, since coins with active mining, as is the case of Bitcoin, change their Supply frequently.
To keep the index up to date, I will do ONE Monthly update, always posting the code with the new changes.
------------
Português
Apresento a comunidade o Jakes Index. Basicamente, este é um índice contendo as 10 principais criptomoedas, classificadas de acordo com seu Marketcap. O objetivo deste índice é mostrar um contexto geral do mercado, sem ficar preso a uma única cripto. Com um apanhado geral sobre o mercado, fica mais fácil identificar a tendência do mercado, além de ser um excelente indicador para balizar o desempenho da sua carteira de Criptos. Os dados referentes a Supply são advindos do CoinMarktCap, e os dados dos preços vem em sua maioria da Binance, porém algumas criptos ainda não estão disponíveis para negociação pela mesma, portanto os preços utilizados vem da primeira corretora indicada pelo TradingView na busca.
Tendo em vista que uma das criptos foi lançada muito recentemente, a Internet Computer para ser mais exato, decidi deixa-la de fora do índice, adicionando "//" no código em todas as referencias a mesma. Caso queira ver o desempenho do índice com a cripto incluída, basta apagar as barras que seguem na frente de seu código, sendo tais partes: "ASSET8; SUPPLY8; PESO8; QOC8; FINM8" após isso adicione "//" em "PESO11" e remova as barras de "PESSO11F", além de remover também o F. Faça o mesmo com "JAKESINDEX" no fim do código, e terá o resultado com a Internet Computer incluída.
O calculo do índice leva em conta o Marketcap da cripto, que é dividio pela soma do Marketcap de todas as outras, e então o resultado é multiplicado pelo valor a mercado da Criptomoeda. Dessa forma, temos um índice ponderado pelo Marketcap com as 10 Criptomoedas mais importantes do mercado NO MOMENTO. É importante lembrar que este índice deve ser atualizado, tanto em questão das moedas que mudam com certa frequência seu lugar no ranking, como o Supply que cada uma tem, visto que moedas com mineração ativa, como é o caso do Bitcoin, mudam seu Supply com frequência.
Para manter o índice atualizado, farei UMA atualização Mensal, postando sempre o código com as novas alterações.
Bitcoin Price Bottom IndicatorThis Indicator flashes up on bottoms of each Bitcoin market cycle. It’s suggesting, that the price of BTC finds strong support at the 200W SMA . Thats why it’s not flashing up in the first cycle, because there was not enough price data at that moment.
This Indicator uses price data from the weekly timeframe so for the best experience USE WEEKLY TIMEFRAME .

EMA+RSI Pump & Drop Swing Sniper (With Alerts)This is using an EMA and RSI with slightly modified settings to give good entry and exit points while looking at Bitcoin. I use this on a 4-hour chart and with other indicators to find good positions to enter a trade or exit if things are turning red.
If you click on the EMA line it will color the bars of the chart based on if they are above or below the EMA - This is just visually helpful for me to see the active trend.
Make sure you hover over or click on the EMA line to see the colors of the candles change - it's not visible by default or without doing this.


Price DEFI Categories against BTC & ETH/* Work in progress. The indicator is not finished. *\
The indicator shows the pricing of 3 DEFI categories against 2 possible baselines, BTC and ETH.
To do:
* Make a simple array in the source code to enter and remove new projects to the category. -> Maybe can also make it so that the source code does not have to be altered (projects can be added through input etc.)
* Adjust weightings depending on project data but this is not as important since weightings are being priced in by the market.
* Try to find a way to update input to string instead of booleans. As of currently, I could not seem to use input strings into plot functions because of an error.
* and more. Leave some feedback, that would be highly appreciated!

Moving Average BandsUse this script to find buy and sell zones for BTC based on momentum of the move relative to the average asset price over a given period. The script plots a series of offset bands above and below the Simple Moving Average. When price crosses another band further from the SMA, the background is rendered brighter. The brighter the background, the stronger the buy and sell signal is, as the expectation is that price wants to return to the SMA. Settings are adjustable to fine tune to various time frames and assets. Good settings for BTC Daily are length 30, layers at 10, 20, 30, and 40.
On 1H BTC/USD I use length 200, layers at 5, 10, 15, 20 to find decent swing trading opportunities.
On BTC/USD 1D chart, combine with Bitcoin Logarithmic Growth Curve from @mabonyi (original by @quantadelic )for confluence of very reliable signals.

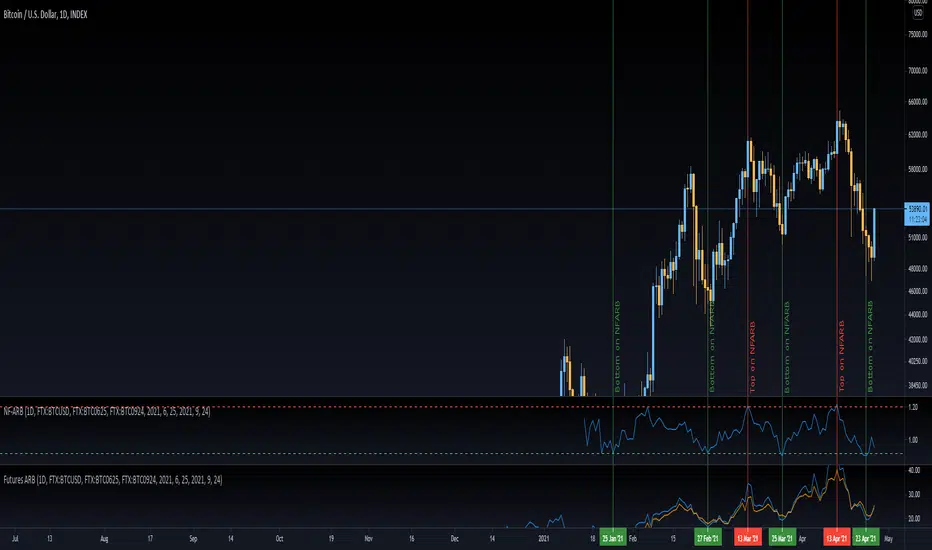
NF-ARBThe NF-ARB stands for Near/Far Ratio of Annualized Rolling Basis. It takes premium or discount of the 3 month and 6 month futures against spot price and calculates the annualized value for the same. Then the ratio between the near and far ARB is obtained. This ratio is helpful in finding swing tops and bottoms.
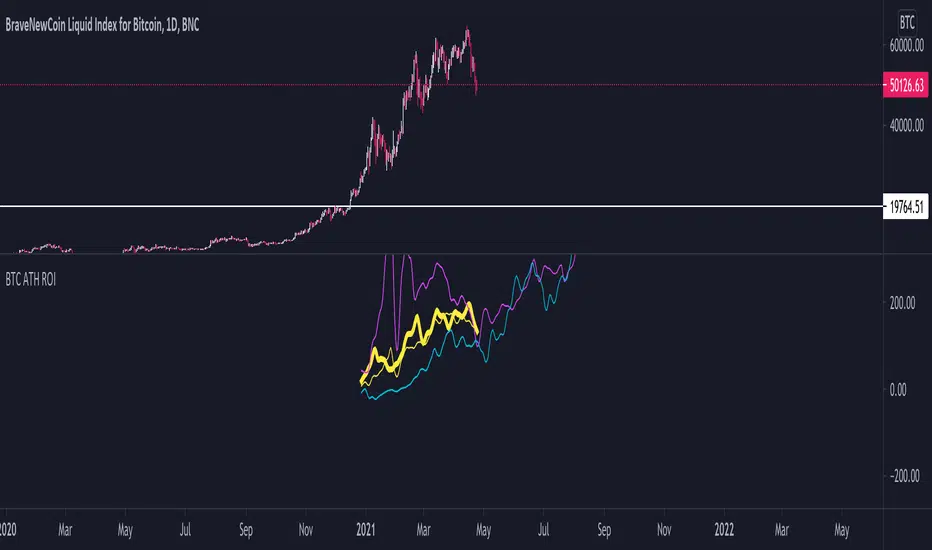
BTC ATH ROIThis indicator shows the ROI % of Bitcoin from when it passed its ATH of the previous bull cycle. I found it interesting that each time it crossed its ATH it took around 260-280 days to peak for each one. This bull run seems to follow between both of the previous bull runs including this recent dip.
There are a couple issues I want to fix but can't figure out:
1. You need to completely scroll out and move towards 2013 on the Daily chart for all 3 lines to show up. Would be nice to load all of that data at the start.
2. I can't query the value of the plots after they have been offset. This would be useful to create a prediction bias for the current plot so would could see where btc might go.
If you peeps know of a way to load all data or query plot values after offsets, please share. That would be awesome.
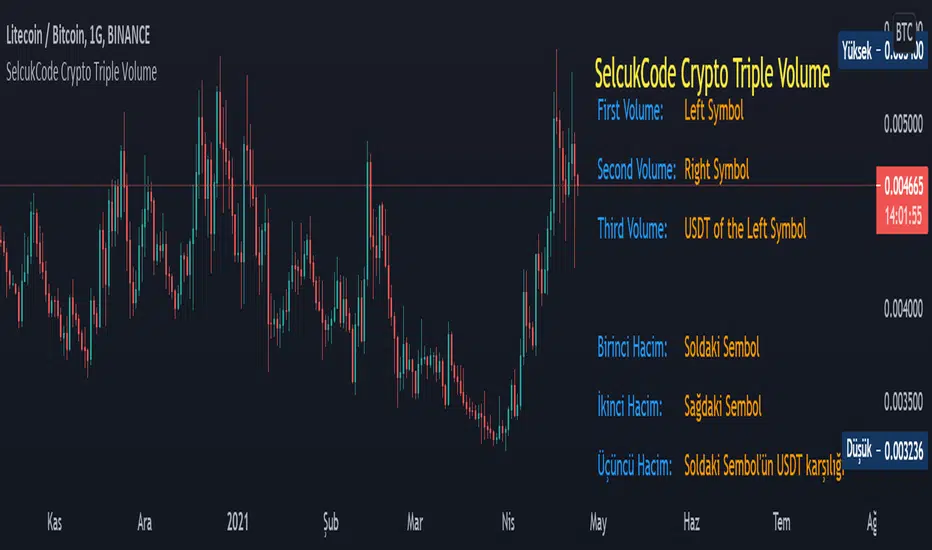
SelcukCode Crypto Triple VolumeThis is a volume indicator written for cryptocurrencies. The difference from the integrated indicator is that the left symbol of the cryptocurrency shows the volume as well as the right symbol. It also shows the volume of the pair in USDT. Thus, we see the USDT volume of each cryptocurrency pair. This standardizes our view of volume.
Bu, kripto paralar için yazılmış bir hacim indikatörüdür. Entegre indikatörden farkı, kripto paranın sol sembolünün hacmini göstermesinin yanı sıra sağ sembolün hacmini de gösterir. Ayrıca paritenin USDT olarak da hacmini gösterir. Böylelikle her kripto para çiftinin USDT hacmini görmüş oluruz. Bu bizim hacime bakış açımızı standartlaştırır.
QMWD RangerThis script will display the previouse Highs, Lows and Mid of the last:
- Quarter
- Month
- Week
- Day
Ranges
Its pretty good in finding potential pivot areas.
