Brandon BollSecond day at Pinescript and I am attempting to tweak the Bollinger Bands directed strategy to send alerts to Zignaly in order to automate long buy/sells.
I've left in the short script though for completeness.
The buy and sell instructions work perfectly but I don't know how to do a cancel order alert (as included in the original strategy)
Bitcoin (Cryptocurrency)

AntiRekt RibbonThis script is a fork of the Madrid Ribbon, the only difference is that you can color your bars depending on the trend.

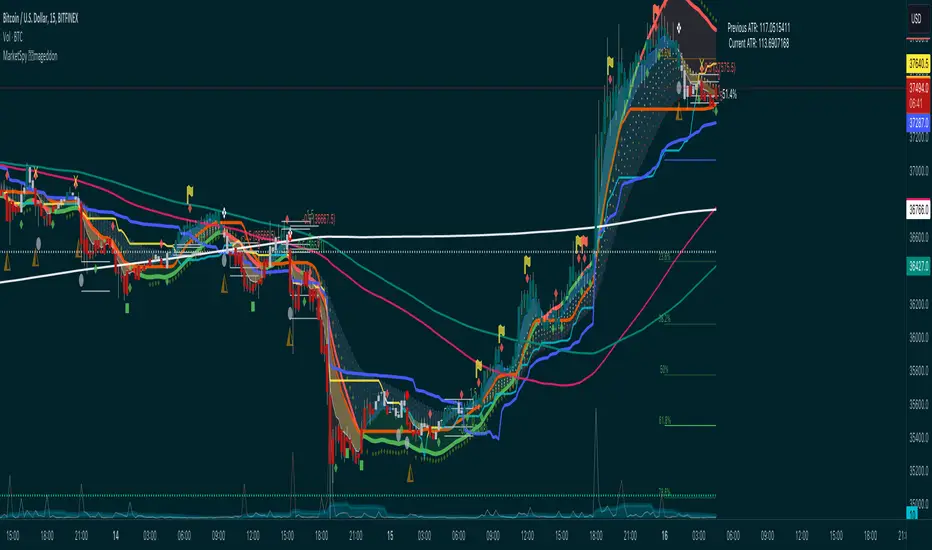
MarketSpy ARmageddonMarketSpy trading suite was designed to sniff out momentum swings and allow you to profit riding the wave. No matter what market, no matter the timeframe - this is all you need, from here on out this is your trading desk.
It's made up of three main components (with future add-ons in development):
1. MarketSpy X - the ultimate entry and exit tool that is built using custom momentum algorithm to find exact moments of reversals - without a fail. It's the one on the bottom with "green pulse dot" buy signals and "blood diamond" sell indicators.
2. MarketSpy ARmageddon (Augmented Reality) - price action overlay that analyses trends and is a confirmation tool for MarketSpy X. Can show confluence from top 5 market indicators, gives signals of reversals or chop zones, predicts prices(!) and is fully dynamic that reacts to market conditions LIVE.
3. MarketSpy S/R - This thing sniffs out and draws support and resistance based on math, not human eye. This means that MarketSpy effectively can go head to head with bots and algorithms and see right through the market to give you incredibly accurate points of interest where machines and humans sell and buy - ride the way together with the whales. Sounds cliche until you try it.
For more - visit our discord.
MarketSpy XMarketSpy trading suite was designed to sniff out momentum swings and allow you to profit riding the wave. No matter what market, no matter the timeframe - this is all you need, from here on out this is your trading desk.
It's made up of three main components (with future add-ons in development):
1. MarketSpy X - the ultimate entry and exit tool that is built using custom momentum algorithm to find exact moments of reversals - without a fail. It's the one on the bottom with "green pulse dot" buy signals and "blood diamond" sell indicators.
2. MarketSpy ARmageddon (Augmented Reality) - price action overlay that analyses trends and is a confirmation tool for MarketSpy X. Can show confluence from top 5 market indicators, gives signals of reversals or chop zones, predicts prices(!) and is fully dynamic that reacts to market conditions LIVE.
3. MarketSpy S/R - This thing sniffs out and draws support and resistance based on math, not human eye. This means that MarketSpy effectively can go head to head with bots and algorithms and see right through the market to give you incredibly accurate points of interest where machines and humans sell and buy - ride the way together with the whales. Sounds cliche until you try it.
For more - visit our discord.

BB - Study - CryptoFoudid.comHi everyone,
A new script transformed on a study from QuantNomad.
Based on the Bollinger Bands to catch the range market.
I filtered the consecutive signals to avoid a "funding" issue.
You can configure it as you want based on inputs.
The best way for crypto is to have about 45 to 55 length and 2 to 3.5 in multiplier but it's your choice :)
ENJOY !

Bitcoin Prices InfoPanelHello traders
This script is based on the great Ricardo Santos InfoPanel script
It will display all the Bitcoin prices
The script is public so you can adjust according to your own needs
PS
You might have to scroll right on your chart to see the panel
Enjoy :)
Dave

indicator StrategyBITMEX5 FOR LONG BUY2This indicator was developed for trading using RCI .
It performs well in day trading and swing trading.
* Signal conditions for long entry *
It is displayed when the short-term RCI crossovers the lowerband.
* Take profit condition *
It is displayed when the short-term RCI crossunders the lowerband.
* Optimized the entry conditions using CM_Williams_Vix_Fix created by ChrisMoody.
************************
Hello everyone!
I am very pleased with your evaluation.
This script is a masterpiece of the current stage of successful development of a technical analysis of cryptocurrencies over two years.
This has been published for cryptocurrency fans like you, but it may be closed in the near future.
If you like this indicator, please support money for my activities.
We would like to use that money as an activity cost for further indicator updates and better strategy development.
This development work is very hard and requires careful attention, but I am passionate about making them successful.
The amount of money does not matter.
The value you felt was that amount.
BTC
39LbiVReUjxX7k2gqWxQeDAVJtYfTCREzB
LTC
MVAJG4ubzugi2jxZ6P6wqXJXA3RqzmNqYK
ETH
0x7c5715b87a268993c4d78086016015b39985c835
USDC
0x7c5715b87a268993c4d78086016015b39985c835
Thank you.

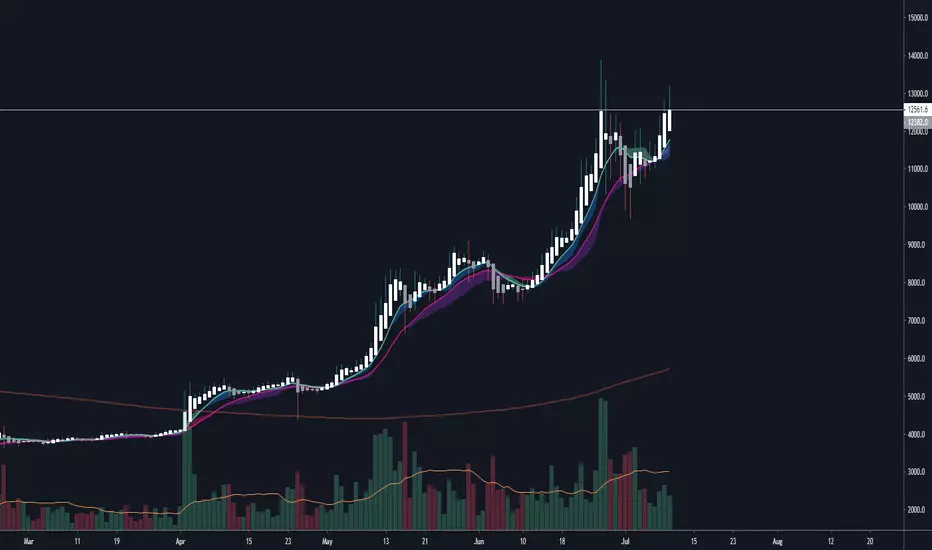
kiska cloudskiska clouds: crypto twitter's next cloud meme
Crypto is a fast-paced, highly-volatile asset, therefore, many traditional strategies are thrown out of the window when applied to cryptocurrency markets. In trading, there are only two things known for sure: price and volume. Price and volume data is then manipulated using various math equations in an effort to discover patterns and/or make predictions. kiska clouds are no different.
The kiska clouds are a simple crossover strategy. The clouds are different because of the unique averages being used and the embedded momentum indicator.
To use the clouds is simple:
When the green line crosses above the pink line, you buy/long.
When the green line crosses below the pink line, you sell/short.
The clouds are indicative of the trend's momentum. Using the power of math, the larger the cloud indicates a higher amount of buying/selling pressure. As the cloud thins, momentum is slowing, and the trend may be reversing.
At the time of testing, the strategy had a profitability of 54.55% accuracy with 1133.41% net profit. While I think this could be automated into a bot, adding a human element with stop losses and further analysis will significantly improve the accuracy/profitability.
This indicator is a "Pay What You Want" model. For a trial or to purchase this indicator, send me a message on Twitter @moonkiska or here on TradingView. You will be granted a 2-3 day trial period to the backtesting strategy.
Tips:
The higher the time frame, the more accurate the strategy.
Personally, I do not short above the 200MA. I do not long below the 200MA.
Coming Soon:
Support/Resistance
Trend Lines
Cyatophilum Scalping Bot V2 [ADVANCED SETTINGS] [ALERTSETUP]Advanced Settings version of Cyatophilum Scalping Bot V2
For people who like tweaking settings =)
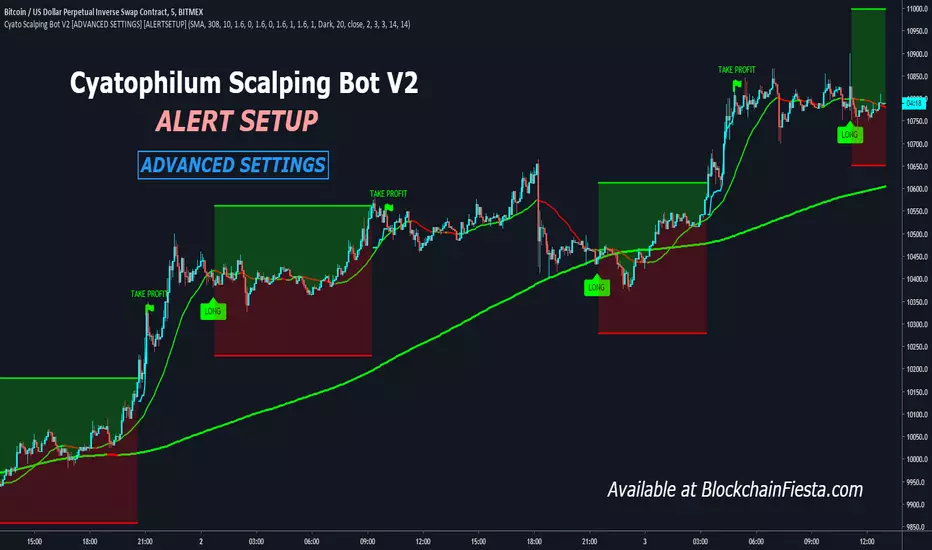
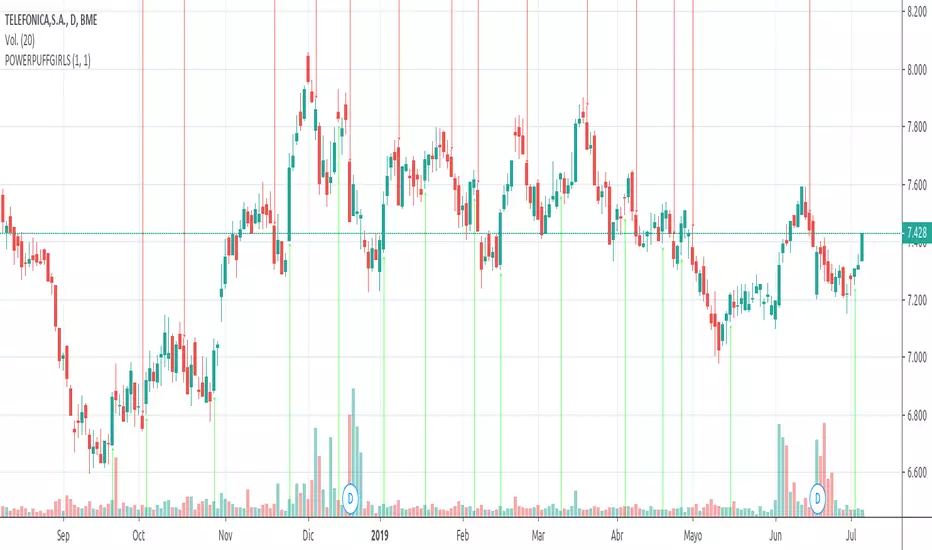
POWERPUFFGIRLS WE ARE GIRLS PROGRAMMING GREAT CODES, WE CREATE THIS INDICATOR THAT GIVE YOU THE CONTROL OVER THE ALERTS, JUST BUY IT WHEN GREEN ARROW APPEARS, AND SELL HEN THE RED ONE COMES OUT, GOOD LUCK
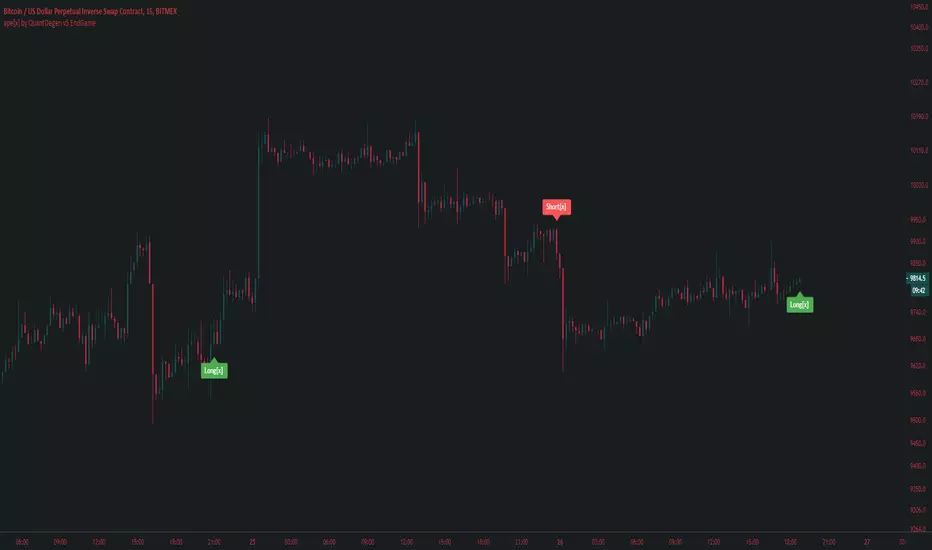
ape[x] v1.0 15minFor more info or access
Contact
Twitter : @quantdegen
Discord : Find it in twitter info.
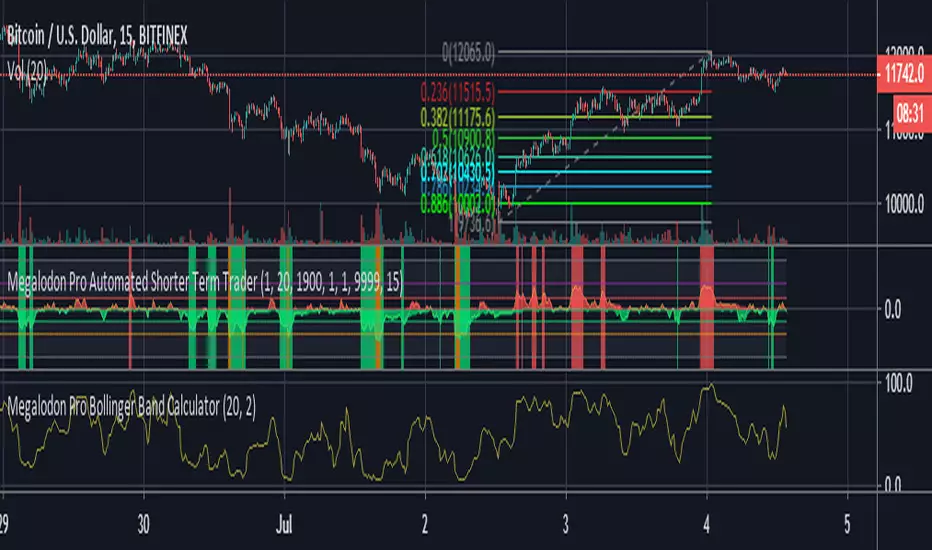
Megalodon Pro Bollinger Band CalculatorHow to use?
It ranges between 0-100. 0 is oversold, 100 is overbought.
It could be a really beneficial tool for timing your day trades in lower time frames.
It is designed for 1 minutes - 15 minutes - 30 minutes - 60 minutes - 240 minutes - 1 Day time frames.
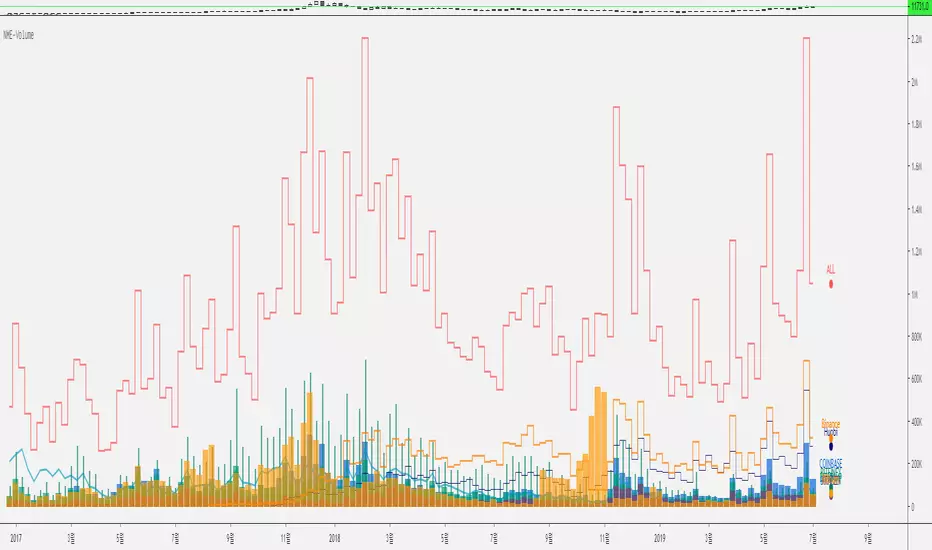
Nexgen Multi-Exchange-Volume V 1.0 by rEPLAYEr1. Hello, Everyone.
2. This is a very simple indicator that sums up the Bitcoin's total trading volume of the major exchanges such as Bitfinex, Binance, Huobi Global, Bitstamp, Kraken, Coinbase, and Bitflyer.
3. This indicator was created to comprehend the fluctuation of the overall market volume.
4. We did not add the BITMEX because it uses leverage-weighted volume and thus is quite different from the actual volume indicator used by other exchanges.
5. It automatically sums up the volumes according to the various time frame.
6. It may be difficult to see the indicator by default setup, so you can customize the display to your aesthetic point of view.
7. We will continue to update to help you find the overall volume flow.
8. Thank you and we wish your succesful investment.
===============================================================
皆さん、こんにちは。
これは非常に単純な指標であり、主要取引所のビットコインの量を合計したものです。
この指標は、Bitfinex、Binance、Huobi Global、Bitstamp、Kraken、Coinbase、Bitflyerなどのいくつかの有名な取引所の取引量の合計であり、市場全体の取引量の変動を調べるために作成されました。
BITMAXを追加しませんでした。 BITMEXの量はレバレッジ加重量であるため、実際の量とは異なります。
タイムゾーンと連動して自動的に変更することができます。
デフォルト設定ではインジケータを見るのが難しい場合があるので、美的観点に合わせて表示をカスタマイズできます。
私達はあなたが全体のボリュームフローを見つけるのを助けるために更新し続けるでしょう。
ありがとうございます。私たちはあなたの成功した投資を願っています。
================================================================
안녕하세요.
넥스젠의 투더문입니다. 저희 훌륭한 개발자인 RE님을 갈아서 또 매우 심플하고 간단하지만 비트코인 거래에 도움이 되는 지표를 만들었습니다.
이 지표는 매우 간단한 볼륨지표로서 주요 거래소의 볼륨을 합산한 것입니다.
비트파이넥스, 바이낸스, 후오비 글로벌(후오비코리아 아님), 크라켄, 코인베이스, 비트플라이어 그리고 빗썸에서 거래되는 BTC의 거래량을 합산한 것입니다.
비트맥스의 경우에는 레버리지가 가중되기 때문에 정확한 거래량으로 보기 어려워 비트맥스는 제외했습니다.
타임프레임을 옮겨가면 해당 타임프레임에 맞게 자동으로 조절되게 해뒀습니다.
디폴트 설정은 그 나름 최대한 보기 좋게 꾸며뒀지만, 불필요한 거래소도 있을 것이고, 본인의 심미적 관점에 따라 보게 꾸밀 수 있게 옵션이 제공됩니다.
감사합니다. 여러분의 성투를 기원합니다.
indicator:StrategyBITMEX5 FOR LONG BUY1This indicator shows the entry signal and timing of profit determination under specific conditions.
This indicator shows high performance in 3 hours of XBTUSD of BITMEX.
/ / / / / / / / / / / / / / / / / / / / / / / / / / / / / / / / / / / / / / /
* longCondition 1
// Zero Lag MACD
crossover (ZeroLagMACD, signal)
(Display Alert signal when Zero Lag MACD makes a golden cross.)
* CloseCondition1
crossunder (ZeroLagMACD, signal)
/ / / / / / / / / / / / / / / / / / / / / / / / / / / / / / / / / / / / / / /
* longCondition 2
// SAR
longentry4 = From SARdown to SARUP and uptrend of moving average line
(A signal is issued when the parabolic SAR shows an uptrend.)
* CloseCondition 2
closelong4 = From SARUP to SARdown
/ / / / / / / / / / / / / / / / / / / / / / / / / / / / / / / / / / / / / / /
In general, if only MACD and signal cross timing or SAR signal conversion is used as the entry timing, our account balance will be increasingly reduced.
So I added some filters to longCondition1 and longCondition2.
Of course this logic is no repaint.
It does not employ multi-time frames.
/ / / / / / / / / / / / / / / / / / / / / / / / / / / / / / / / / / / / / / /
Entry filter
* Filter 1
When fighting against resistance lines with closing or high prices.
* Filter 2
MACD Divergence
* Filter 3
When market volatility is low.
//////////
version up
2019/07/04 - Responding to falling long entries

Bitmex Dollar Value CalculatorWith this indicator you can easily calculate either the bitcoin value of a certain amount of dollars or the dollar value of your bitcoin (particularly helpful when trading on bitmex)
Tipjar : 38uGQJDDZDL6wX48x4gYTccPeQ3ZHVYmY4 (btc)

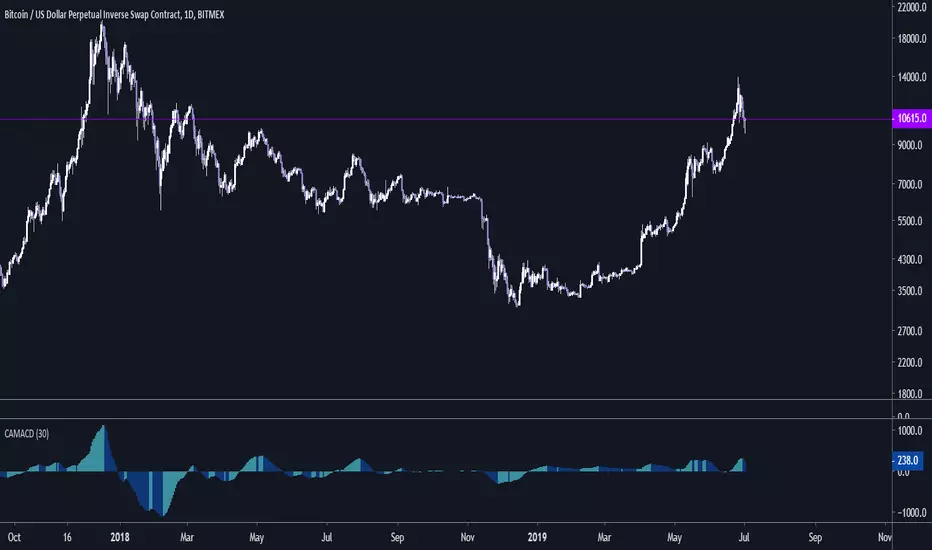
Cryptocurrency Adjusted MACD - CAMACDAdjust settings to your liking!
Support the development of new indicators:
BTC: 1LRHrA9wChPyZgCtWj3vBxv8FwHKWKmmmU
LTC: Lfw6FfeZhJofLJSackJ5uDam2BnDqh8Acp
ETH: 0xeE7abEc3303D5Ca4c05b876B2cE8E2406481365a
ZCASH: t1gSCHrcRN1GcCP2YWGh6xG9hSxSkxMoofF