KT_Global Bond Yields by CountryGlobal Bond Yields Indicator Summary
The Global Bond Yields by Country indicator, developed for Trading View (Pine Script v5), provides a comprehensive tool for visualizing and analyzing government bond yields across multiple countries and maturities. Below are its key features:
Features
Country Selection: Choose from 20 countries, including the United States, China, Japan, Germany, United Kingdom, and more, to display their respective bond yields.
Multiple Maturities: Supports 18 bond maturities ranging from 1 month to 40 years, allowing users to analyze short-term to long-term yield trends.
Customizable Display:
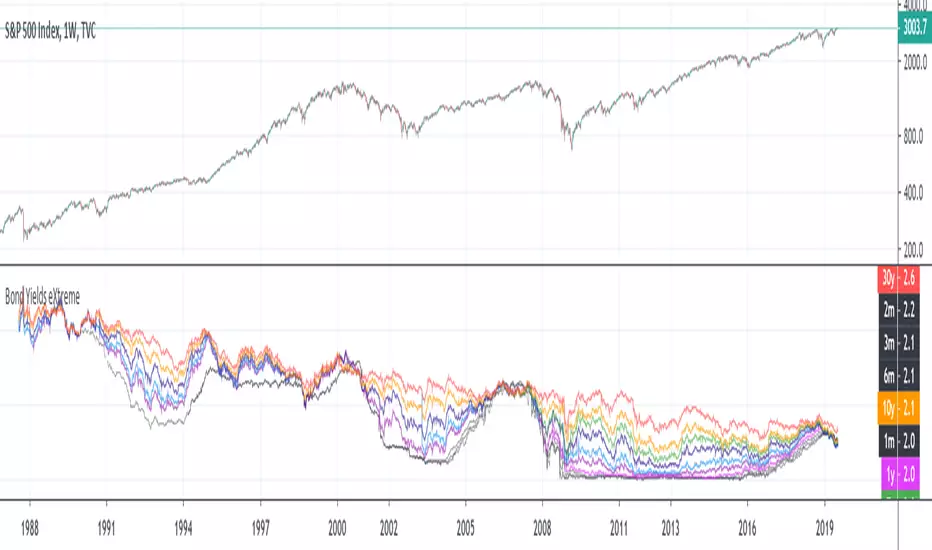
Toggle visibility for each maturity (1M, 3M, 6M, 1Y, 2Y, 3Y, 4Y, 5Y, 6Y, 7Y, 8Y, 9Y, 10Y, 15Y, 20Y, 25Y, 30Y, 40Y) individually.
Option to show or hide all maturities with a single toggle for streamlined analysis.
10Y-2Y Yield Spread: Plots the difference between 10-year and 2-year bond yields, a key indicator of yield curve dynamics, with an option to enable/disable.
Zero Line Reference: Displays a dashed grey horizontal line at zero for clear visual reference.
Color-Coded Plots: Each maturity is plotted with a distinct color, ranging from lighter shades (short-term) to darker shades (long-term), for easy differentiation.
Country Label: Displays the selected country's name as a large, prominent label on the chart for quick identification.
Error Handling: Alerts users if an invalid country is selected, ensuring robust operation.
Data Integration: Fetches bond yield data from Trading View's database (e.g., TVC:US10Y) with support for ignoring invalid symbols to prevent errors.
This indicator is ideal for traders and analysts monitoring global fixed-income markets, yield curve shapes, and cross-country comparisons.
BOND

Equity Bond Currency DashboardDepicts demand-flow between Equities, Bonds and Currencies of 6 countries. Useful in tracking the flow of smart money and checking the dynamics of inter-connected markets.
Principle:
DXY lies at the heart of the diagram with usd-currency pairs of 5 countries connected to it. When demand for a currency increases it strengthens against Dollar. This is depicted by a line from DXY to the currency indicating demand flow from Dollar to the currency (DXY is only an indicative symbol for Dollar, the currency may not be part of the dollar index). Similarly when Dollar strengthens against the currency, demand flow is depicted by a line from the currency to DXY. Currency blocks are connected to Equity and Bond Yields of the respective countries. Equities and Bonds, when bought, takes the demand from the respective currencies and vice versa.
Overall, the demand flows in the direction of arrows. The flow is incomplete without commodities, import/export, interest/inflation rates of countries, however, the diagram most of the times explains why an asset class is performing the way it is.
Left side bar of each block is very similar to OHLC candles except for the following -
Instead of wicks, top and bottom of the bar represents high and low for the selected time-frame
Open and close are normalised for high and low
Bar border is red if close < prev.close, green if close >= prev.close
Other notes:
The diagram requires at least 200 bars in the chart to render. Please select the symbol and time-frame that contain at least 200 bars.
The diagram requires a live market to render the flow. To check flows on historical bars, set the option from settings.
Desired indices could be selected for countries of choice. Default settings point to futures wherever possible to have the markets live simultaneously across the countries.

Historical US Bond Yield CurvePreface: I'm just the bartender serving today's freshly blended concoction; I'd like to send a massive THANK YOU to all the coders and PineWizards for the locally-sourced ingredients. I am simply a code editor, not a code author. Many thanks to these original authors!
Source 1 (Aug 8, 2019):
Source 2 (Aug 11, 2019):
About the Indicator: The term yield curve refers to the yields of U.S. treasury bills, notes, and bonds in order from shortest to longest maturity date. The yield curve describes the shapes of the term structures of interest rates and their respective terms to maturity in years. The slope of the yield curve tells us how the bond market expects short-term interest rates to move in the future based on bond traders' expectations about economic activity and inflation. The best use of the yield curve is to get a sense of the economy's direction rather than to try to make an exact prediction. This indicator plots the U.S. yield curve as maturity (x-axis/time) vs yield (y-axis/price) in addition to historical yield curves and advanced data tickers . The visual array of historical yield curves helps investors visualize shifts in the yield curve that are useful when identifying & forecasting economic conditions. The bond market can help predict the direction of the economy which can be useful in crafting your investment strategy. An inverted 10y/2y yield curve for durations longer than 5 consecutive trading days signals an almost certain recession on the horizon. An inversion happens when short-term bonds pay better than longer-term bonds. There is Federal Reserve Board data that suggests the 10y3m may be a better predictor of recessions.
Features: Advanced dual data ticker that performs curve & important spread analysis, plus additional hover info. Advanced yield curve data labels with additional hover info. Customizable historical curves and color theme.
‼ IMPORTANT: Hover over labels/tables for advanced information. Chart asset and timeframe may affect the yield curve results; I have found consistently accurate results using BINANCE:BTCUSDT on 1d timeframe. Historical curve lookbacks will have an effect on whether the curve analysis says the curve is bull/bear steepening/flattening, so please use appropriate lookbacks.
⚠ DISCLAIMER: Not financial advice. Not a trading system. DYOR. I am not affiliated with the original authors, TradingView, Binance, or the Federal Reserve Board.
About the Editor: I am a former FINRA Registered Representative, inventor/patent holder, futures trader, and hobby PineScripter.