Volatility Compression Breakout - LeafAlgo Pro StrategyThe Volatility Compression Breakout strategy is designed to identify periods of low volatility followed by potential breakout opportunities in the market. It aims to capture moments when the price consolidates within a narrow range, indicating a decrease in volatility, and anticipates a subsequent expansion in price movement. This strategy is based on our indicator of the same name (), but differs by offering many more options for the band/channel type and trend filters in addition to implementing the ability to use this strategy with algorithmic plug-ins (see details at the bottom).
This strategy features six types of bands/channels and five types of trend filters, for a total of 30 combinations. The six band/channel types are the Adaptive Gaussian MA channel (based on the Adaptive Gaussian MA that we previously published ()), standard Bollinger Bands, smoothed Bollinger Bands (basis is an EMA of the typical Bollinger Basis), Keltner Channels, a Quadratic Regression Channel (based on the channel that we previously published in the LeafAlgo Pro indicator ()), and Volatility-Based Mean Reversion Bands (). The five trend filters include an EMA, SMA, Weighted MA, McGinley Dynamic, and the Adaptive Gaussian MA itself.
Examples of the different band/channel types (all with EMA as the trend filter):
Adaptive Gaussian MA Channel:
Bollinger Bands:
Smoothed Bollinger Bands:
Keltner Channels:
Quadratic Regression Channel:
Volatility-Based Mean Reversion Bands:
Examples of the different trend filters (all with Keltner Channels):
EMA:
SMA:
WMA:
McGinley Dynamic:
Adaptive Gaussian MA:
How the Long/Short Entry Signals are Calculated:
A breakout signal upwards, accompanied by a long entry, is created when the high is greater than the secondary upper band (the upper band plus a standard deviation or with a multiplier, depending on which band/channel type is selected), the latest close is above the trend filter line, and the previous close was below the trend filter line. A break downwards, accompanied by a short entry, is created when the low is below the secondary lower band, the close is below the trend filter line, and the previous close was above the trend filter line. These conditions, along with a confirmed barstate, make up the strategy entry signals.
Coloration:
When the close price is above both the middle/basis and the trend filter, the bars are colored lime green, indicating a potential bullish market sentiment. When the close price is positioned above the basis but below the trend filter, or below the basis but above the trend filter, the bars are colored yellow, signifying a neutral or indecisive market condition. Conversely, when the close price falls below both the basis and the trend filter, the bars are colored fuchsia, suggesting a potential bearish market sentiment. Additionally, the coloration of the middle/basis line and the trend filter provides further visual cues for assessing the trend. When the close price is above the basis, the line is colored lime green, indicating a bullish trend. Conversely, when the close price is below the basis, the line is colored fuchsia, highlighting a bearish trend. Similarly, the trend line is colored lime green when the close price is above it, representing a bullish trend, and fuchsia when the close price is below it, indicating a bearish trend. The fill between the primary and secondary upper bands is colored lime and the fill between the primary and secondary lower bands is colored fuchsia. These colorations can be toggled on/off in the strategy settings menu.
How Changing Parameters Can Be Beneficial:
Modifying the parameters allows you to adapt the indicator to different market conditions and trading styles. For example, with Keltner Channels, increasing the compression period can help identify broader volatility patterns and major market shifts. On the other hand, decreasing the compression period provides more precise and timely signals for short-term traders. Adjusting the compression multiplier affects the width of the Keltner Channels. Higher multipliers increase the breakout threshold, filtering out smaller price movements and providing more reliable signals during significant market shifts. Lower multipliers make the indicator more sensitive to smaller price ranges, generating more frequent but potentially less reliable signals.
Changing the type of trend filter can drastically change your results. Test out each trend filter type and determine which one will work best for your purposes. Further, the MA periods in the trend filter settings can help you align your trades with the prevailing market direction. Increasing the period smoothes out the trend, filtering out shorter-term fluctuations and focusing on more sustained moves. Decreasing the period allows for quicker responses to changes in trend, capturing shorter-term price swings.
By adjusting the parameters and incorporating additional analysis techniques, you can customize the strategy to suit your trading style and preferences. However, it is crucial to exercise caution, conduct thorough analysis, and practice proper risk management to increase the likelihood of successful trades. Remember that no strategy can guarantee profits, and continuous learning and adaptation are key to long-term trading success.
Take Profit/Stop Loss Settings:
Take profit, stop loss, and trailing percentages are also included, found at the bottom of the Input tab under “TT and TTP” as well as “Stop Loss”. The take profit and stop loss levels will be reflected as green and red lines respectively on the chart as they occur. Make sure to understand the TP/SL ratio that you desire before use, as the desired hit rate/profitability percentage will be affected accordingly. The option for adding in a trailing stop has also been included, with options to choose between an ATR-based trail or a percentage-based trail. This strategy does NOT guarantee future returns. Apply caution in trading regardless of discretionary or algorithmic. Understand the concepts of risk/reward and the intricacies of each strategy choice before utilizing them in your personal trading.
Profitview/Pineconnector Settings:
If you wish to utilize Profitview’s automation system, find the included “Profitview Settings” under the Input tab of the strategy settings menu. If not, skip this section entirely as it can be left blank. Options will be “OPEN LONG TITLE”, “OPEN SHORT TITLE”, “CLOSE LONG TITLE”, and “CLOSE SHORT TITLE”. If you wished to trade SOL, for example, you would put “SOL LONG”, “SOL SHORT”, “SOL CLOSE LONG”, and “SOL CLOSE SHORT” in these areas. Within your Profitview extension, ensure that your Alerts all match these titles. To set an alert for use with Profitview, go to the “Alerts” tab in TradingView, then create an alert. Make sure that your desired asset and timeframe are currently displayed on your screen when creating the alert. Under the “Condition” option of the alert, select the strategy, then select the expiration time. If using TradingView Premium, this can be open-ended. Otherwise, select your desired expiration time and date. This can be updated whenever desired to ensure the strategy does not expire. Under “Alert actions”, nothing necessarily needs to be selected unless so desired. Leave the “Alert name” option empty. For the “Message”, delete the generated message and replace it with {{strategy.order.alert_message}} and nothing else. If using Pineconnector, follow the same directions for setting up an alert, but use the ",buy,,risk=" syntax as noted in the tooltips.
Additional Sample Settings (for ETHUSDT-Binance 45M):
Band/Channel Type - Keltner Channels (Compression Period of 20, Multiplier of 1.8x)
Trend Filter - WMA (50 length, no offset, close as the source)
TP/SL - 3.0% TP / 2.0% SL, 0.005 trailed TP, no trailed SL
Breakout!

Premium Volatility Breakout Strategy [wbburgin]This the premium version of my Volatility Breakout strategy, which improves significantly on the original strategy (publicly available on my profile). Improvements are below. A note about any of my premium scripts: I will continue updating and improving the original (public) versions.
This strategy is not built for any specific asset or timeframe, and has been backtested on crypto, equities, and forex from 1min - 1day. However, I recommend using it on more volatile assets because it is a breakout strategy.
********** My Background
I am an investor, trader, and entrepreneur with 10 years of cryptocurrency and equity trading experience and founder of two fintech startups. I am a graduate of a prestigious university in the United States and carry broad and inclusive interests in mathematical finance, computer science, machine learning / artificial intelligence, as well as other fields.
**********
Improvements over the original Volatility Breakout strategy include:
Faster Trend Detection → The Premium Volatility Breakout strategy will catch trends faster by using adaptive volatility-weighted bands instead of standard-width volatility-weighted bands. This can improve win size and has performed well in my backtesting.
ADX Filter → False breakouts dampen the overall results of the original script, as well as the % profitable,so an ADX filter has been programmed into the script (toggle on/off in settings). This filter will only enter long and short trades when the ADX is above a certain threshold. This is by default toggled off because in most instances it will not be necessary, but in certain environments may be useful.
MA Configuration → Different types of moving averages and weights are now configurable in the settings. These can change the responsiveness of the strategy.
External Trend Filter → I use this strategy as a filter for some of my low-timeframe algorithms. I have added an external trend filter (a plot only displayed in the data window) that will return “1” when the trend is long and “-1” when the trend is short (displayed on-chart with red and green trend curves).
Customizable Alert Messages In-Strategy → In the settings, there will be text boxes where you can create your own alerts. All you will need to do is create an alert in the alert panel on TradingView and leave the message box blank - if you fill out the alert boxes in the settings, these will automatically populate into your alerts. There are in total four different customizable alerts messages: Entry and Exit alerts for both Long and Short sides. If you disable stop loss and/or take profit, these alerts will also be disabled. Similarly, if you disable shorts, all short alerts will be disabled.
About stop losses: This strategy does not come with a stop loss because the moving average acts as a stop loss / trade exit for both long and short entries.
**********
Display
You can turn off highlighting or barcolor in the settings. Additionally, future updates may include a color scheme for users using a light-themed window.
**********
Configuring Alerts
In TradingView desktop, go to the ‘Alerts’ tab on the right panel. Click the “+” button to create a new alert. Select this strategy for the condition and one of the two options that includes alert() function calls. Name the alert what you wish and clear the default message, because your text in the settings will replace this message.
Now that the alert is configured, you can go to the settings of the strategy and fill in your chosen text for the specific alert condition. You will need to check “Long and Short” in the “Trade Direction” setting in order for any Short Alerts to become active.
**********
Disclaimer
Copyright by wbburgin.
The information contained in my Scripts/Indicators/Algorithms does not constitute financial advice or a solicitation to buy or sell any securities of any type. I will not accept liability for any loss or damage, including without limitation any loss of profit, which may arise directly or indirectly from the use of or reliance on such information.
All investments involve risk, and the past performance of a security, industry, sector, market, financial product, trading strategy, backtest, or individual's trading does not guarantee future results or returns. Investors are fully responsible for any investment decisions they make. Such decisions should be based solely on an evaluation of their financial circumstances, investment objectives, risk tolerance, and liquidity needs.

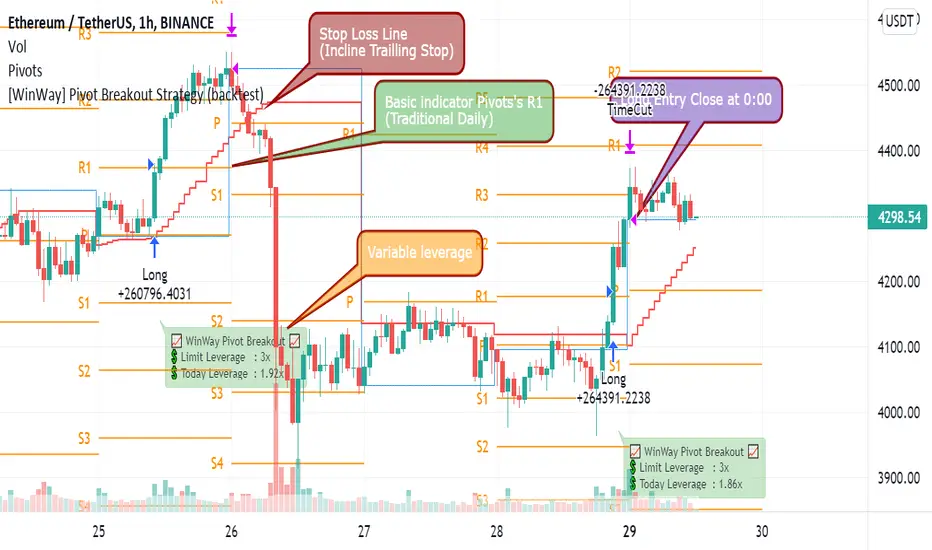
[WinWay] Pivot Breakout Strategy (backtest)This is the Winway's Pivot breaktout,
Using the Pivot point , we made a new volatility breakout strategy.
It's the strategy for ETH / BTC.
Please choose 1H time frame.
No repaint.
"As a long-only day trend strategy, we pursue profits in the downward / transverse / rising market."
- It will be exited based on the closing price of the day as a strategy to take only the day trend.
- It's a long-only strategy without short trade.
- It has high market adaptability in response to market volatility .
"The efficiency has been increased by delicate control of entry volume ."
- Control losses by managing funds in line with market changes.
- Calculate the leverage on the real time automatically.
- It goes in more when it's advantageous and less when it's disadvantageous
- It's a welfare strategy that works against assets
"We further lowered the risk by cutting off in installments."
- If you judge that the trend has declined on the day, you will break off and respond to a sharp drop by using the real time trailing stop.
========================================================================================
윈웨이의 피봇돌파입니다.
피봇 포인트를 이용한 새로운 변동성 돌파 전략입니다.
이더리움과 비트코인을 위한 전략이며
1H 타임프레임으로 선택해주세요
리페인트는 발생하지 않습니다.
롱 온리 당일 추세 전략으로 하락/횡보/상승 장에서 수익을 추구합니다.
- 당일 추세만 취하는 전략으로 일봉 종가 기준 청산됩니다.
- 숏은 없는 롱 온리 전략입니다.
- 시장 변동성에 따라 대응하여 시장 적응력이 높습니다.섬세한 진입 물량 제어로 효율을 높였습니다.
- 시장 변화에 맞춰 자금관리를 하여 손실을 제어합니다.
- 당일 레버리지를 실시간으로 자동 계산합니다.
- 유리할때 더 들어가고, 불리할때 적게 들어갑니다.
- 자산대비로 작동하는 복리 전략입니다.
손절로 리스크를 더욱 낮췄습니다.
- 당일 추세가 꺾였다고 판단하면 손절하여, 실시간 트레일링 스탑을 이용하여 급락에 대응합니다.
Bollinger Bands - Breakout StrategyThe Bollinger Bands - Breakout Strategy is a trend-following optimized for short-term trading in the crypto market. This strategy employs the Bollinger Bands, a widely recognized technical indicator, as its primary instrument for pinpointing potential trades. It is capable of executing both long and short positions, depending on whether the market is in a spot or futures, and is particularly effective in trending markets.
The strategy boasts a high degree of configurability, allowing users to set the Bollinger Bands period and deviation, trend filter, volatility filter, trade direction filter, rate of change filter, and date filter. Furthermore, it offers options for Take Profit, Stop Loss, and Trailing Stop for both long and short positions, ensuring a comprehensive risk management approach. The inclusion of a maximum intraday loss feature adds another layer of protection, making this strategy a valuable tool for traders seeking a professional and adaptable trading system.
Name : Bollinger Bands - Breakout Strategy
Category : Trend Follower based on Bollinger Bands
Operating mode : Long and Short on Futures or Long on Spot
Trade duration : Intraday
Timeframe : 2H, 3H, 4H, 5H
Market : Crypto
Suggested usage : Trending Markets
Entry : When the price crosses above or below the Bollinger Bands
Exit : Opposite Cross or Profit target, Trailing stop or Stop loss
Configuration :
- Bollinger Bands period and deviation
- Trend Filter
- Volatility Filter
- Trade direction filter
- Rate of Change filter
- Date Filter (for backtesting purposes)
- Take Profit, Stop Loss and Trailing Stop for long and short positions
- Risk Management: Max Intraday Loss
Backtesting :
⁃ Exchange: BINANCE
⁃ Pair: BTCUSDT.P
⁃ Timeframe: 4H
⁃ Fee: 0.025%
⁃ Slippage: 1
- Initial Capital: 10000 USDT
- Position sizing: 10% of Equity
- Start : 2019-09-19 (Out Of Sample from 2022-12-23)
- Bar magnifier: on
Credits :
- LucF of Pine Coders for f_security function to avoid repainting using security.
- QuantNomad for Monthly Table.
Disclaimer : Risk Management is crucial, so adjust stop loss to your comfort level. A tight stop loss can help minimise potential losses. Use at your own risk.
How you or we can improve? Source code is open so share your ideas!
Leave a comment and smash the boost button!
Thanks for your attention, happy to support the TradingView community.

Volatility Range Breakout Strategy [wbburgin]The "Volatility Range Breakout Strategy" uses deviations of high-low volatility to determine bullish and bearish breakouts.
HOW IT WORKS
The volatility function uses the high-low range of a lookback period, divided by the average of that range, to determine the likelihood that price will break in a specific direction.
High and low ranges are determined by the relative volatility compared to the current closing price. The high range, for example, is the (volatility * close) added to the close, the low range is this value subtracted by the close.
A volatility-weighted moving average is taken of these high and low ranges to form high and low bands.
Finally, breakouts are identified once the price closes above or below these bands. An upwards breakout (bullish) occurs when the price breaks above the upper band, while a downwards breakout (bearish) occurs when the price breaks below the lower band. Positions can be closed either by when the price falls out of its current band ("Range Crossover" in settings under 'Exit Type') or when the price falls below or above the volatility MA (default because this allows us to catch trends for longer).
INPUTS/SETTINGS
The AVERAGE LENGTH is the period for the volatility MA and the weighted volatility bands.
The VOLATILITY LENGTH is how far the lookback should be for highs/lows for the volatility calculation.
Enjoy! Let me know if you have any questions.

Yesterday’s High Breakout - Trend Following StrategyYesterday’s High Breakout it is a trading system based on the analysis of yesterday's highs, it works in trend-following mode therefore it opens a long position at the breakout of yesterday's highs even if they occur several times in one day.
There are several methods for exiting a trade, each with its own unique strategy. The first method involves setting Take-Profit and Stop-Loss percentages, while the second utilizes a trailing-stop with a specified offset value. The third method calls for a conditional exit when the candle closes below a reference EMA.
Additionally, operational filters can be applied based on the volatility of the currency pair, such as calculating the percentage change from the opening or incorporating a gap to the previous day's high levels. These filters help to anticipate or delay entry into the market, mitigating the risk of false breakouts.
In the specific case of NULS, a 9% Take-Profit and a 3% Stop-Loss were set, with an activated trailing-stop percentage. To postpone entry and avoid false breakouts, a 1% gap was added to the price of yesterday's highs.
Name : Yesterday's High Breakout - Trend Follower Strategy
Author : @tumiza999
Category : Trend Follower, Breakout of Yesterday's High.
Operating mode : Spot or Futures (only long).
Trade duration : Intraday.
Timeframe : 30M, 1H, 2H, 4H
Market : Crypto
Suggested usage : Short-term trading, when the market is in trend and it is showing high volatility.
Entry : When there is a breakout of Yesterday's High.
Exit : Profit target or Trailing stop, Stop loss or Crossunder EMA.
Configuration :
- Gap to anticipate or postpone the entry before or after the identified level
- Rate of Change for Entry Condition
- Take Profit, Stop Loss and Trailing Stop
- EMA length
Backtesting :
⁃ Exchange: BINANCE
⁃ Pair: NULSUSDT
⁃ Timeframe: 2H
⁃ Fee: 0.075%
⁃ Slippage: 1
- Initial Capital: 10000 USDT
- Position sizing: 10% of Equity
- Start : 2018-07-26 (Out Of Sample from 2022-12-23)
- Bar magnifier: on
Credits : LucF for Pine Coders (f_security function to avoid repainting using security)
Disclaimer : Risk Management is crucial, so adjust stop loss to your comfort level. A tight stop loss can help minimise potential losses. Use at your own risk.
How you or we can improve? Source code is open so share your ideas!
Leave a comment and smash the boost button!
Thanks for your attention, happy to support the TradingView community.

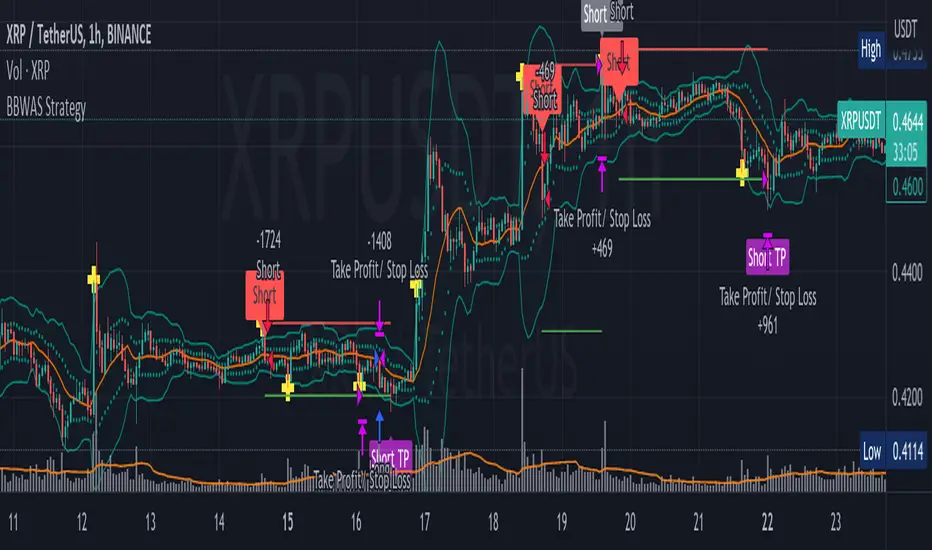
BBWAS StrategyA breakout in trading refers to a situation where the price of a security or asset moves beyond a defined level of support or resistance, which is typically indicated by technical analysis tools like Bollinger Bands . Bollinger Bands consist of three lines: the upper band, the lower band, and the middle band (or basis). The upper and lower bands are set at a specified number of standard deviations away from the middle band, and they help to define the range within which the price of an asset is expected to fluctuate.
When the price of the asset moves beyond the upper or lower band, it is said to have "broken out" of the range. If the price closes below the lower band, it is considered a bearish breakout, and if it closes above the upper band, it is considered a bullish breakout.
Once a breakout occurs, traders may look for a confirmation signal before entering a trade. In this case, crossing the middle line (or basis) after a breakout may signal a potential trend reversal and a good opportunity to enter a long or short trade, depending on the direction of the breakout.
Overall, this script provides a customizable and flexible system for traders to use Bollinger Bands to identify breakout trades, with additional features to incorporate volume and RSI divergence. The dynamic TPSL system also allows traders to manage their risk and reward by automatically setting take-profit and stop-loss levels based on the volatility of the market.
Dear traders, while we strive to provide you with the best trading tools and resources, we want to remind you to exercise caution and diligence in your investing decisions.
It is important to always do your own research and analysis before making any trades. Remember, the responsibility for your investments ultimately lies with you.
Happy trading!
Open DriveOpen Drive is a market profile concept introduced by Jim Dalton. It occurs when the price moves directionally and persistently for the first 30 minutes from the cash market open.
It is necessary to use 30-minute bars as there needs to be enough time to measure an extreme move of the cash open. This means there will be fewer trades than other strategies using faster time periodicities.
The script finds open drives from these time points 0700/ 0800 and 1300/1430.
The entry signal also has a breakout threshold using the 5-bar high and 5-bar low to only take trades moving away from the prior 5-bar range. This weeds out most mid-range trades and small range expansion bars.
If the price has had a strong move from the open and has broken either below the prior 5-bar low or above the prior 5-bar high by an amount equal to the prior 5-bar range a trade is entered in the direction of the move.
The Exit criteria; exit after 3 bars which is 90mins when using a 30min periodicity.
Note, this script is shared to show that momentum generated on or around the cash open tends to persist. The entry and exits of this strategy are quite naive but there are plenty of ways to take more aggressive entries on faster time frames when an open drive occurs. The times chosen for this strategy will suit stock index futures mainly. The user can experiment with other futures products and their corresponding pit/ cash open hours.
Google "open drive market profile" for more information on open drives and market profile concepts.
Happy trading!

[-_-] Level Breakout, Auto Backtesting StrategyDescription:
A Long only strategy based on breakout from a certain level formed by High price. It has auto-backtesting capabilities (you set ranges for the three main parameters: Lookback, TP and SL; the strategy then goes through different combinations of those parameters and displays a table with results that you can sort by Percentage of profitable trades AND/OR Net profit AND/OR Number of trades). So you can, for example, sort only by Net profit to find combination of parameters that gives highest net profit, or sort by Net profit and Percentage profitable to find a combination of parameters that gives the best balance between profitability and profit. The auto-backtesting also takes into account the commission which is set in % in the inputs (make sure to set the same value in properties of the strategy so that auto-backtesting and real backtesting results match).
NOTE: auto-backtesting only find the best combinations and displays them in a table, you will then need to manually set the Lookback, TP and SL inputs for real backtesting to match.
Parameters:
- Lookback -> # of bars for filtering signals; recommended range from 2 to 5
- TP (%) -> take profit; recommended range from 5 to 10
- SL (%) -> stop loss; recommended range from 1 to 5
- Commission (%) -> commission per trade
- Min/Max Lookback -> lookback range for auto-backtesting
- Min/Max TP -> take profit range for auto-backtesting
- Min/Max SL -> stop loss range for auto-backtesting
- Percentage profitable -> sort by percentage of profitable trades
- Net profit -> sort by net profit
- Number of trades -> sort by number of trades

SUPPORT RESISTANCE STRATEGY [5MIN TF]A SUPPORT RESISTANCE BREAKOUT STRATEGY for 5 minute Time-Frame , that has the time condition for Indian Markets
The Timing can be changed to fit other markets, scroll down to "TIME CONDITION" to know more.
The commission is also included in the strategy .
The basic idea is when ,
1) Price crosses above Resistance Level ,indicated by Red Line, is a Long condition.
2) Price crosses below Support Level ,indicated by Green Line , is a Short condition.
3) Candle high crosses above ema1, is a part of the Long condition .
4) Candle low crosses below ema1, is a part of the Short condition .
5) Volume Threshold is an added confirmation for long/short positions.
6) Maximum Risk per trade for the intraday trade can be changed .
7) Default qty size is set to 50 contracts , which can be changed under settings → properties → order size.
8) ATR is used for trailing after entry, as mentioned in the inputs below.
// ═════════════════════════//
// ————————> INPUTS <————————— //
// ═════════════════════════//
→ L_Bars ———————————> Length of Resistance / Support Levels.
→ R_Bars ———————————> Length of Resistance / Support Levels.
→ Volume Break ———————> Volume Breakout from range to confirm Long/Short position.
→ Price Cross Ema —————> Added condition as explained above (3) and (4).
→ ATR LONG —————————> ATR stoploss trail for Long positions.
→ ATR SHORT ————————> ATR stoploss trail for Short positions.
→ RISK ————————————> Maximum Risk per trade intraday.
The strategy was back-tested on TCS ,the input values and the results are mentioned under "BACKTEST RESULTS" below.
// ═════════════════════════ //
// ————————> PROPERTIES<——————— //
// ═════════════════════════ //
Default_qty_size ————> 50 contracts , which can be changed under
Settings
↓
Properties
↓
Order size
// ═══════════════════════════════//
// ————————> TIME CONDITION <————————— //
// ═══════════════════════════════//
The time can be changed in the script , Add it → click on ' { } ' → Pine editor→ making it a copy [right top corner} → Edit the line 27.
The Indian Markets open at 9:15am and closes at 3:30pm.
The 'time_cond' specifies the time at which Entries should happen .
"Close All" function closes all the trades at 3pm , at the open of the next candle.
To change the time to close all trades , Go to Pine Editor → Edit the line 92 .
All open trades get closed at 3pm , because some brokers don't allow you to place fresh intraday orders after 3pm .
// ═══════════════════════════════════════════════ //
// ————————> BACKTEST RESULTS ( 100 CLOSED TRADES )<————————— //
// ═══════════════════════════════════════════════ //
INPUTS can be changed for better Back-Test results.
The strategy applied to NSE:TCS ( 5 min Time-Frame and contract size 50) gives us 60% profitability , as shown below
It was tested for a period a 6 months with a Profit Factor of 1.8 ,net Profit of 30,000 Rs profit .
Sharpe Ratio : 0.49
Sortino Ratio : 1.4
The graph has a Linear Curve with Consistent Profits.
The INPUTS are as follows,
1) L_Bars —————————> 4
2) R_Bars —————————> 4
3) Volume Break ————> 5
4) Price Cross Ema ——> 100
5) ATR LONG ——————> 2.4
6) ATR SHORT —————> 2.6
7) RISK —————————> 2000
8) Default qty size ——> 50
NSE:TCS
Save it to favorites.
Apply it to your charts Now !!
Thank You ☺ NSE:TCS

PIVOT STRATEGY [INDIAN MARKET TIMING]
A Back-tested Profitable Strategy for Free!!
A PIVOT INTRADAY STRATEGY for 5 minute Time-Frame , that also explains the time condition for Indian Markets
The Timing can be changed to fit other markets, scroll down to "TIME CONDITION" to know more.
The commission is also included in the strategy .
The basic idea is when ,
1) Price crosses above ema1 ,indicated by pivot highest line in green color .
2) Price crosses below ema1 ,indicated by pivot lowest line in red color .
3) Candle high crosses above pivot highest , is the Long condition .
4) Candle low crosses below pivot lowest , is the Short condition .
5) Maximum Risk per trade for the intraday trade can be changed .
6) Default_qty_size is set to 60 contracts , which can be changed under settings → properties → order size .
7) ATR is used for trailing after entry, as mentioned in the inputs below.
// ═════════════════════════//
// ————————> INPUTS <————————— //
// ═════════════════════════//
Leftbars —————> Length of pivot highs and lows
Rightbars —————> Length of pivot highs and lows
Price Cross Ema —————> Added condition
ATR LONG —————> ATR stoploss trail for Long positions
ATR SHORT —————> ATR stoploss trail for Short positions
RISK —————> Maximum Risk per trade for the day
The strategy was back-tested on RELIANCE ,the input values and the results are mentioned under "BACKTEST RESULTS" below .
// ═════════════════════════ //
// ————————> PROPERTIES<——————— //
// ═════════════════════════ //
Default_qty_size ————> 60 contracts , which can be changed under settings
↓
properties
↓
order size
// ═══════════════════════════════//
// ————————> TIME CONDITION <————————— //
// ═══════════════════════════════//
The time can be changed in the script , Add it → click on ' { } ' → Pine editor→ making it a copy [right top corner} → Edit the line 25 .
The Indian Markets open at 9:15am and closes at 3:30pm .
The 'time_cond' specifies the time at which Entries should happen .
"Close All" function closes all the trades at 3pm, at the open of the next candle.
To change the time to close all trades , Go to Pine Editor → Edit the line 103 .
All open trades get closed at 3pm , because some brokers don't allow you to place fresh intraday orders after 3pm .
NSE:RELIANCE
// ═══════════════════════════════════════════════ //
// ————————> BACKTEST RESULTS ( 128 CLOSED TRADES )<————————— //
// ═══════════════════════════════════════════════ //
INPUTS can be changed for better back-test results.
The strategy applied to NIFTY ( 5 min Time-Frame and contract size 60 ) gives us 60% profitability y , as shown below
It was tested for a period a 6 months with a Profit Factor of 1.45 ,net Profit of 21,500Rs profit .
Sharpe Ratio : 0.311
Sortino Ratio : 0.727
The graph has a Linear Curve with consistent profits .
The INPUTS are as follows,
1) Leftbars ————————> 3
2) Rightbars ————————> 5
3) Price Cross Ema ——————> 150
4) ATR LONG ————————> 2.7
5) ATR SHORT ———————> 2.9
6) RISK —————————> 2500
7) Default qty size ——————> 60
NSE:RELIANCE
Save it to favorites.
Apply it to your charts Now !!
↓
FOLLOW US FOR MORE !
Thank me later ;)

TTP Kent Strat PROKent Strat PRO trades breakouts using Bollinger Bands together with SuperTrend.
PRO features:
- 3commas bot alerts for long/short bots
- Custom JSON bots alerts
Features:
- Risk/reward ratio parameter
- Longs, shorts and combined positions.
- Breakout settings
- Trailing SL, trailing TP
- Use of latest candles to place the SL using a lookback parameter (how many candles to look back for a low/high price)
- Select your SL between the ATR trendline and the latest candle: the closest or furthest away value
- Show the trendline
- Backtest mode for accurate backtests
- Signal mode for live price accurate signals
- Date range backtesting
Filters:
- EMA 200 filter and timeframe selector. This filter can be used to trade with the trend: open longs on an uptrend and shorts on a downtrend.
- ADX filter using threshold. This filter can be used to filter entries where the trend is not very strong.
- ADX pointing up. ADX values pointing up and above certain threshold can improve entries.
- Relative volume filter based on the volume being X% above the MA of the Volume. Trading with volume can help filtering out bad trades.
Example setup:
1) pick BINANCE:ETHUSDT chart, 15 min chart
2) trade longs + shorts
3) pick ratio 3
4) trailing SL checked
5) trailing TP unchecked
7) stop loss "furthest"
8) candle loopback 30
9) BB period 21, dev 1, ATR filter on, atr period 5
10) EMA filter on, 15 min
11) ADX off
12) Volume filter on set to 60%

Consolidation Breakout [Indian Market Timing]OK let's get started ,
A Day Trading (Intraday) Consolidation Breakout Indication Strategy that explains time condition for Indian Markets .
The commission is also included in the strategy .
The basic idea is ,
1) Price crosses above upper band , indicated by a color change (green) is the Long condition .
2) Price crosses below lower band , indicated by a color change (red) is the Short condition .
3) ATR is used for trailing after entry
// ═══════════════════════════════//
// ————————> TIME CONDITION <————————— //
// ═══════════════════════════════//
The Indian Markets open at 9:15am and closes at 3:30pm.
The time_condition specifies the time at which Entries should happen .
"Close All" function closes all the trades at 2:57pm.
All open trades get closed at 2:57pm , because some brokers dont allow you to place fresh intraday orders after 3pm.
NSE:NIFTY1!
// ═══════════════════════════════════════════════ //
// ————————> BACKTEST RESULTS ( 114 CLOSED TRADES )<————————— //
// ═══════════════════════════════════════════════ //
LENGTH , MULT (factor) and ATR can be changed for better backtest results.
The strategy applied to NIFTY (3 min Time-Frame and contract size 5) gives us 60% profitability , as shown below
It was tested for a period a 8 months with a Profit Factor of 2.2 , avg Trade of 6000Rs profit and Sharpe Ratio : 0.67
The graph has a Linear Curve with consistent profits.
NSE:NIFTY1!
Save it favorites.
Apply it to your charts Now !!
Thank me later ;)

Squeeze Momentum Strategy [LazyBear] Buy Sell TP SL Alerts-Modified version of Squeeze Momentum Indicator by @LazyBear.
-Converted to version 5,
-Taken inspiration from @KivancOzbilgic for its buy sell calculations,
-Used @Bunghole strategy template with Take Profit, Stop Loss and Enable/Disable Toggles
-Added Custom Date Backtesting Module
------------------------------------------------------------------------------------------------------------------------
All credit goes to above
Problem with original version:
The original Squeeze Momentum Strategy did not have buy sell signals and there was alot of confusion as to when to enter and exit.
There was no proper strategy that would allow backtesting on which further analysis could be carried out.
There are 3 aspects this strategy:
1 ) Strategy Logic (easily toggleable from the dropdown menu from strategy settings)
- LazyBear (I have made this simple by using Kivanc technique of Momentums Moving Average Crossover, BUY when MA cross above signal line, SELL when crossdown signal line)
- Zero Crossover Line (BUY signal when crossover zero line, and SELL crossdown zero line)
2) Long Short TP and SL
- In strategies there is usually only 1 SL and 1 TP, and it is assumed that if a 2% SL giving a good profit %, then it would be best for both long and short. However this is not the case for many. Many markets/pairs, go down with much more speed then they go up with. Hence once we have a profitable backtesting setting, then we should start optimizing Long and Short SL's seperately. Once that is done, we should start optimizing for Long and Short TP's separately, starting with Longs first in both cases.
3) Enable and Disable Toggles of Long and Short Trades
- Many markets dont allow short trades, or are not suitable for short trades. In this case it would be much more feasible to disable "Short" Trading and see results of Long Only as a built in graphic view of backtestor provides a more easy to understand data feed as compared to the performance summary in which you have to review long and short profitability separately.
4) Custom Data Backtesting
- One of most crucial aspects while optimizing for backtesting is to check a strategies performance on uptrends, downtrend and sideways markets seperately as to understand the weak points of strategy.
- Once you enable custom date backtesting, you will see lines on the chart which can be dragged left right based on where you want to start and end the backtesting from and to.
Note:
- Not a financial advise
- Open to feedback, questions, improvements, errors etc.
- More info on how the squeeze momentum works visit LazyBear indicator link:
Happy Trading!
Cheers
M Tahreem Alam @mtahreemalam

[Pt] Premarket Breakout StrategyThis is a 1 trade per day strategy for trading SPY or QQQ index. By default, this is designed for 1 min time frame. This was an experimental script that seems to be profitable at the time of publication.
How it works:
Pre-market high and low is defined per trading day between 9:00 to 9:30 EST.
Then we looking for the first breakout on either PM high or PM low.
- Breakout high = long trade
- Breakout low = short trade
If long trade, we wait until Stochastic RSI D signal line to hit a lower threshold (18 by default). Then we enter long when K crosses above D line.
If short trade, we wait until Stochastic RSI D signal line to hit an upper threshold (82 by default). Then we enter short when K crosses below D line.
Stop loss for long
- set to PM low if entry is above PM high + %ATR buffer
- or set to PM range + %ATR buffer
Stop loss for short
- set to PM high if entry is below PM low + %ATR buffer
- or set to PM range + %ATR buffer
Profit target is set to 2x the risk by default.
*Note: Different Stochastic RSI lengths should be used if trading 5 min time frame. See tooltip.
Happy trading~~!

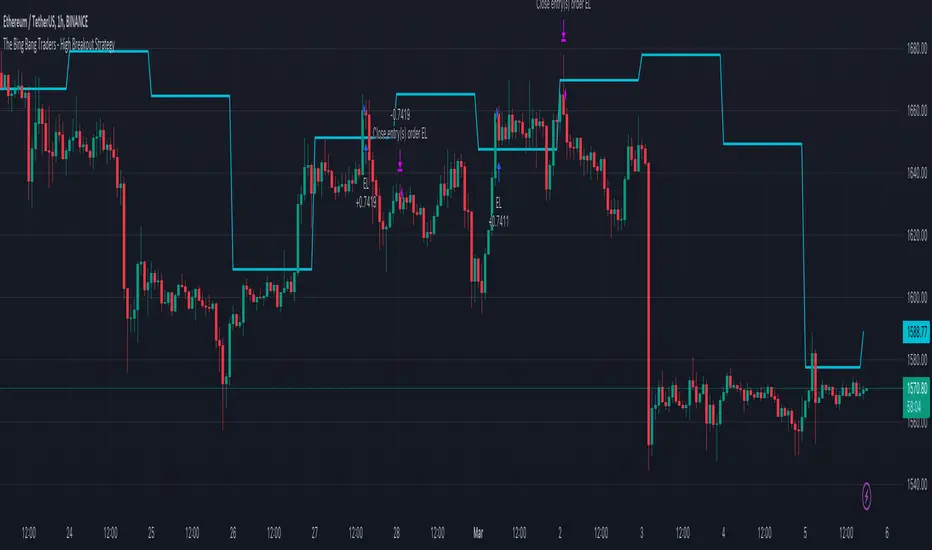
TheBigBangTraders BreakoutName: TheBigBangTraders Breakout
Category: Trend Follower
Operating mode: Spot
Trades duration: Intraday
Timeframe: 1H
Suggested usage: the purpose of this strategy is to help to investigate if the asset is sensitive to breakout approach.
Entry: Trigger point can be choose by the user between:
High of the N days ago
High of the N weeks ago
Exit: End of Day
Usage:
⁃ It can be useful to use this script to test the behaviour of a definite asset
⁃ This is a raw system that can be considered a base to realize a complete breakout strategy
Configuration:
- N/A
Backtesting
⁃ Exchange: BINANCE
⁃ Pair: ETHUSDT
⁃ Timeframe: !H
⁃ Fee 0.075%
⁃ Slippage 0
- Start : 2020-01-03
How you or we can improve? Source code is open so share your ideas!
Price action: Trendline Break StrategyThis strategy use trendline to entry. Trendline be drawed from Pivots High/Low.
Entry Long: When price break up trendline.
Entry Short: When price break down trendline.
Risk:Reward setup is 1:1.
You can backtest with whichever pair and whichever timeframe.
I backtested:
- If scalping: should use timeframe 5m, set up SL, TP is 2%.
- If swing trade: should use timeframe 1H, set up SL 2%, TP is 3%.
Should use with other indicator to increase winrate.

Inside Breakout PerQuantumCoin Premium Indicator (strategy)HOW IT WORKS:
- The Inside Breakout gives signals on the chart on the breakout of inside bar chart pattern;
- It allows to trade trend or counter-trend signals;
- Computes intrinsic values to access the strength of the Buy/Sell signal;
- Allows users to adjust their own settings, adapting the signals produced;
- These signals can be also set up as Alerts;
- The indicator has a few custom features that allows users to filter out signals using multi-timeframe trend indicator and to keep tracking positions so that one can only get new signals when they reserve position;
This Strategy version is meant to be a companion to the main indicator in order to backtest your SLT/TP settings with different instruments and adapt results.
Please NOTE:
Results may vary depending on TP/SL settings. Also, previous performance is not a indicator for future results.

Volatility Breakout StrategyThis is a strategy used by Larry R. Williams called Volatility Breakout.
By identifying a strong uptrend that exceeds 'a certain level' on a daily basis as a breakout signal, enter long position, take advantage of long at the the next day's open.
'a certain level (Entry Price)' is calculated by { close + 'k' * high -low }, and applied logarithmic calculation.
Stop loss level is calculated by half of the previous day's Low and Entry Price.
Strategy exit always at UTC+0.
And expressed day session with the background color.
Thanks and hope this helps you.
(kor)
이건 Larry R. Williams가 사용하는 변동성 돌파 전략입니다.
특정 수준을 넘는 강한 상승세를 돌파 신호로 파악하여 매수하고, 장시간이 종료될때에 빠르게 수익을 실현하는 전략입니다.
"특정 레벨(진입가)"은 close + 'k' * high -low 로 계산되며 로그 계산을 적용했습니다.
손절 레벨은 전일 저가 및 진입 가격의 절반으로 계산됩니다.
전략은 항상 UTC+0에서 종료합니다. ( 한국 기준 오전 9시 )
그리고 배경색으로 일일세션을 표현했습니다.
트뷰에 오픈소스의 래리윌리엄스 변동성전략이 없는것 같아 간단하게나마 만들어 보았습니다. 도움이 되었으면 좋겟워요..

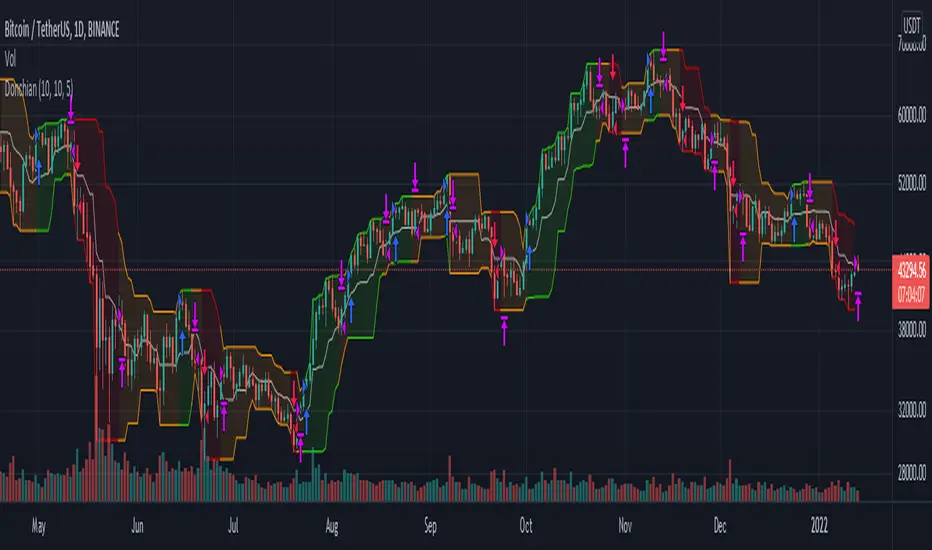
Donchian Channel Strategy IdeaThis strategy idea is a variation of the "Donchian Channel" trading strategy. It is built with a highest-high band, a lowest-low band, and a baseline which is average the highest-high and the lowest-low bands. This strategy is very useful in trending instruments on 1W and 1D timeframes. This is the implementation used in the QuantCT app.
You can set the operation mode to be Long/Short or long-only.
You also can set a fixed stop-loss or ignore it so that the strategy acts solely based on entry and exit signals.
Trade Idea
When the close price breaks up the previous highest-high, it is a long signal, the market is considered rising (bullish), and the plotted indicator becomes green. Long positions are held until the close price crosses under the baseline.
When the close price breaks down the previous lowest-low, it is a short signal, the market is considered falling (bearish), and the plotted indicator becomes red. Short positions are held until the close price crosses above the baseline.
Otherwise, if we have no position in the market, the market is considered ranging, and the plotted indicator becomes orange.
Entry/Exit rules
Enter LONG if the close price breaks up the previous highest-high (i.e. when the plotted indicator becomes green).
Exit LONG if the close price crosses under the baseline (i.e. when the plotted indicator becomes orange).
Enter SHORT if the close price breaks down the previous lowest-low (i.e. when the plotted indicator becomes red).
Exit SHORT if the close price crosses above the baseline (i.e. when the plotted indicator becomes orange).
CAUTION
It's just a bare trading idea - a profitable one. However, you can enhance this idea and turn it into a full trading strategy with enhanced risk/money management and optimizing it, and you ABSOLUTELY should do this!
DON'T insist on using Long/Short mode on all instruments! This strategy performs much better in Long-Only mode on many (NOT All) trending instruments (Like BTC, ETH, etc.).
Pivot Point BreakoutThis is a strategy taken from Perry Kaufman's book, Trading Systems and Methods.
Just like the title says, it's a breakout strategy. It works by buying when the current high is higher than the last pivot high, and selling when the low is lower than the last pivot low.
It does not have a good success probability, and relies on the good reward to risk ratio. Definitely not recommended for someone with weak hands.

Super Breakout day trading This is an intraday indicator which uses Bollinger band and volume flow and MA to alert buy and sell signal.
A user can use this indicator to help make entry and exits. This indicator wont show entry and exist of larger time frames like Day week month.
This indicator uses Bollinger bands but try to minimize it shortcoming where it will buy and keep holding and eventually sell at a loss.
By adding addition parameters around volume it check if the price has reached its peak

Classic Long Term Trend Following SystemThis is a classic long term trend following system.
The breakout period is 50 days instead of 20 and the moving average crossover are 40 and 120.
The moving averages are also exponential instead of simple.
The stoploss is 4 ATRs away from the price.
Recommendations:
Donchian Channels settings > 50 days
Moving Averages > 40 and 120, 80 and 140
Important to note:
My first strategy, DC Breakout System | This is simplicity at its finest, is best used on the crypto market and this one for stocks, commodities, currencies, etc. Those markets tend to trend a lot longer than crypto do.

Trend Following with Donchian Channels and MACDThis is a trend following system based on the Donchian Channels. Instead of using a simple moving average crossover, this system uses the MACD as the trendfilter:
Long positions:
* Price makes a new 50 day high,
* The MACD-line crosses above or is above the Signal-line.
* Both the MACD and the Signal-lines are above the zero-line.
Short positions:
* Price makes a new 50 day low,
* The MACD-line crosses below or is below the Signal-line.
* Both the MACD and the Signal-lines are below the zero-line.
Stoploss:
The initial and the trailing stoploss are 4 ATRs away from the price.
