Chaikin Momentum Scalper🎯 Overview
The Chaikin Momentum Scalper is a powerful trading strategy designed to identify momentum shifts in the market and ride the trend for maximum profits. This strategy is ideal for trading the USD/JPY currency pair on a 15-minute chart, making it perfect for high-frequency trading (HFT). Whether you’re starting with a small account of $1,000 or managing a larger portfolio, this strategy can scale to suit your needs.
________________________________________
🔑 How the Strategy Works
Here’s how the Chaikin Momentum Scalper identifies trade opportunities:
1️⃣ Momentum Detection
The core of this strategy is the Chaikin Oscillator, a tool that measures the flow of money into or out of a market. It helps us understand whether buyers (bulls) or sellers (bears) are in control.
• When the indicator crosses above zero, it signals that buying momentum is picking up – a buying opportunity.
• When the indicator crosses below zero, it signals that selling momentum is increasing – a selling opportunity.
2️⃣ Trend Confirmation
We don’t just jump into trades based on momentum alone. We also use a 200-period simple moving average (SMA) to confirm the overall trend.
• If the price is above the SMA, it confirms an uptrend, so we look for buy trades.
• If the price is below the SMA, it confirms a downtrend, so we look for sell trades.
This way, we align our trades with the broader market direction for higher success rates.
3️⃣ Volatility & Risk Management
We use a tool called the Average True Range (ATR) to measure market volatility. This helps us:
• Set a stop-loss (where we’ll exit the trade if the market moves against us) at a safe distance from our entry point.
• Set a take-profit (where we’ll lock in profits) at a target that’s larger than the stop-loss, ensuring a good reward-to-risk ratio.
This approach adapts to the market’s behavior, tightening stops in calmer conditions and widening them when volatility increases.
________________________________________
📈 Why This Strategy Works
✅ It combines momentum and trend-following principles, increasing the chances of trading in the right direction.
✅ It dynamically adjusts risk levels based on market volatility, keeping losses small and profits big.
✅ It’s scalable – perfect for both small accounts (like $1,000) and larger, corporate-sized portfolios.
✅ It has been deep-backtested on USD/JPY 15-minute charts, proving its consistency across different market conditions.
________________________________________
📝 Important Notes
📌 This strategy is best used for USD/JPY on a 15-minute chart, making it great for high-frequency trading while you continue to build and refine your trading system.
📌 It’s designed to work on both small ($1,000+) and large accounts, so it can grow with you as your capital increases.
📌 While it has passed deep backtesting on this pair and timeframe, remember that no strategy is perfect. It’s crucial to test it yourself, start with a demo account, and apply proper risk management before trading real money.
🌟 Final Thoughts
The Chaikin Momentum Scalper is a solid, adaptable trading approach combining momentum, trend direction, and volatility awareness. If you’re looking for a strategy to kick-start your trading journey—or to add to your existing system—it offers a strong foundation.
Chaikin Oscillator (CHO)

Volume Flow ConfluenceVolume Flow Confluence (CMF-KVO Integration)
Core Function:
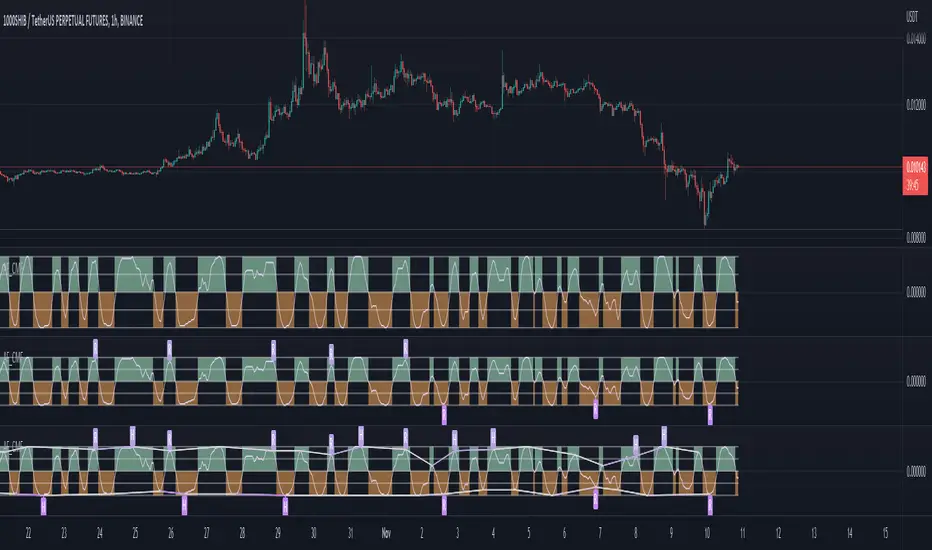
The Volume Flow Confluence Indicator combines two volume-analysis methods: Chaikin Money Flow (CMF) and the Klinger Volume Oscillator (KVO). It displays a histogram only when both indicators align in their respective signals.
Signal States:
• Green Bars: CMF is positive (> 0) and KVO is above its signal line
• Red Bars: CMF is negative (< 0) and KVO is below its signal line
• No Bars: When indicators disagree
Technical Components:
Chaikin Money Flow (CMF):
Measures the relationship between volume and price location within the trading range:
• Calculates money flow volume using close position relative to high/low range
• Aggregates and normalizes over specified period
• Default period: 20
Klinger Volume Oscillator (KVO):
Evaluates volume in relation to price movement:
• Tracks trend changes using HLC3
• Applies volume force calculation
• Uses two EMAs (34/55) with a signal line (13)
Practical Applications:
1. Signal Identification
- New colored bars after blank periods show new agreement between indicators
- Color intensity differentiates new signals from continuations
- Blank spaces indicate lack of agreement
2. Trend Analysis
- Consecutive colored bars show continued indicator agreement
- Transitions between colors or to blank spaces show changing conditions
- Can be used alongside other technical analysis tools
3. Risk Considerations
- Signals are not predictive of future price movement
- Should be used as one of multiple analysis tools
- Effectiveness may vary across different markets and timeframes
Technical Specifications:
Core Algorithm
CMF = Σ(((C - L) - (H - C))/(H - L) × V)n / Σ(V)n
KVO = EMA(VF, 34) - EMA(VF, 55)
Where VF = V × |2(dm/cm) - 1| × sign(Δhlc3)
Signal Line = EMA(KVO, 13)
Signal Logic
Long: CMF > 0 AND KVO > Signal
Short: CMF < 0 AND KVO < Signal
Neutral: All other conditions
Parameters
CMF Length = 20
KVO Fast = 34
KVO Slow = 55
KVO Signal = 13
Volume = Regular/Actual Volume
Data Requirements
Price Data: OHLC
Volume Data: Required
Minimum History: 55 bars
Recommended Timeframe: ≥ 1H
Credits:
• Marc Chaikin - Original CMF development
• Stephen Klinger - Original KVO development
• Alex Orekhov (everget) - CMF script implementation
• nj_guy72 - KVO script implementation
Vorse4**Vorse4 Indicator**
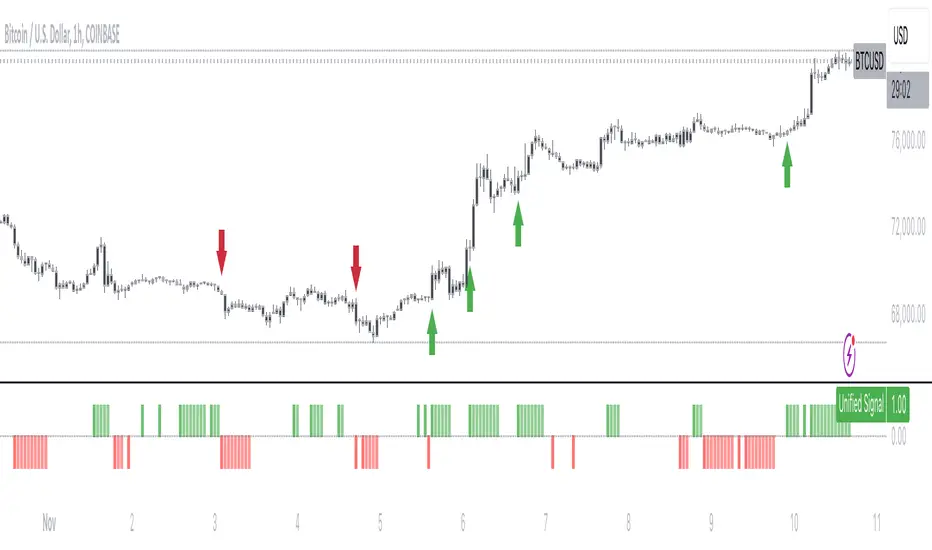
The Vorse4 Indicator is a technical analysis tool that combines Chaikin Oscillator, Intraday Momentum Index (IMI), MACD, and Parabolic SAR indicators. This indicator generates trading signals when all four indicators simultaneously provide buy or sell signals and visually presents these signals on the chart.
**How to Use:**
1. Buy signal: A buy signal is generated when there is a positive crossover in the Chaikin Oscillator, the IMI is above 50, the MACD line crosses the signal line upwards, and the price is above the Parabolic SAR. It is marked with a green arrow below the chart.
2. Sell signal: A sell signal is generated when there is a negative crossover in the Chaikin Oscillator, the IMI is below 50, the MACD line crosses the signal line downwards, and the price is below the Parabolic SAR. It is marked with a red arrow above the chart.
3. Turning zones: Areas with a high probability of transitioning from buy to sell or sell to buy are marked in yellow. These zones are determined by monitoring turning points in the Chaikin Oscillator, MACD, and Intraday Momentum Index.
**How to Apply:**
1. In your TradingView chart, go to the indicators menu and search for the "Vorse4" indicator.
2. Add the indicator to your chart. You will see green and red arrows indicating buy and sell signals, as well as yellow-colored areas representing turning zones on your chart.
3. Observe the buy and sell signals and trade according to your strategy. Analyze the performance of the indicator on historical data to evaluate the reliability of the signals.
**Note:** You can adjust the indicator parameters to balance the frequency and accuracy of buy and sell signals. Each strategy has a different risk-reward balance, so you can try different values to find the one that works best for you.
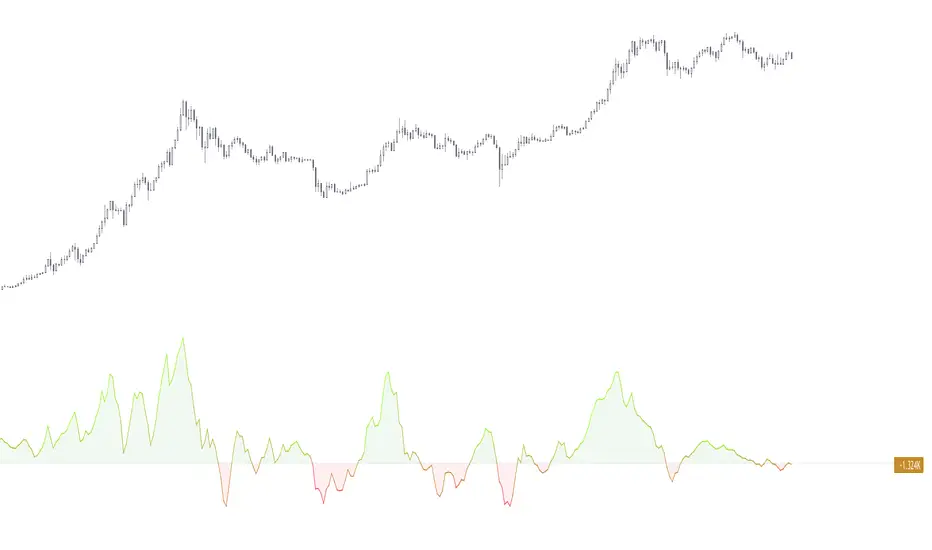
Adaptive Fisherized CMFIntroduction
Heyo, here I made a normalized Chaikin Money Flow (CMF) indicator with Inverse Fisher Transform (IFT) and some smoothing techniques.
I had to normalize the indicator in order to fit it to the IFT range (-1 -> 1).
Moreover, the good old adaptive mode is also included in this indicator. It uses Ehlers superb dominant cycle techniques.
It also has divergence detection, several options for individualisation and doesn't repaint.
Usage
www.investopedia.com
Signals
CMF above 0 => bullish market
CMF below 0 => bearish market
(You can also use the inner bands instead of the zero line, to make these signals more precise)
Bullish regular/hidden divergence => long
Bearish regular/hidden divergence => short
Enjoy guys!
PS: I really would like to hear some feedback of you.
+ Breadth & Volumenote* If you've used my "+ Rate of Change Indicator", I am updating that without the OBV, which has been moved here. Just an FYI.
This "indicator" is basically a variety of indicators that measure volume, or accumulation/distribution. There's a bit of a story about how this came about but
it's not that interesting, so I'll spare you.
Indicators from which you may choose here are On Balance Volume (OBV), Money Flow Index (MFI), Chaikin Money Flow (CMF), Chaikin Oscillator, and Positive & Negative Net Volume.
I'll give a brief overview of these below, and if you want to educate yourself further on them you may. There are many web resources for that.
Most people are probably familiar with OBV. It's one of the more commonly used volume indicators, especially in the crypto crowd (at least amongst those traders I follow). It's basically a cumulative (doesn't oscillate around a midpoint) momentum indicator that measures volume of the current period versus volume of the previous period and adds it if price closed higher, but subtracts it if price closes lower. It's another way of using volume to confirm trend.
The MFI is a momentum indicator that measures the flow of money into and out of an asset over some period of time (user input). It's calculated using the RSI, so it can be used similarly to RSI (divergences, overbought, oversold, etc.), but of course unlike the RSI it's calculated primarily using volume and comparing the most recent candle close to the previous one (similar to OBV).
CMF is a volume-weighted average of accumulation and distribution over a some period of time (typically 21). It's a way of measuring accumulation versus
distribution in an asset, and oscillates around a zero line. You would use it similarly to any other oscillator, in that you can look for divergences, and general positive or negative momentum.
Chaikin Oscillator is basically a MACD (without signal line) of the accumulation and distribution index (or line--which is somehow different than simply accumulation and distribution). I haven't looked into these differences deeply, but if you look below at the calculations, and substituted 'ad' for 'accdist' you get very different readings. I actually did that, and what it looks like it would do is turn the actual Oscillator into a MACD signal line. So, by substituting 'ad' for 'accdist' (or the accumulation/distribution index) you produce a signal line of the Chaikin Oscillator.
Anyway, all that confusion out of the way, as I said, it's a MACD on the accumulation and distribution index, therefore it is another zero line oscillator, and similarly to CMF, it's a way of measuring price movements in the chart versus a/d. The zero line isn't just any old zero line, however, it is actually the accumulation distribution line. I've made an OBV version of this by substituting the OBV for AD, so if you prefer OBV maybe you will like that.
Pos. & Neg Net Volume is actually an indicator I had seen made by RafaelZioni. It basically takes net volume, calculates a cumulative of that, then subtracts a moving average of some period from the cumulative net volume in order to create a volume oscillator. Use it like the other oscillators!
Added Donchian Channels, moving averages, Bollinger Bands, colored everything, and alerts.
Enjoy!
Below I will post images with the different indicators, everything on default settings (except for lookback period, which I have adjusted to my personal preferences).
Above is an image with the MFI being compared to the RSI since they are very similar (MFI being basically a volume derivative of the RSI).
Chaikin Money Flow set to lookback of 13. You could probably extend that a bit if you wanted to smooth the line more.
Chaikin Oscillator and Chaikin Oscillator of OBV, with a zoomed in look below, to see the differences more clearly.
CO and COBV closer look.
Positive & Negative Net Volume.

Chaikin Volume Accumulation Oscillator (VAO)The Volume Accumulation Oscillator is a volume momentum indicator developed by Mark Chaikin (177E, 77th Street, New York, NY
10021). Their simplest form is a sliding sum of daily volumes divided by the difference between the daily closing price and the midpoint of the daily price range.
It is a sensitive short term oscillator, the values of which are obtained by subtracting the value of the previous day of its own ESS from the cumulative sum of the cumulative volume
length of 2 days (for the purpose of normalization, the result is then divided by the value 2-day ESS for the previous day)
Analysis of historical data shows that volume accumulation indicator can be an effective tool, especially on Long
positions.

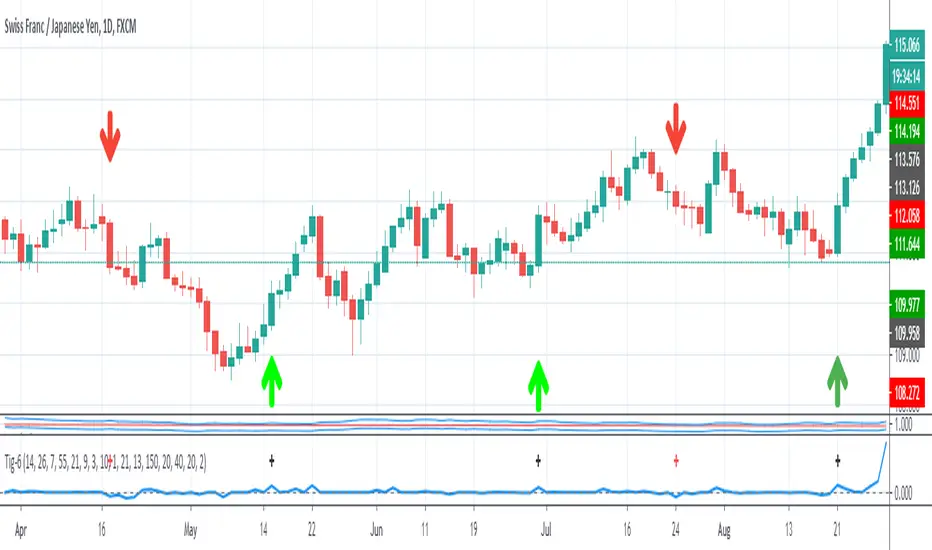
Tig-6Combined Rate of change for EMA 55,21,7 and multiplied by Chaikin Osc.
So far this looks very promising to get into trends earlier, but still hangs up in flat markets. I recommend using this on the daily chart and entering 10-15 pips above or below close.
Enter long when blue line crosses above 0
Enter Short when blue line crosses below 0
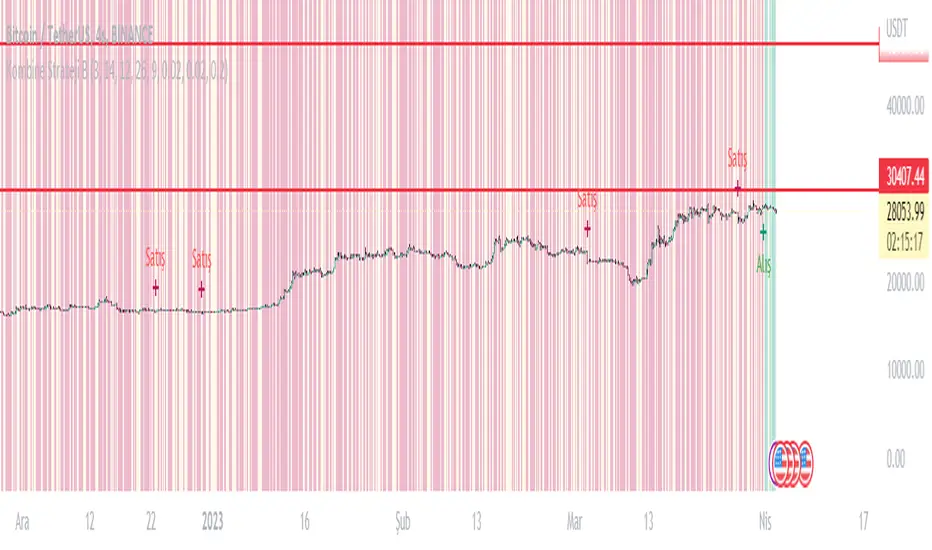
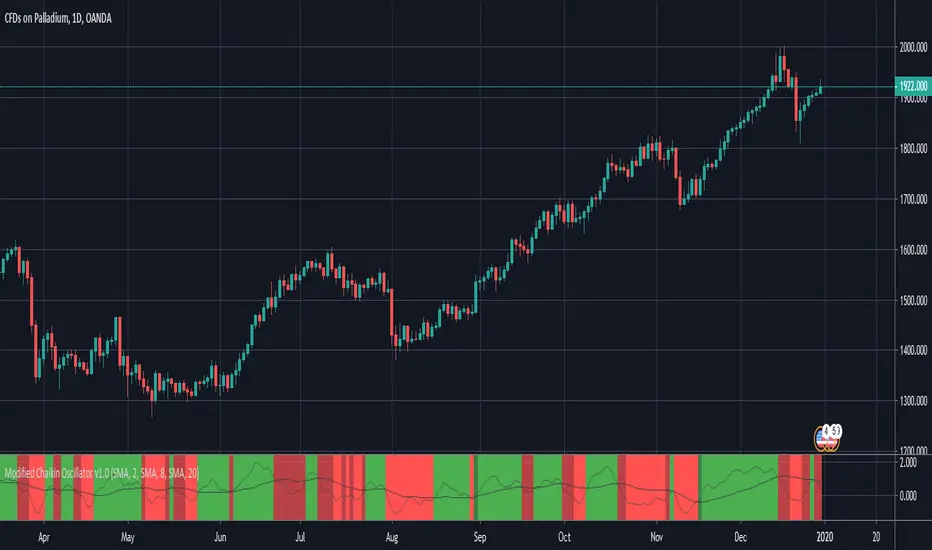
Modified Chaikin OscillatorThis is a modified version of the Chaikin Oscillator. The idea is to find accumulation and distribution phases in the market to identify when institutions are building their positions.
It uses acc/dist but as an oscillator, just like the Chaikin Oscillator, but not to find overbought or oversold areas, but to find trends. It functions like a MACD. It takes a fast moving average of the acc/dist and a slow moving average of the acc/dist, and plots the differense to create the oscillator, and uses a signal line to use for entries.
A strong signal is when the oscillator crosses the signal line while the signal line is on he right side of 0. So a crossover (long) when the signal line is below 0 woul be a weak signal, while a crossover (long) when the signal line is above 0 would be a strong signal.
By default, tick volume is discarded in the calculation, which makes this version behave a bit differently than the standard Chaikin Oscillator. This is because the indicator is mostly used to trade CFD's. If used to trade stocks for example, it is better to include the volume by unchecking that checkbox in the indicator settings.
BRIGHT GREEN = Strong signal LONG (signal line is above 0)
DARK GREEN = Weak signal LONG (signal line is below 0)
BRIGHT RED = Strong signal SHORT (signal line is below 0)
DARK RED = Weak signal SHORT (signal line is above 0)
Chaikin OscillatorThis script plots the original Chaikin Oscillator in addition of highlighting positive/negative pressure areas.
Chaikin Oscillator w/ crossovers [seiglerj]Added background shading to system Chaikin Oscillator to show crossovers more easily.

Chaikin Oscillator w/ crossover arrows [seiglerj]I added crossover arrows to the system Chaikin Oscillator to make crossovers easier to see


0-Cross Arrows for Chaikin oscillator on obv+adl combinationusing chaikin oscillator applied to a modified obv+adl combination and plotting the arrows when it crosses 0.
put on main chart. make scale free.
