Cup and Handle chart patternThis script identifies chart patterns: Cup and Handle. At the same time, it identifies not only these classical patterns, but even a wider range of similar reverse figures .
It has many useful settings:
-- You can choose by which pivots you want to identify patterns - by the edges of wicks (tails, shadows), or by the edges of candle bodies.
-- You can set the minimum number of pivot points that the pattern must contain.
-- You can also set the minimum depth of the shapes. It is important for successful trading.
-- !!! Most importantly, I have added a very useful functionality for those who trade based on chart patterns. Unlike my previous scripts which only identified patterns, in this one I've added the functionality to filter out patterns that I think appear in the wrong places . It is the base level filter. It filters out many, but not all, patterns in inappropriate places. If you want to order the development of such functionality with great opportunities - please contact me.
-- In addition, you can set how "flat" relative to the horizon the identified patterns should be .
You can also customize your styles.
! All key settings are accompanied by detailed tooltips
Chartpatterntrading

Chart pattern - Head and ShouldersThis script identifies the Head and Shoulders chart pattern as well as the reversed Head and Shoulders chart pattern.
It has many settings. For example, you can choose by what points you want to identify patterns - along the edges of wicks (tails, shadows), or along the edges of candle bodies .
In addition, there are several settings with which you can determine the parameters of the detected patterns - the length and ratio of the lines included in it.
The "Sensitivity" parameter will allow you to control the frequency of detected patterns , depending on whether you want the patterns to be detected more often, or if they cover a larger number of candles and thus be more reliable.
You can also customize your styles.
All key settings are accompanied by tooltips.
Ross Hook Pattern (Expo)█ Overview
The Ross Hook pattern is one of the most consistent and successful trading patterns that have been around for years. The Ross Hook is the first correction following the breakout of the 1-2-3 formation . This means that the Ross Hook only occurs in established trends. In other words, Ross Hook is a trend continuation setup. To fully understand the Ross Hook formation, you must understand the 1-2-3 pattern .
Ross Hook Pattern (Expo) is an indicator designed to detect the Ross Hook formation automatically and in real-time in any market and timeframe. With the inbuilt alert feature, the Ross Hook Pattern (Expo) Indicator analyzes the market for you and notifies you when the Ross Hook formations have been found.
█ How to use
Use this indicator to identify the Ross Hook pattern and to find good trend continuation setups. The formation can be used to determine when a trend is confirmed and established.
-----------------
Disclaimer
The information contained in my Scripts/Indicators/Ideas/Algos/Systems does not constitute financial advice or a solicitation to buy or sell any securities of any type. I will not accept liability for any loss or damage, including without limitation any loss of profit, which may arise directly or indirectly from the use of or reliance on such information.
All investments involve risk, and the past performance of a security, industry, sector, market, financial product, trading strategy, backtest, or individual's trading does not guarantee future results or returns. Investors are fully responsible for any investment decisions they make. Such decisions should be based solely on an evaluation of their financial circumstances, investment objectives, risk tolerance, and liquidity needs.
My Scripts/Indicators/Ideas/Algos/Systems are only for educational purposes!

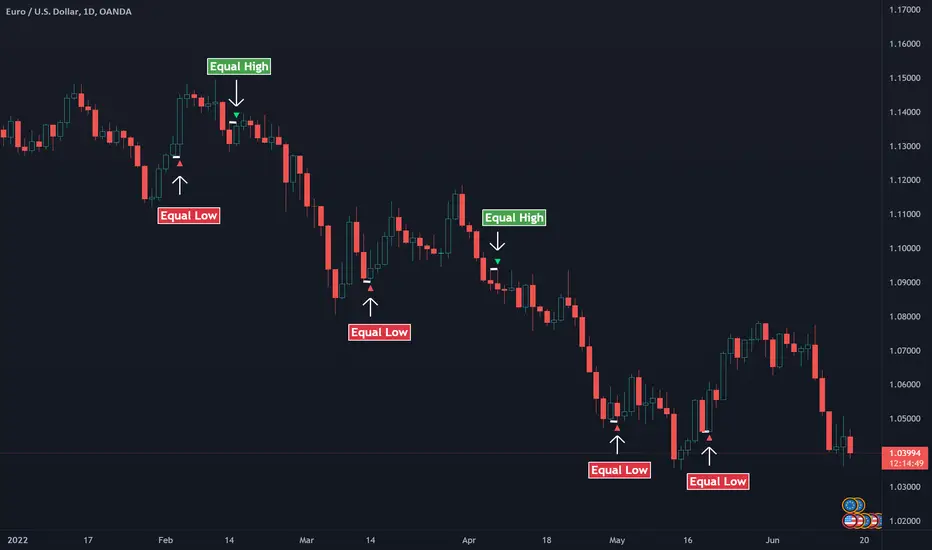
Equal Highs and Equal LowsA simple indicator that detects if two candles lows or highs are equal. The pattern simply indicates the possibility of a reversal. However, many traders also use the Equal highs/lows within a broader context of market analysis to provide insights for trend traders, especially to detect pullbacks.
Equal Highs/Lows are a pattern that can indicate a shift in a trend direction or to find pullbacks within an established trend. The idea behind the equal highs and lows is that the first candle shows a strong move in the current direction, and the second candle pauses the previous candlestick price action. It's a clear sign that the momentum is slowing down. This insight is valuable for traders and can detect a potential change in the trend direction.
Usage
Use the pattern to find reversals.
Use the pattern to find pullbacks.
Disclaimer: No financial advice, only for educational/entertainment purposes.
Fractal Basic Chart Patterns [MyTradingCoder]This script is something that I made a long time ago in my early days of learning Pine. It is not in development anymore but has some unique and impressive utility that will help the community. This script will fractally identify chart patterns(iH&S,H&S,W,M) on any chart and timeframe. Most scripts have limitations that make the user have to adjust various parameters to get the desired result to show up on the chart. Lower input values may show smaller patterns, whereas vise versa, higher input values may show larger patterns, but you never seem to get the best of both worlds with these types of scripts. Some users may appreciate the vast majority of input parameters that most scripts provide, but others like myself may find it restrictive and annoying, as you wont get large patterns AND small patterns simultaneously.
All details needed to understand how to use the script are listed below. I will be creating new and well written scripts in the near future moving forward to help the community as best as I can, and just wanted to make it clear that this particular script is just something that I had on the backburner from a very long time ago, before I was a "Pinescript Maven" :) Enjoy!
Available Patterns:
- W Pattern
- M Pattern
- Head and Shoulders Pattern
- Inverse Head and Shoulder Pattern
Customizable inputs:
- Option to specify minimum bars required to consider a pattern.(Can be helpful if you don't want to see lower timeframe patterns, as some may not look like patterns, but if you drop the timeframe and go to the same time, there will be a pattern there on a lower scale)
- Boolean Inputs to Enable/Disable Certain Patterns
Available Alert Options:
- W Pattern Alert
- M Pattern Alert
- H&S Pattern Alert
- iH&S Pattern Alert
User Manual:
- Patterns will be drawn/detected/finalized on the bar close when the neckline is broken
- Green/Red lines represent the historical structure used to identify each pattern
- Blue dashed lines represent the projected price action based on the pattern completing
- Alerts/Indicator will not repaint(Can use 'once per bar' or 'once per bar close' and behavior will be identical. Code is optimized.)
- May have trouble on assets with daily/weekend time gaps with the projected price action dashed line due to time being used as the xloc. If this becomes a problem, leave a comment below and I will consider bringing this back into development and convert to bar_index as xloc to fix the issue.
- Patterns can be all shapes and sizes, hence the beauty of this indicator
- Leave a comment below for any questions or requests and give the indicator a like if you find it useful

HR from Prev closeThis is my simple indicator to help identify whether an upside bar is unusual or not. I like to see a bar as particularly unusual like a 15% move in a long period where a typical move is under 5%. It usually signals a buying climax and the end of that short term rally.
I compares the previous bar's close to the current bar's high and is expressed as a percentage.
I am not much of an expert in pine so I did not program it to plot as a histogram but that is how I like to view it. If you know how, by all means, send me the edit and I will credit you.

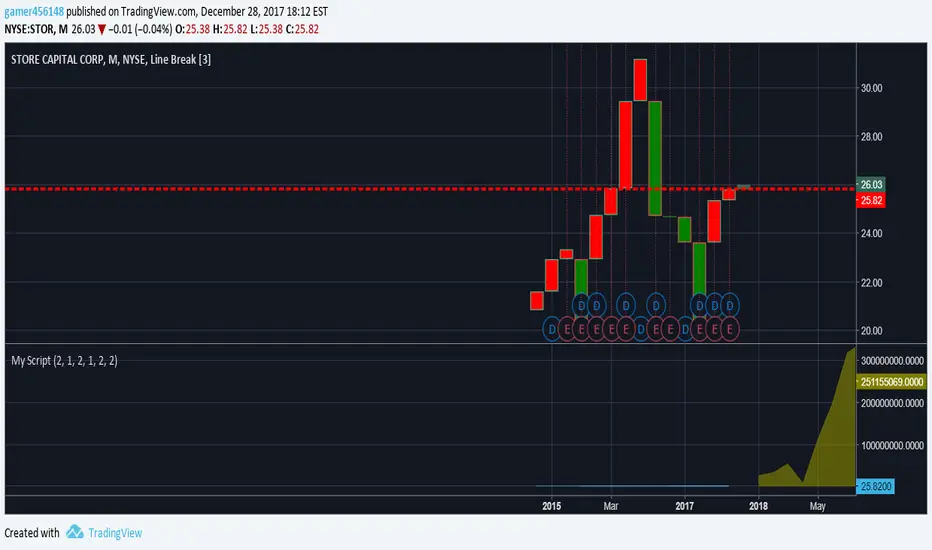
Stock Analysis IndicatorThis is a script for a line break study that includes my Accumulation/Distribution views, and utilizes the Alice study from Benjamin Lupton's repo. Also included is an SWMA moving average strategy, set bar resistance and color options. This is best utilized for predicting the rise of stocks post market as well as chart views for predictive analysis. This is one of the things I am building as a newbie to pinescript, so still improvements to be made. Use this indicator as an extension to your own strategy or custom chart views.