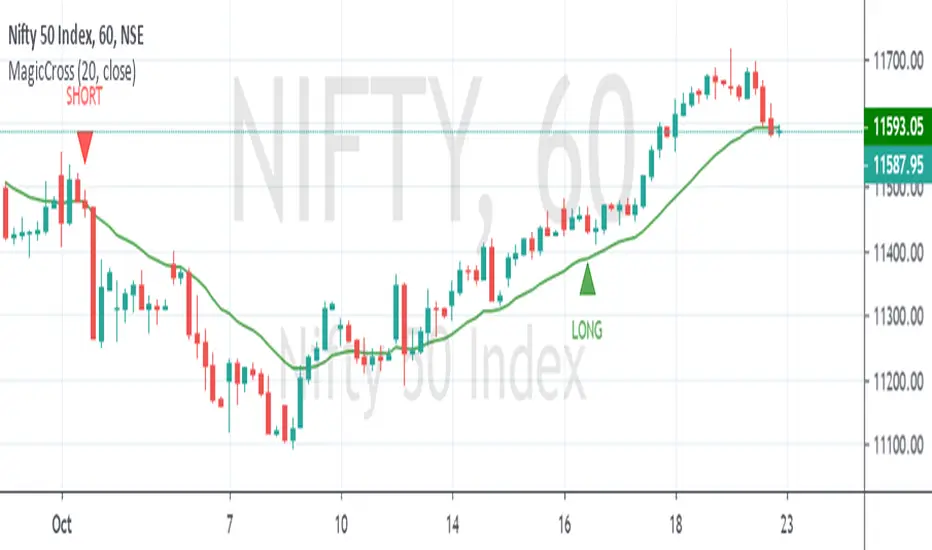
Magic Cross SignalEnter when subsequent candle of Buy or Sell signal breaks high or low respectively. Stop-loss low/high of the signal bar. Book when candle touches MA line on closing basis.
Cross
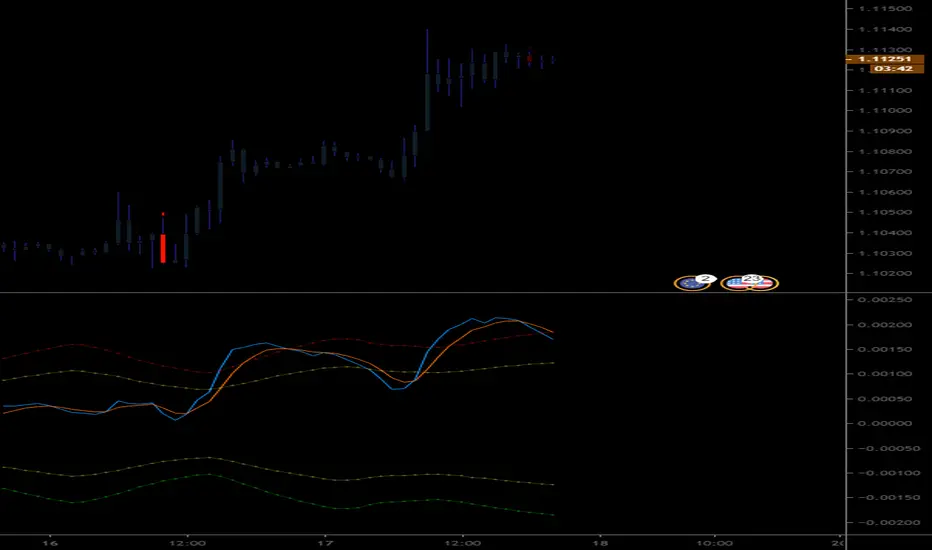
MACD With Dynamic ZonesThis is a standard MACD, but with a big game changer, we calculate upper and lower zones.
Any cross above the top of the upper zone, or bellow the bottom of the lower zone, is considered a strong signal.
Any cross inside the zone bands is considered a weak signal.
Any signal inside the two zones is considered invalid.
Best to use with it's corresponding signal marker on the chart.
For best result, use this on multi time frame.
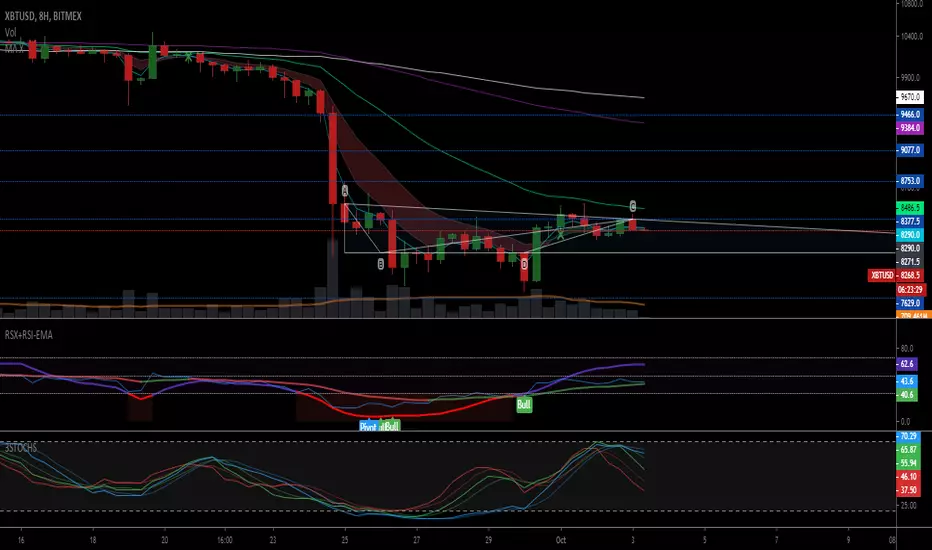
MACD Signal MarketThis is an indicator that sits on the candles of the chart, you need to make the original candle or bar colors totally transparent (even the wicks).
The MACD Oscillator will be published in another post but, if you just want to know, there is an up and down threshold being calculated "dynamically", when macd crosses out side of the threshold zone, we consider it as strong signal, when crossing inside the zone band it's a weak signal and if it crosses under the upper zone band or above lower zone band, we consider the cross as not valid.
To get the best result, use this on two time frames WITH it's corresponding oscillator.


SMA 21/30/50/100/200 with Cross by DragonByteCombines several key simple moving averages into one slot without going overboard. Includes cross indicators between the 50/100 and the 50/200 day SMA's.

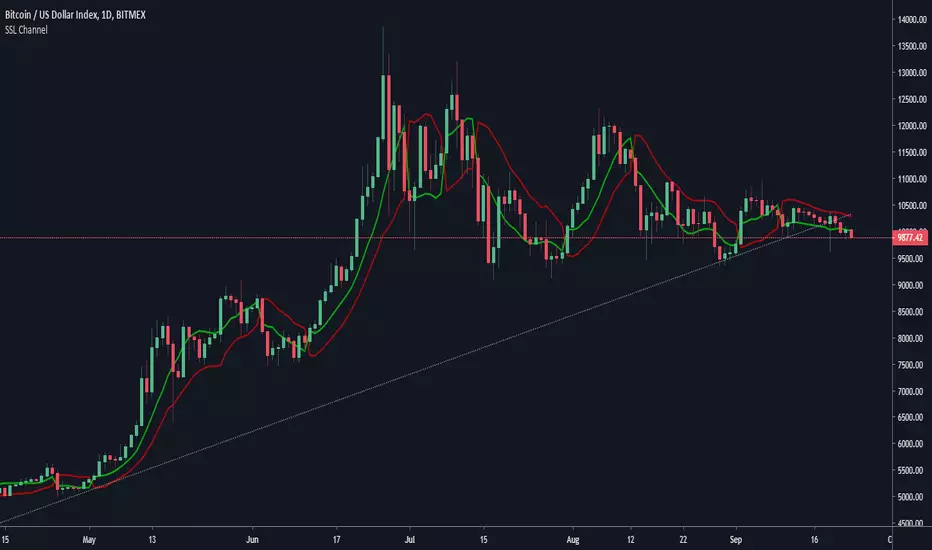
SSL Channel w/alertSSL Channel with cross alert when channels cross up or down. Built on ErwinBeckers SSL Channel script.

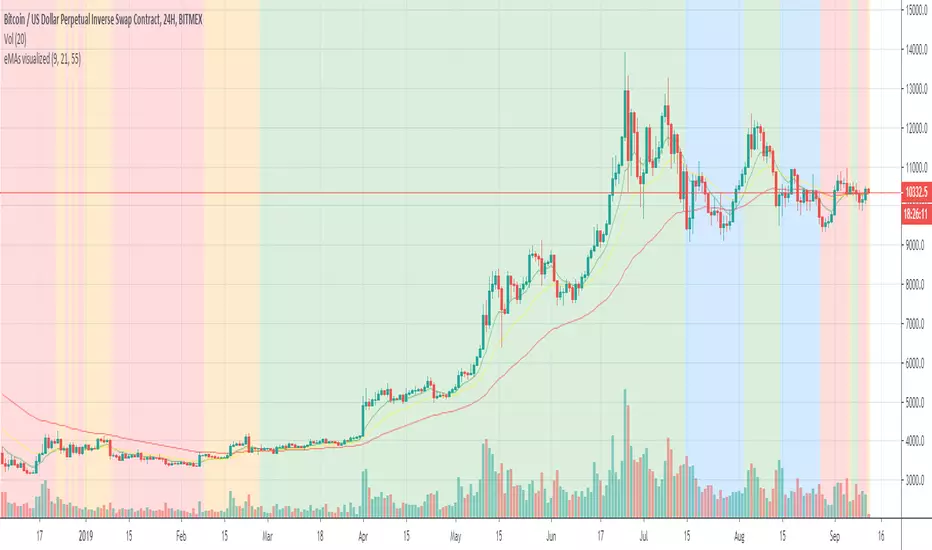
Triple eMA cross trackerTracks 3 emas, colorizing background:
Green - 1 on top of 2 on top of 3;
Blue - 1 on top of 3, but 2 below 3;
Red - 1 below 2 below 3;
Orange - 1 below 3, 2 above 3.
Nutshell: allows a quick and always apparent check for strategies like the old 8e, 13e, 21e strategy you see online, customizeable by any emas of your choosing.
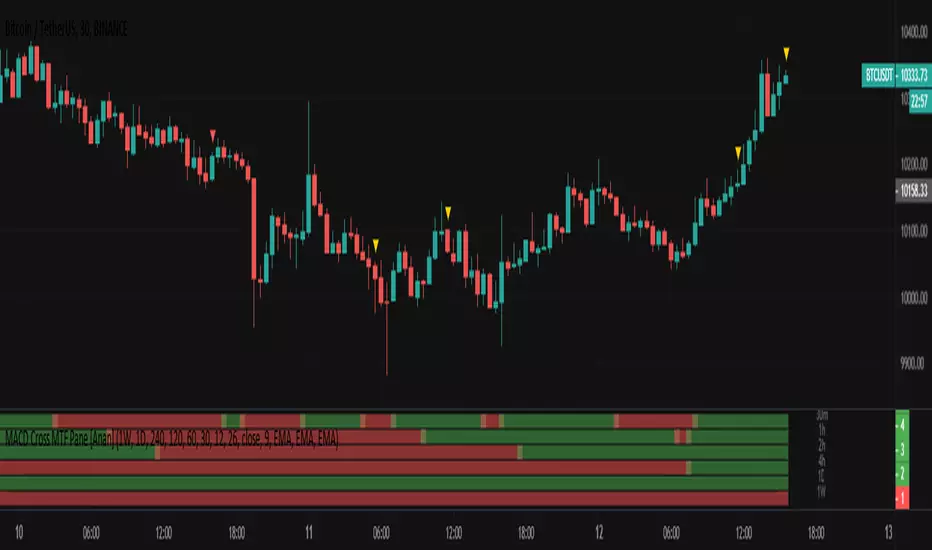
MACD Cross MTF Pane [Anan]Hello Friends,
I'm tired opening MTF charts and looking into MACD Cross, So I decide to share this tool with you ;)
Green = Bullish MACD Cross on
Red = Bearish MACD Cross on
Not Green / Not Red = The point of intersection
Fast-Slow MA Cross on custom timeframe (with alerts)A simple script for tracking your moving average crossing with an option for a fixed time frame and a 3 additional MAs for reference.
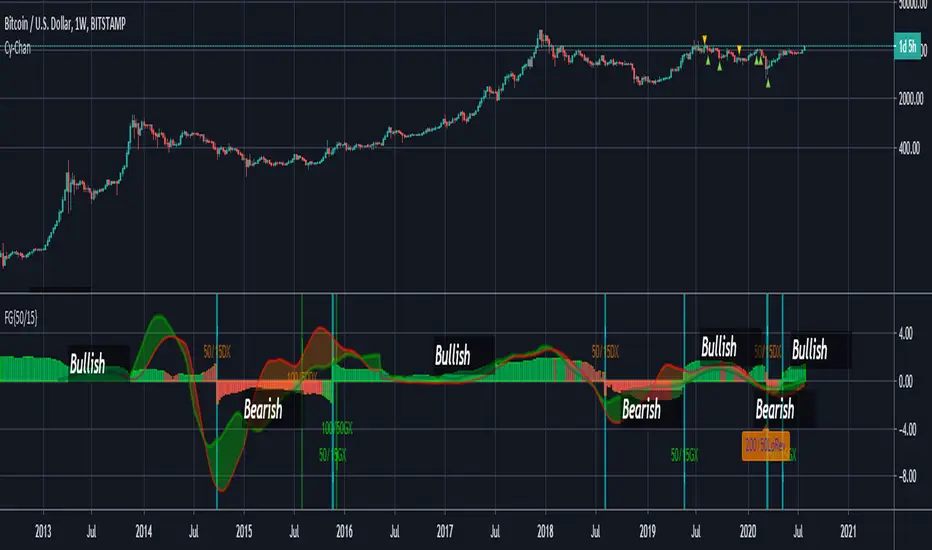
FUSIONGAPS V4 {50/15-Series}Base on the FUSIONGAPS oscillator series, but Only the 50/15 oscillator is plotted, and with Momentum and Acceleration oscillators added.
The thickest line is the FG oscillator: Red/Green coloring indicates if the market is in a Bearish/Bullish period.
The green colored line is the DFG oscillator (DIFFERENTIAL FUSIONGAPS: Price Momentum)
The red colored line is the D2FG oscillator (DOUBLE-DIFFERENTIAL FUSIONGAPS: Price Acceleration)
Indicators:
DeathCrosses ( DX ) and GoldenCrosses ( GX )
Momentum Reversal indicators (D2FG based filter applied to reduce false-positives, but can be manually disabled.)
~ * ~ * ~ * ~ * ~ * ~ * ~ * ~ * ~ * ~ * ~ * ~ * ~ * ~ * ~ * ~ * ~ * ~ * ~ * ~ * ~
Note:
In no way is this intended as a financial/investment/trading advice. You are responsible for your own investment decisions and trades.
Please exercise your own judgement for your own trades base on your own risk-aversion level and goals as an investor or a trader. The use of OTHER indicators and analysis in conjunction (tailored to your own style of investing/trading) will help improve confidence of your analysis, for you to determine your own trade decisions.
~ * ~ * ~ * ~ * ~ * ~ * ~ * ~ * ~ * ~ * ~ * ~ * ~ * ~ * ~ * ~ * ~ * ~ * ~ * ~ * ~
Please check out my other indicators sets and series, e.g.
LIVIDITIUM (dynamic levels),
AEONDRIFT (multi-levels standard deviation bands),
FUSIONGAPS (MA based oscillators),
MAJESTIC (Momentum/Acceleration/Jerk Oscillators),
PRISM (pSAR based oscillator, with RSI/StochRSI as well as Momentum/Acceleration/Jerk indicators),
PDF (parabolic SAR /w HighLow Trends Indicator/Bar-color-marking + Dynamic Fib Retrace and Extension Level)
and more to come.
Constructive feedback and suggestions are welcome.
~ JuniAiko
(=^~^=)v~
ADX Di+ Di- [Gu5]Fill indicates Strong Trend
Cross indicates End of Trend
--
El relleno indica una fuerte tendencia cuando el Di supera "Level Trend"
El cruce de Di+ con Di- indica el fin de la tendencia
Cuando el valor del ADX es menor a "Level Range", estamos en Rango

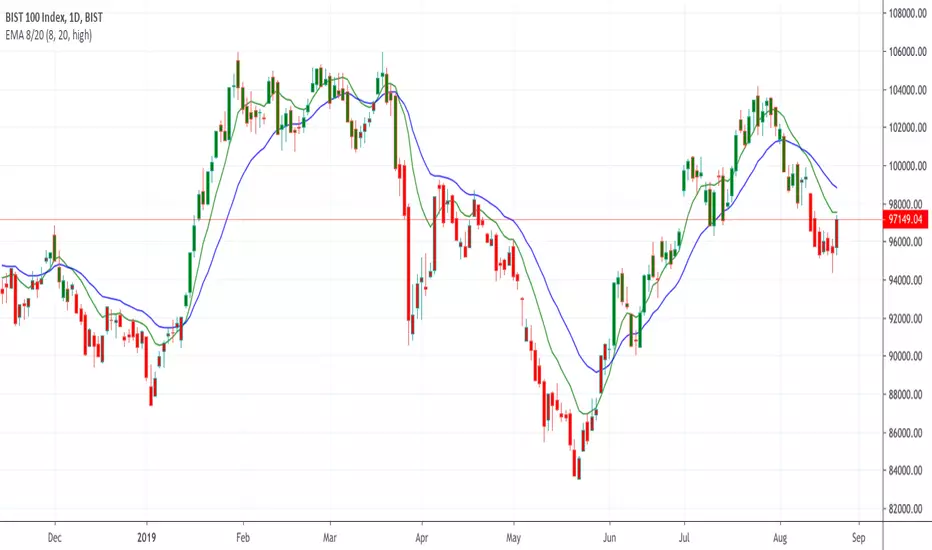
EMA 8/20This is a simple cross over moving avareges
Bu iki basit hareketli ortalamın kesişimini gösteren bir indikatördür
True Golden Cross by -Westy-
The “Golden Cross” of the 50 and 200 day SMA is not the most accurate combination profit-wise.
Testing of 1750 combinations over 300 years of data across 16 global markets revealed that the EMA produces better results than the SMA and the best settings are that of a 13 / 48 EMA Crossover.
Research credit to - etfhq.com

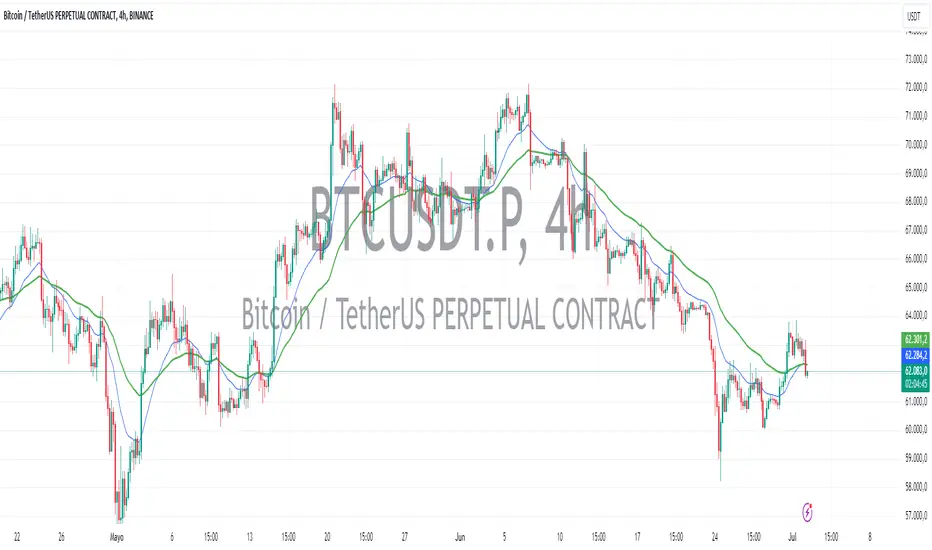
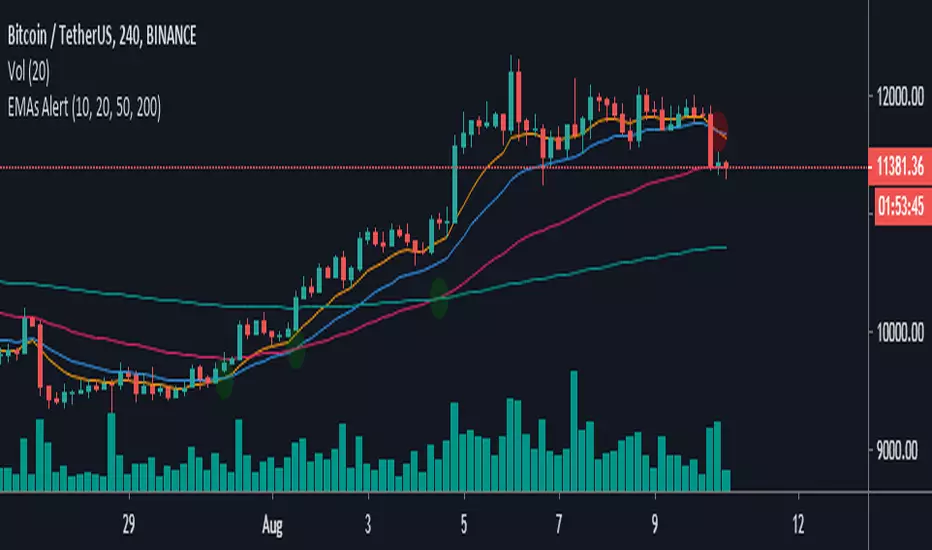
EMAs Alert-This script allows you to show the crossings of the most important emas such as 10, 20, 50 and 200
-You can modify the values of each ema you like
-Bring alerts of the crosses of each ema, which will allow you to activate this function to only the assets you want to track
Golden Cross by -Westy-Quick Guide
- Yellow cross and green MA on top = Potential uptrend
- Yellow cross and red MA on top = Potential downtrend
A simple golden cross indicator of the green 50 and red 200 SMA with a yellow cross for ease of visibility and backtesting.
Generally, longer time frames more powerful signals but are less frequent. I typically use it on the 4 hour, daily and weekly.

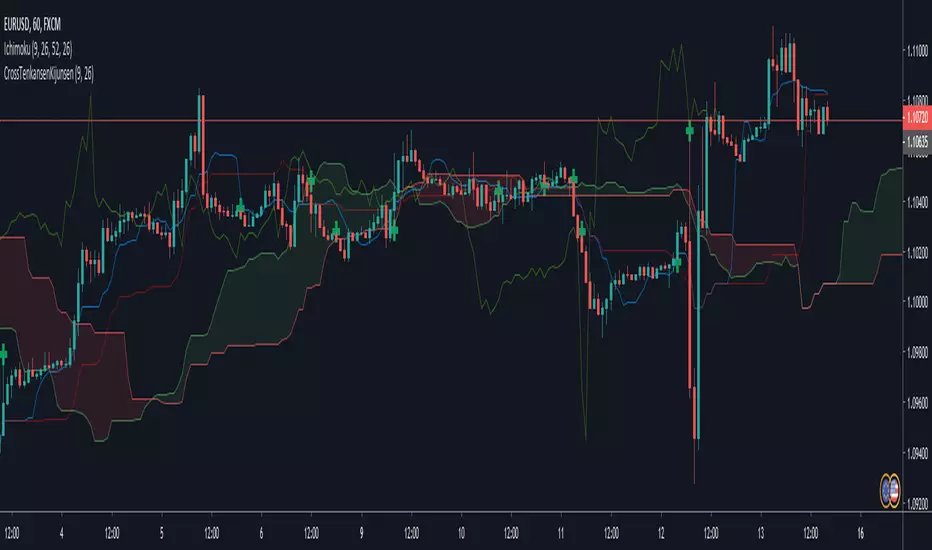
Ichimoku Cross Indicator [Mehdihz]This script shows tenken & kijen lines position to better detection of crosses.

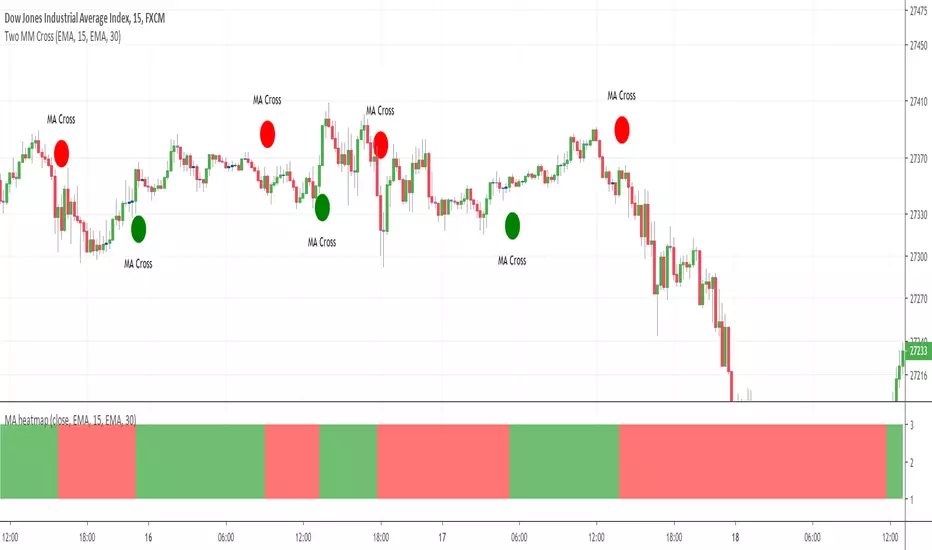
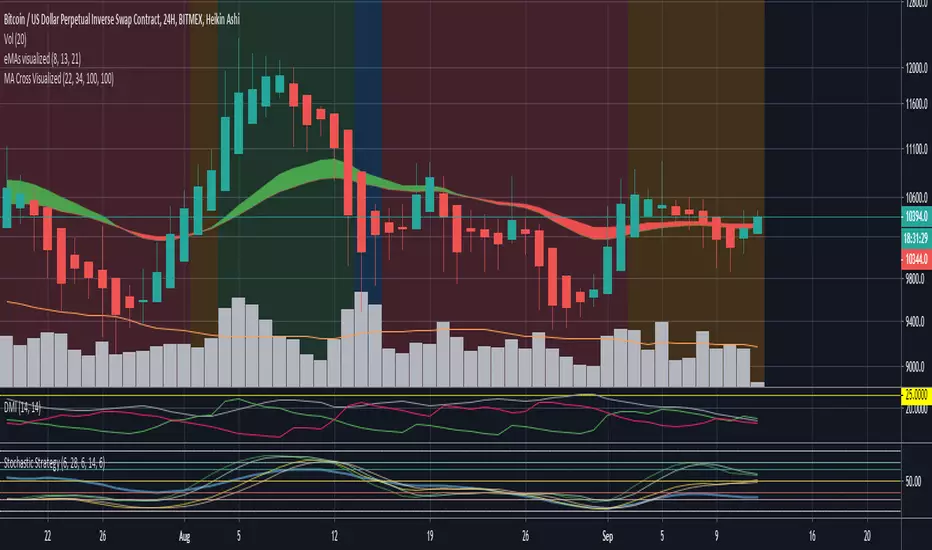
Triple Moving Average HeatmapHi everyone
I didn't publish on Friday because I was working on an Expert Advisor in MT4. The day I don't publish, some scripts spamming guys published many (not useful) scripts the same to kick me out of the TOP #1 ranking.
So what I'm going to do about it? crying or sharing more quality scripts than before? :)
I guess you know the answer :) I'm gonna share a few quality scripts that I have in my library. I noticed that you guys tend to like more the scripts useful for your trading actually making you money rather than a copy-paste (of another copy-paste)
Alright, enough for the trolling now let's introduce the Three MA heatmap which is an upgrade of that script : MA-heatmap-Double-cross-edition/
The challenge was to keep the heatmap not rolling and to make it match with the MA cross. I did it using this
```
since_ma_buy = barssince(macrossover)
since_ma_sell = barssince(macrossunder)
heatmap_color() =>
since_ma_buy < since_ma_sell ? color.new(color.green, 20) : since_ma_buy > since_ma_sell ? color.new(color.red, 20) : na
```
This is a technique that I found after drinking three glasses of red wine (#french) to keep the heatmap stable and not rolling.
To get what I'm saying I invite you to replace the piece of code above by what everyone would normally do
```
heatmap_color() =>
macrossunder() ? color.new(color.green, 20) : macrossover() ? color.new(color.red, 20) : na
```
Ah and I'm not done sharing for the day, a few scripts are coming also after that one and tonight !!!!! I want to live in a world where you guys can enjoy quality scripts (mostly) :)
PS
____________________________________________________________
Feel free to hit the thumbs up as it shows me that I'm not doing this for nothing and will motivate to deliver more quality content in the future.
- I'm an officially approved PineEditor/LUA/MT4 approved mentor on codementor. You can request a coaching with me if you want and I'll teach you how to build kick-ass indicators and strategies
Jump on a 1 to 1 coaching with me
- You can also hire for a custom dev of your indicator/strategy/bot/chrome extension/python

Bollinger bands/Lagging span crossHello my dear ambitious traders
I'm working hard this week to publish some great indicators this week and open sourced. Hope you'll enjoy, learn and use them.
This will be my greatest reward but comments showing appreciation are also very welcomed (actually likes too) :)
For today, I'll share a simple indicator but it's coming along with some insightful knowledge ^^
Anyway, I'm not here to ask you to this but to share a very cool indicator I made a few months ago and wanted to share for FREE with the community today
The indicator is related to this educational post : What-a-Bollinger-Bands-Lagging-span-cross-can-tell-us/
This trading technique was invented by Robbytrade, a famous french trader twitter.com
I wanted to have those visual signals on the chart so I coded it.
The advantage of being a developer is that you can litteraly code what you miss and get your life better in the process. The one that will find a way to code a new form of money will be rich... wait.... that guy is called Satoshi Nakamoto...
That's all for me today my friends
PS
Trying to update the Trade Manager shared yesterday with some cool features. More to come in the upcoming days
Enjoy
Dave

MA heatmap (Double cross edition)Hello my friends
Sorry yesterday I couldn't post an indicator because I was travelling. So here's the today indicator inspired from that one Moving-Average-Heatmap-Visualization/
This will gives an interesting representation of a Double Moving Average cross
That's all for me
Let's resume the free indicators publishing next Monday with the MA heatmap (Triple cross edition) and then the 4 cross ... until the 100 cross edition .... "wait are you joking sir ?"... Totally YES :)
But the Triple cross edition will be released as it's interesting from a Pine script perspective
Enjoy your weekend and stay safe
Dave