PerPro V7 V3 Crypto ScalperIn this version of PERPRO Crypto you will be able to trade btcusd in 5 minutes and 1h, according to the recommendation enclosed. You can also look for other configurations at other times.
Money management for 1h
Take Profit = 12000
Stop Loss = 0
Trailing Stop Loss = 8000
Trailing Stop Loss Offset = 8000
Cryptocurrency

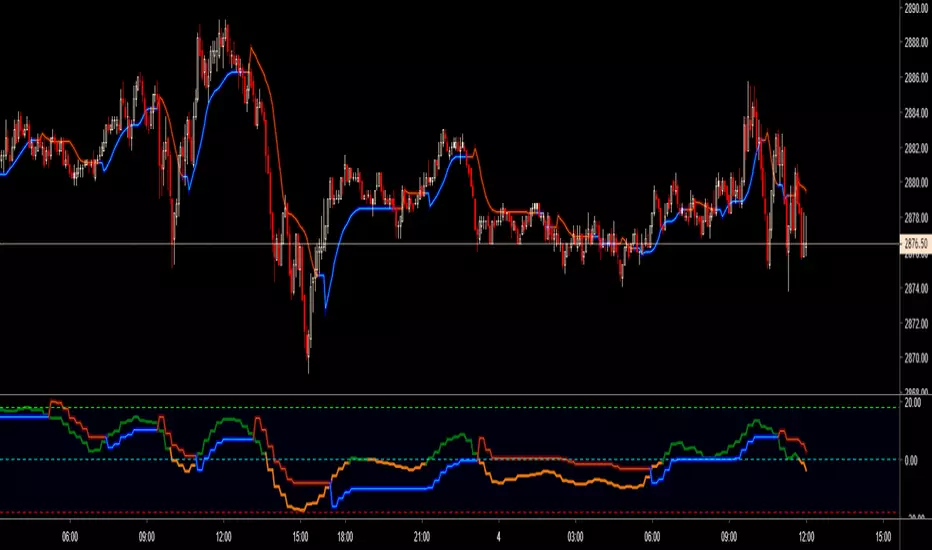
PpSignal QQE Move Average Normal VersionQQE Move Average.
The indicator QQE, is an interesting tool based on a Relative Strength Index ( RSI ). While the original RSI is often used as a pointer for overbought or oversold market phases, the QQE provides additional information. Use the QQE to display trend direction and trend strength.
in this version we convert QQE oscilator to QQE move Averague.
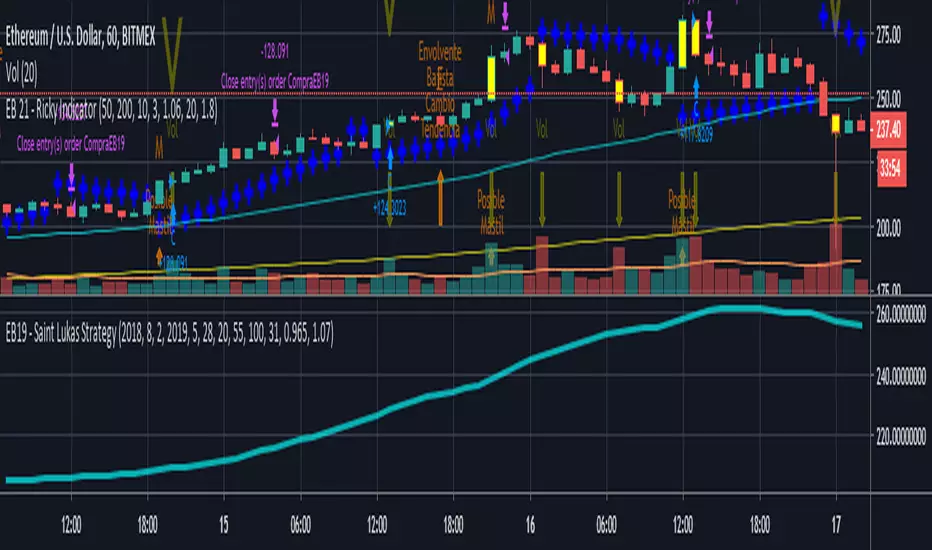
EB19 - Saint Lukas StrategySaint Lukas Strategy can be used for Long buy and sell signal.
It is used for backtesting and analyze results with differents entry parameters.
Has different entry parameters to adjust the best combination for each Crypto concurrency, Forex Pairs and Stocks.
It is not an indicator, to use in real time with real trades.
If you make a backtesting and get good results, you can contact me to analyze if I can program an indicator for you.
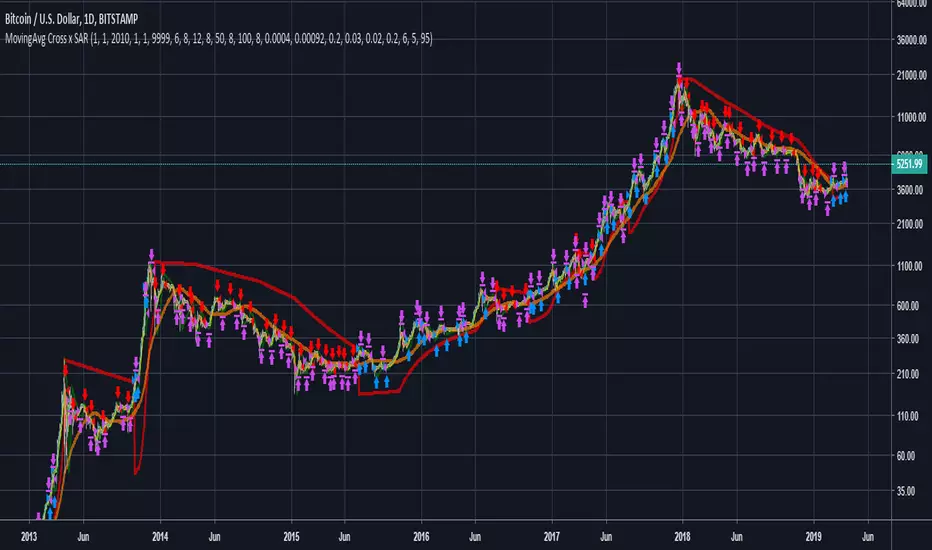
MovingAvg Cross x SARSimple yet powerful strategy to use on cryptomarkets.
I recommend use up to 2-3x leverage in order to prevent liquidations. The results will be much better than backtest if you do so.
Working timeframes are 1d and 4h , but you can test it anywhere. Set time interval in settings to avoid >3000 orders.
Feel free to add this to your favorites and use it on your own risk.
The best markets are BITMEX:XBTUSD , BITSTAMP:BTCUSD , BINANCE:XRPBTC and BITFINEX:ETHUSD .
If you found this helpful please donate and I will develop more interesting things:
BTC: 3BMEXi9EU5SRmiSxXFdTRVCpDXQeP8KMis
ETH: 0xc4ce227a1c8586794e07ca378c04a64ba6bb2387
PpSignal QQE Normal VersionThe indicator QQE, is an interesting tool based on a Relative Strength Index ( RSI ). While the original RSI is often used as a pointer for overbought or oversold market phases, the QQE provides additional information. Use the QQE to display trend direction and trend strength.

PpSignal QQE SmoothThe indicator QQE, is an interesting tool based on a Relative Strength Index ( RSI ). While the original RSI is often used as a pointer for overbought or oversold market phases, the QQE provides additional information. Use the QQE to display trend direction and trend strength.
We smoothing the QQe signal and we added MTF options

ReMegaSayayinTraderthis is a kakaroto based tools we have been so many centuries in the time capsule training with goku to bring you this awesome indicator

ReMegaSayayinTraderTHIS IS A AKAROTO BASED TOOL WE HAVE BEEN INSPIRED BY LTRA INSTTINC MODE OF GOKU A CREATE THIS TOOL THAT U CAN USE IN 1 MINUTE CHART, IF U ARE IN LONG AND THE SAYAYIN SAYS SHORT, Y CHANGE UR TRADE COME ON USE IT IT WILL BE AMAZING


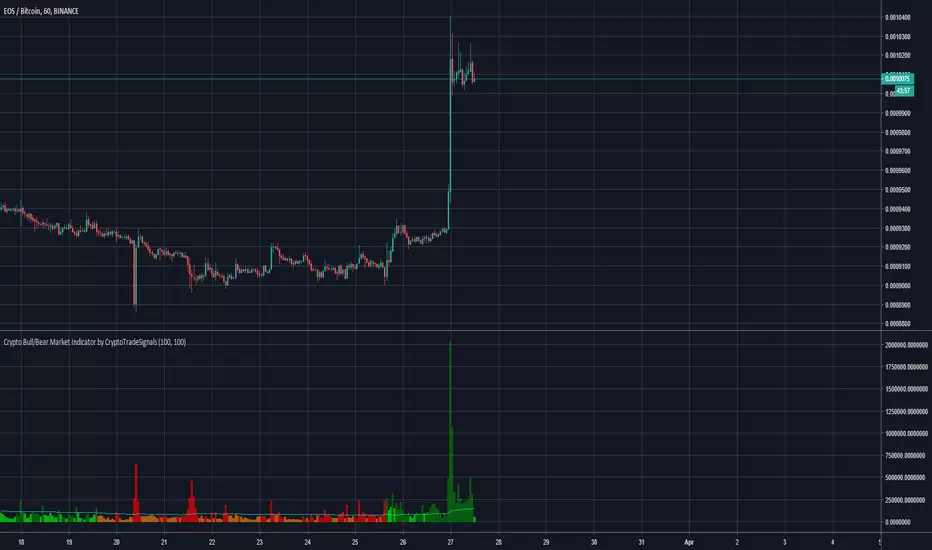
Crypto Bull/Bear Market Indicator by CryptoTradeSignalsHave you ever struggled to identify the sentiment of the crypto market?
With the "Crypto Bull/Bear Market Indicator by CryptoTradeSIgnals" you can easily determine whether markets are “bullish” or “bearish".
Features
Combines price and volume algorithms to easily identify market sell offs or strong buying activity.
Synergises with with Crypto Peak and Crypto Bottom indicators to better identify ENTRY and EXIT points for your trades.
Complete REWRITE of the pre-existing Crypto Bull/Bear Signal which provides better visual cues to understand market activity.
>>Get access to our Crypto Trading Indicators by visiting our website (please go to my main profile page or check the my signature)<<
Crypto Majors Strength IndexIndicator showing the strength of the major cryptocurrencies relative to a base currency and to each other.
Coins included in index: BTC, ETH, LTC, XRP, ADA, EOS, TRX.
How it works:
The currency that you're viewing acts as the base currency and all other currencies will be measure relative to it. The indicator shows the percentage price change of the major currencies relative to the percentage change of the currency that you're viewing.
• Currencies that are trending above the base line are stronger than the currency you're viewing (either rising more rapidly or falling more slowly).
• Currencies that are trending below the base line are weaker than the currency you're viewing (either falling more rapidly or rising more slowly).
How the Crypto Majors Strength Index can assist your trading:
1. Identify the beginning/ending of breakouts
As BTC tends to lead the market, lets apply the indicator on this currency. On a daily timeframe we can see that:
• From 23rd Jan 2019 to 18th Feb 2019 LTC outperforms BTC as well as all other majors
• During this same period TRX appears to consistently underperform
• Beginning around 11th March 2019 ADA begins to perform better than BTC and the rest of the index
• A hypothetical strategy that used the index might Long LTC and Short TRX during this period before moving profits into ADA
We don't have to use the index on BTCUSD. Used on an Alt coin like HOTBTC we can see how on 10th Jan 2019 the Majors begin to trend below the base line indicating strength in HOTBTC relative to these coins
2. Identify correlated currencies
• As the base currency moves, which coins move with it and which don't?
• For example, some say XRP has the least correlation with BTC. From 3rd Nov 2018 through to 16th December 2018 this appeared to be the case but has reduced recently
3. Avoid dead money
• Not much fun spending too long in a currency trading eternally sideways. With a glance at the index you can identify the currencies trading upwards/downwards which can help you decide where to allocate your capital. Those coins moving away from the base line is where volatility (and returns) are to be found
-------------------------------
This is my first published indicator so ideas and suggestions welcome. Grazie 🙏

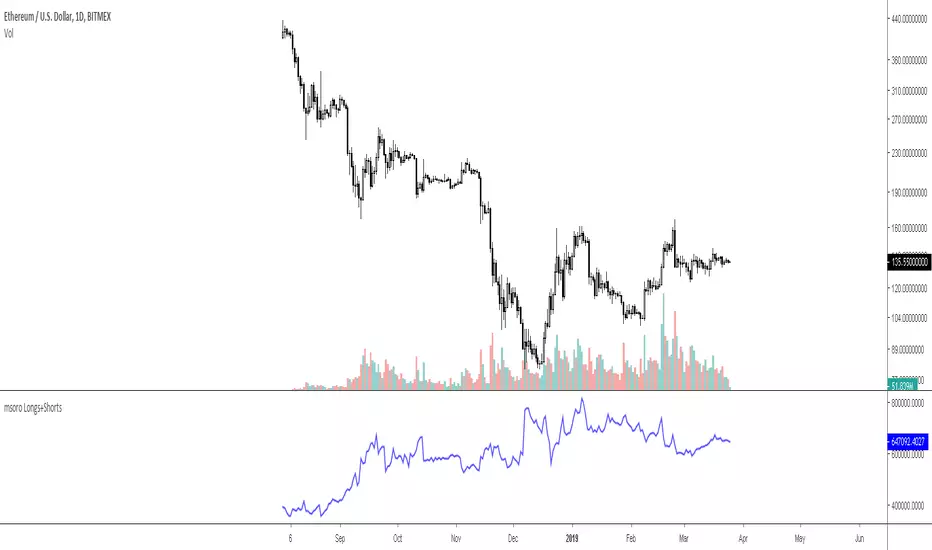
msoro Longs+Shorts sumIt charts the sum of open long and short positions. Useful for determining speculation levels on a cryptocurrency.
Use this indicator on any coin that has margin trading available on bitfinex.
Works for XBT as well
PpSignal For Loop - Up / Down Bars CounterPerPro Oscillator version
Buy when the oscillator is up to line 61.8 of Fibonacci, color lime.
Sell when the oscillator is down to line 23.6 of Fibonacci, color orange.
The fibo 38 and 50, silver color is a neutral position.

PpSignal Wyckoff Volumeoriginal script
i changed internal calculation
for more information about this oscilator see please
stockcharts.com

PpSignal Wyckoff Wave
the original script is from @modhelius.
I add color trend, alarm (up and down), and volume weighted Average convert to smooth elder.

PpSignal Multi-Day VWAPThank to @mortdiggiddy
original script:
Chart the multi-day Volume Weighted Average Price ( VWAP ). Normally, the VWAP is tracked for the current day, from the first bar of the day (regular or extended session). The VWAP shows the current value of:
-> sum(hlc3 * volume , barsForDay) / sum( volume , barsForDay),
-> where 'barsForDay' is the total number bars that have elapsed during the day for the chart interval.
The multi-day version tracks the VWAP for N days back, by averaging the previous N - 1 day bars VWAP and the current VWAP for the current bar (chart interval).
This is very different that simply using a volume weighted moving average , since the closing VWAP values are used for the historical day bars. The results are interesting for intraday trades... especially for values of 1, 2, 3, 4, 5 ....to 21 days.

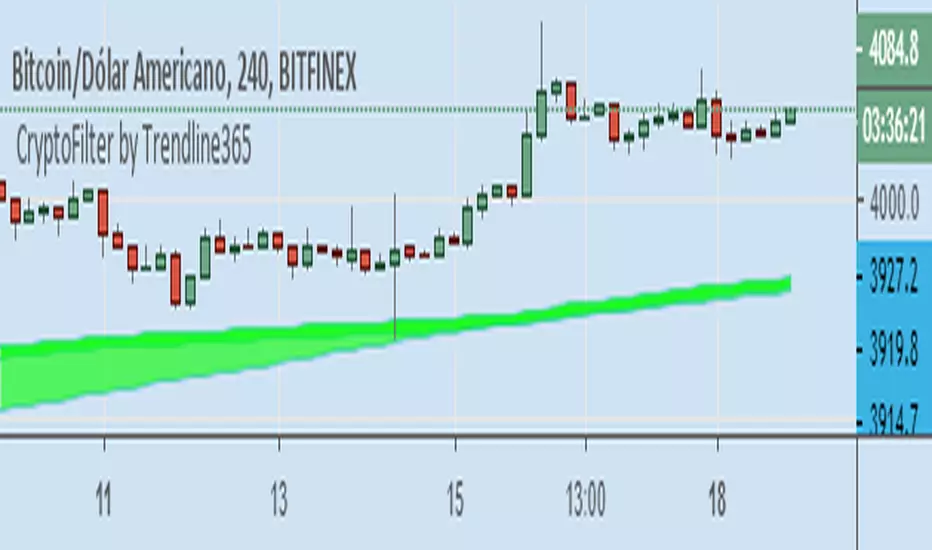
Cryptofilter by Trendline365Cryptofilter: Indicator filter trend for Crypto-Market.
With this indicator it is possible to read the trend of the graphical time,
so that the user can compare with other graph times and check if the market is aligned or not.
Thus it is possible to define if the market is aligned in several times of reading, following the same direction, mainly the sequential times, or 1/5 / 15min and 5/15/60 min.
Cryptofilter is not recommended for use as a point of entry or exit indicator.
SMA Serial for Crypto Day Trade Fixed Length SSCDTENCrypto market is different from other financial markets
This indicator plot SMA series that fits Crypto, esp BTCUSD, XBTUSD
Good for 5m - 1H time period for Day Trading.
Specific SMA can be toggle on/off
---------- Française ----------
Le marché de la crypto-monnaie est différent des autres marchés financiers
Cet indicateur série SMA qui correspond à Crypto-monnaie, en particulier BTCUSD, XBTUSD
Bon pour 5m - 1H période pour le day trading.
SMA spécifique peut être activé / désactivé
---------- 中文 ----------
加密货币市场与其他金融市场不同
该指标绘制了适合加密货币的SMA系列,特别是BTCUSD,XBTUSD
适合5分钟 - 1小时 日间交易时间段。
特定SMA可以打开/关闭
----------日本語----------
暗号通貨市場は他の金融市場とは異なります
この指標は、暗号通貨、特にBTCUSD、XBTUSD用のSMAシリーズを描画します。
5分から1時間の取引期間に適しています。
特定のSMAをオン/オフにすることができます
---------- Disclaim ----------
Before using this indicator, you acknowledge that you have read and accepted that this indicator is for research purpose only and it does NOT provide any investment nor trading signal.
Users should make their own decisions, carefully assess risks and be responsible for their own investment and trading activities.


PerPro V7+AlertPerPro V7 with alarm. version can be configurable with telegram alert.
www.youtube.com

Icarus v2 [STRATEGY] - by @cryptomrdavis -This is the strategy version from the Icarus v2 indicator
Happy trading
+++ use this tool on your own risk. i'm not responsible for your loses. DYOR +++
____________________________________________________________________________
BTC: 1GVRDK3HHr9CKM5SF2CGpCNXFuavB3L4j9
ETH: 0x7b825fa752b9926D3E8397cDb1d9E5473D074646
XLM: GAXUQJSW55C7MAC4GI26NZUGIKSHFDVFRFKZCXPLMPY4HCADSDT55XK6
BCH: qz57n04ud6mn42u00aymqkku8tfh0lk4jv9c28mjvv
tippin.me
____________________________________________________________________________
