Oversold RSI with Tight Stop-Loss Strategy (by Coinrule)KRAKEN:LINKUSD
This is one of the best strategies that can be used to get familiar with technical indicators and start to include them in your rules on Coinrule .
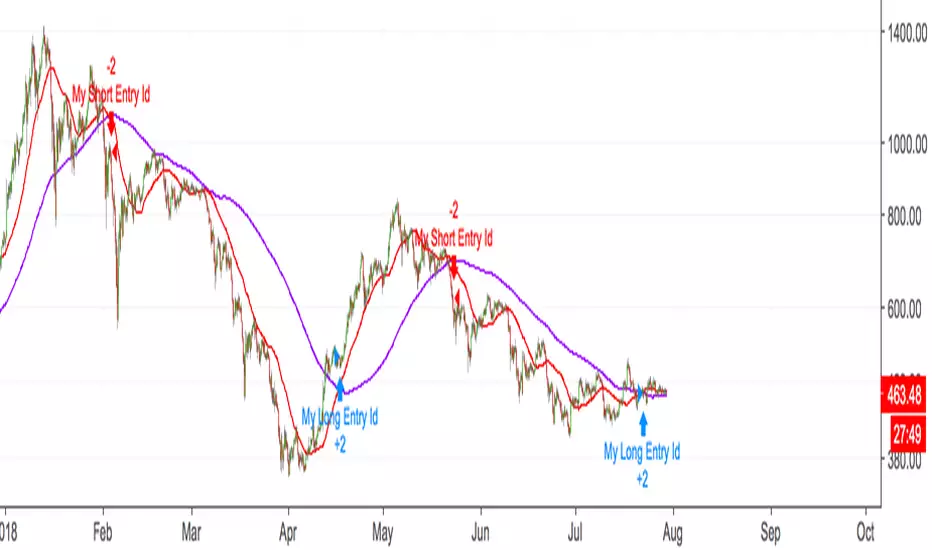
ENTRY
1. This trading system uses the RSI (Relative Strength Index) to anticipate good points to enter positions. RSI is a technical indicator frequently used in trading. It works by measuring the speed and change of price movements to determine whether a coin is oversold (indicating a good entry point) or overbought (indicating a point of exit/entry for a short position). The RSI oscillates between 0 and 100 and is traditionally considered overbought when over 70 and oversold when below 30.
2. To pick the right moment to buy, the strategy enters a trade when the RSI falls below 30 indicating the coin is oversold and primed for a trend reversal.
EXIT
The strategy then exits the position when the price appreciates 7% from the point of entry. The position also maintains a tight stop-loss and closes the position if the price depreciates 1% from the entry price. The idea behind this is to cut your losing trades fast and let your winners ride.
The best time frame for this strategy based on our back testing data is the daily. Shorter time frames can also work well on certain coins, however in our experience, the daily works best. Feel free to experiment with this script and test it on a variety of your coins! With our back testing data a trading fee of 0.1% is taken into account. The fee is aligned to the base fee applied on Binance, which is the largest cryptocurrency exchange by volume. In the example shown, this strategy made a handsome net profit of 52.6% on Chainlink with 66.67% of trades being profitable.
You can execute this strategy on your favorite exchanges with Coinrule .
Cryptotrader

Simple Alt Coin Strategy - EMA and MACD w/Profit and StopThis script prints BUY and SELL signals based on settings you input. I use it to save time while scrolling through charts deciding what alts I want to look at.
BUY SIGNALS
Positive EMA Crossover
Positive MACD Crossover
Single Candle Gains
SELL SIGNALS
Profit Capture
Stop Loss
I don't trade based just on the BUY or SELL from this strategy, but I have found that these indicators do very well well looking at the large cap alt coins. It backtests well.
Default Settings EMA 5/12/50, MACD 9/12/26, Single Candle Gain 10%, Stop 10%, Profit Capture 45%

CryptoTrader - Simple and effective Ema CrossoverWorks well on 4h charts, ETHUSD,BTCUSD,and XRPUSD but can be tested also on other crypto's.
On those pairs no need of sofisticate scripts to trade.
Can add a trailing stop, but as you see works perfect as it is.
KISS (Keep It Simple Stupid).
Simple profitable trading strategyThis strategy has three components.
Philakones EMAs are a sequence of five fibonacci EMAs. They range from 55 candles (green) to 8 candles (red) in length. A strong trend or breakout is marked by the emas appearing in sequence of their length from 8 to 55 or vice versa. These EMAs are also used to signal an exit. Only two EMAs are used for exit signals - when the 13 EMA crosses over/under the 55 EMA.
RSI gives a bullish signal when 40 > rsi > 70. Exit signals are oversold (30) or overbought (70)
Stochastics give a bullish signal when stoch < 80 and an exit signal when > 95.
Results include 3 ticks of slippage and taker fees of .002. Provides a pretty smooth equity curve with a 73% win rate and beats buy and hold by than 10x (returns about 60x overall) since start of 2017.
