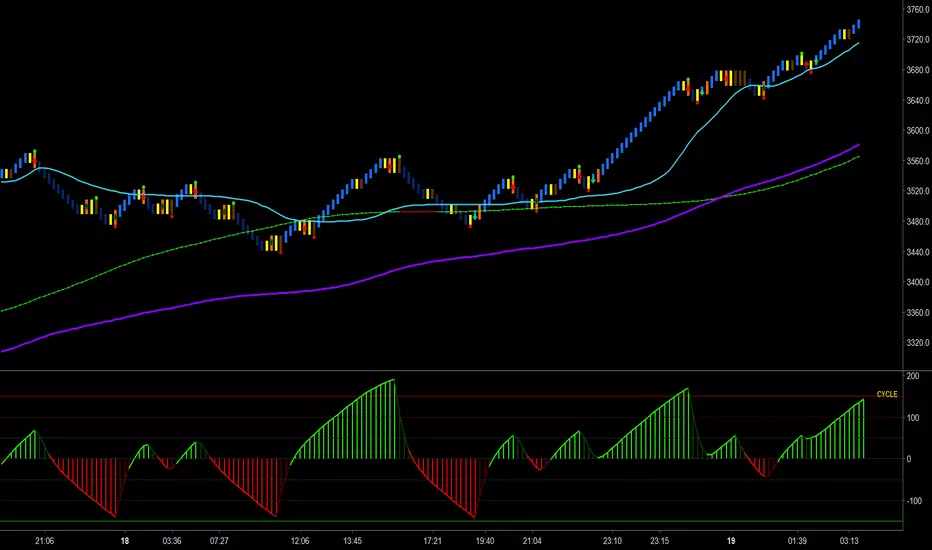
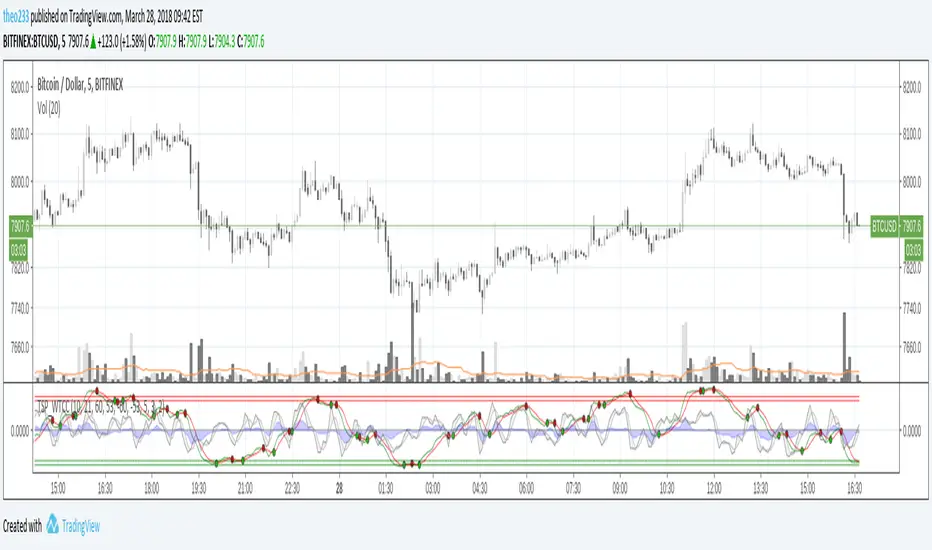
Trader Set CycleA very heavily modified stochastic. As you can see in the picture, not only the range of movement is changes, but also, it's not clamped at 100 and will not clamp at -100. No more nasty noises when stochastic "sticks" to 100 when the price is constantly goes up or vice versa.
Please, don't ask for access, only my students from my classes will have access to this indicator, at least for time being. If at any time in future I wish to sell, you will find the price and how to buy in the comments bellow.
Cycle
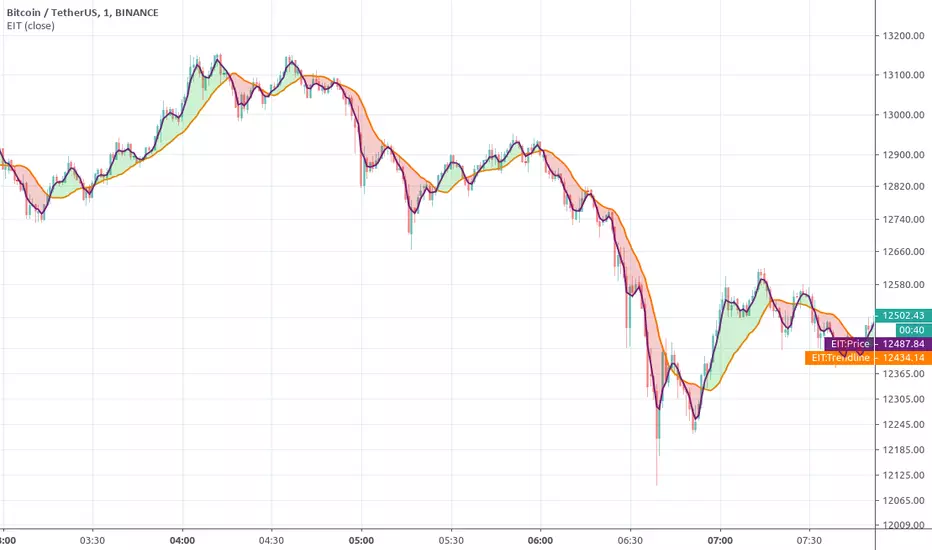
Ehlers Instantaneous TrendlineEhlers Instantaneous Trendline script.
This indicator was described by John F. Ehlers in his book "Rocket Science for Traders" (2001, Chapter 10: The Instantaneous Trendline).
CCI Cycle (Modified Schaff Trend Cycle)This is a modified Schaff Trend Cycle (STC), which is designed to provide quicker entries and exits.
I've been a huge fan of the STC for a long time, but being based on the MACD means its signals often lag by a bar or two (especially in fast moving markets). All I've done here is take the base STC script (all credit to user @LazyBear), and change the source to a modified CCI.
The CCI Cycle provides more timely entries and exits, often by 1-2 bars. The flip side of the increased responsiveness is a prevalence for more false signals (a perfect example is the 17th August on the above chart). It's the nature of the beast! Still, I've been using this for a few months now and it's (in my opinion) an upgrade on the standard STC.
As always, you will need to pair this with another indicator or method of technical analysis to provide a trade bias, as the CCI Cycle (and STC) aren't designed to trade every signal. In my experience, either divergence identification, or using one or more moving averages works particularly well.
The indicator is also MTF capable, so you can get some interesting results from that.
Any queries let me know.
DD

Missile RSI (RSI of momentum w/ Dominant Cycle length + Fisher)This is a predictive indicator that looks for explosions in momentum of the cycles in price and large shifts in Momentum (Fisher turns the Bimodal PDF into Guassian like) as statistically unlikely events, showing points to exit or reverse positions.
You can adjust the lowpass frequency cuttoff (Aka what cycles you want to remove from the calculations through the super smoother filter).
To be honest you can monkey trade the direction of the Signal if you'd like but the Divergences and Maxing of the values is whats most useful.
Let me know if you guys want me to add anything else.

Ehlers Reverse Exponential Moving AverageEhlers Reverse Exponential Moving Average script.
This indicator was originally developed by John F. Ehlers (Stocks & Commodities V. 35:10: The Reverse EMA Indicator).

DFT - Dominant Cycle Period 8-50 bars - John EhlerThis is the translation of discret cosine tranform (DCT) usage by John Ehler for finding dominant cycle period (DC).
The price is first filtered to remove aliasing noise(bellow 8 bars) and trend informations(above 50 bars), then the power is computed.
The trick here is to use a normalisation against the maximum power in order to get a good frequency resolution.
Current limitation in tradingview does not allow to display all of the periods, still the DC period is plot after beeing computed based on the center of gravity algo.
The DC period can be used to tune all of the indicators based on the cycles of the markets. For instance one can use this (DC period)/2 as an input for RSI.
Hope you find this of some interrest.
Better RSI with bullish / bearish market cycle indicator This script improves the default RSI. First. it identifies regions of the RSI which are oversold and overbought by changing the color of RSI from white to red. Second, it adds additional reference lines at 20,40,50,60, and 80 to better gauge the RSI value. Finally, the coolest feature, the middle 50 line is used to indicate which cycle the price is currently at. A green color at the 50 line indicates a bullish cycle, a red color indicators a bearish cycle, and a white color indicates a neutral cycle.
The cycles are determined using the RSI as follows:
if RSI is overbought, cycle switches to bullish until RSI falls below 40, at which point it becomes neutral
if RSI is oversold, cycle switches bearish until RSI rises above 60, at which point it becomes neutral
a neutral cycle is exited at either overbought or oversold conditions
Very useful, please give it a try and let me know what you think


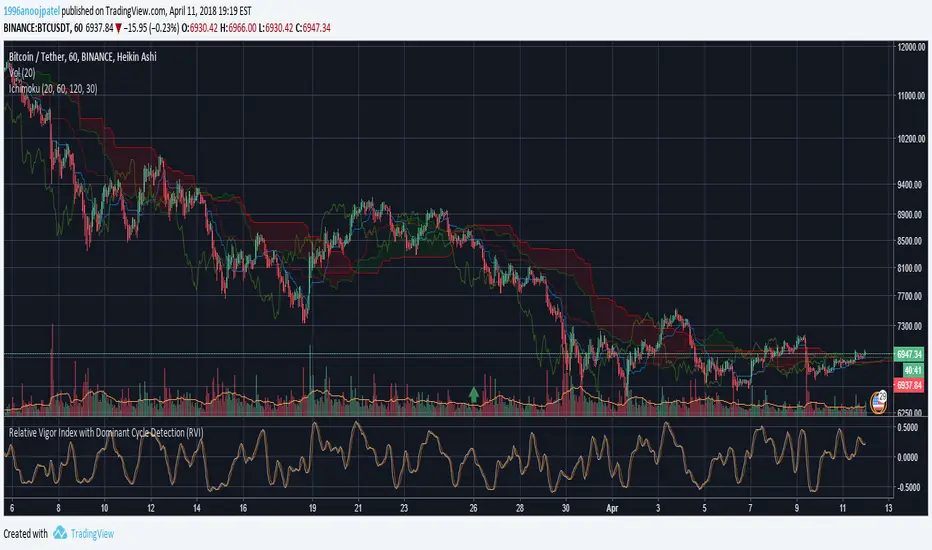
Relative Vigor Index with Dominant Cycle Detection (RVI)Relative Vigor Index with Dominant Cycle Detection. As Ehler's mentioned, fixed length look back is inherently flawed when it is possible to extract a length from a dominant price cycle. may be less effective if signal to noise ratio is greater than 2, but that usually would not happen at >5m candles, and honestly shouldn't be looking at RV(igor)I when price is moving sideways.
Read just like an RVGI, but adjusted to the current time frame. To reduce noise, changing to heiken ashi will help with signals as well. Let me know if there are improvements!
Made for JD, the OG.
The Perfect RSI (Ehler's Cycle RSI Modified with Discriminator)This is the RSI indicator that I use. It combines two concepts of John Ehler. It integrates the idea of Highpass filtering the Price data, along with the the idea of automatically determining the Dominant price cycle through a Homodyne Discriminator, and using half of a cycle length as the input for the RSI. Not only determines the most effective range for the RSI by setting it based on the cycle, but also makes the RSI PDF(Probability Distribution Function) adjustable as shown in John Ehler's papers. Still needs some tweaking on determining the best calculations for cycles, and whether or not to better filter the price data into the discriminator.
Works just like a normal RSI, but should have less false signals, and also has the option for super smoothing. Play around it and see if theres any new indications or signals that come from it ;)
Let me know if there's any concerns or additions!

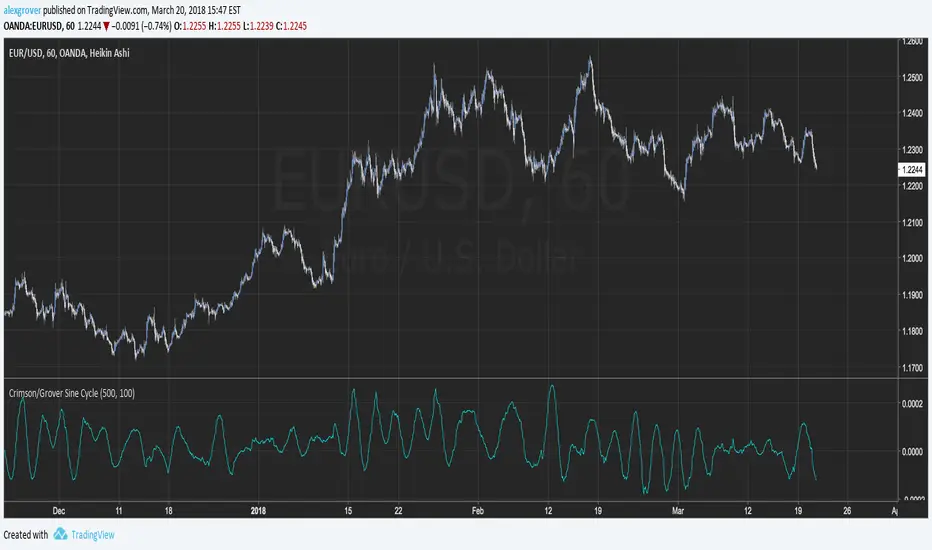
Crimson/Grover Sine CycleThere is plenty of indicators trying to show cycles in price, the majority of them create a stationary version of the price and then smooth it, the Crimson/Grover cycle use as source a pure sine wave of period crimson and then use a best fit line with y = price and x = sine wave.Some final transformations are mades for highlights the cycle of the price.
The length parameter control the regression period and the crimson parameter the period of the sine cycle.If the length is higher than the crimson period then the indicator is more smoother but give more liberty to the sine wave.
The period of sine wave is equal to period/(2*3.14) .
A sine wave of period 100
For any questions regarding the indicator please contact me :)
Wave Cycle StochasticThis is based of a modified stochastic numbers. The settings come from Barry Burn's foundation and advanced courses.
There are two stochastic indicators one on top of another. at the same time, you can turn off the lines and show the moving averages of percent D and percent K, this is something I added personally to farther investigate if they can be helpful or not.
Those who went through Barry's courses know that is oscillator is being used to find cycle high and cycle low in waves. Also Barry teaches what he calls mini-divergence and for that he uses this same oscillator. If you switch to weekly chart, the settings will automatically switch to those Barry teach for non 1 to 3 ratio situations so you don't need to worry about that. If seeing the higher time frame cycle indicator on the same oscillator is bothering you, you can again add another copy and only keep that one and turn off the rest.

Strawberry Trends (Cycles) 🍓A slightly modified Schaff Trend Cycle-like indicator that detects trends before standard MACD and STC. High values (near 100) indicate imminent break down, whereas low values (near 0) indicate imminent movement upwards. This should be used for coins/symbols that are currently cycling. You'll want to experiment with different time intervals (15/30/60 min charts) to get the best results for a specific currency.
Also strawberries.
Only tested on crypto.

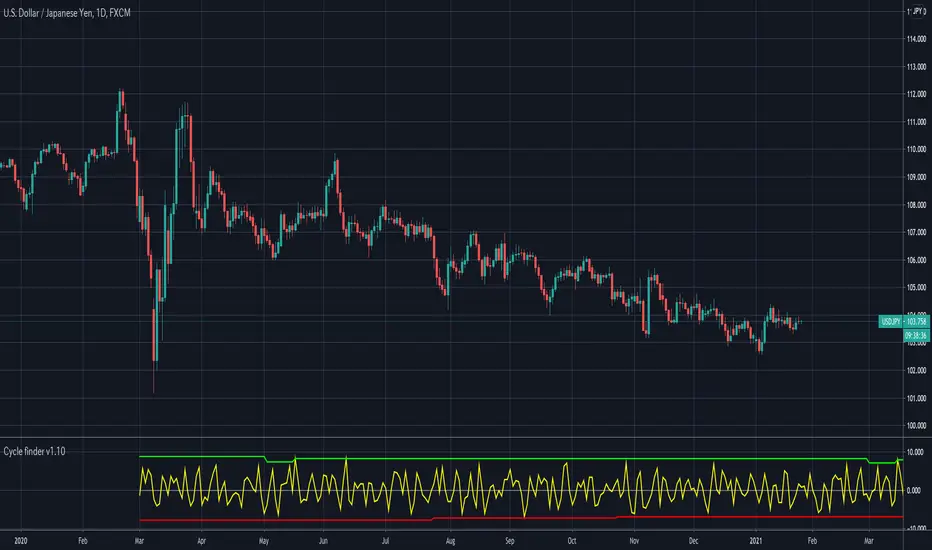
Cycle finder v1.0Watch this Morgan Stanley'(MS)'s almost perfect cycle!
This is Cycle finder v1.0.
This helps you to find cycle of your favorite stocks, commodities, forex and anything in real time.
Originally developed from scratch for tradingview.
How to use(in setting panel):
- Set up to 5 different cycle term.
- Set go back bars. *1
- Shift bars as you want to make use of cycle.
*1: This indicator compares X bar to X - (go back amount) bar to find cycle. Default: 2
*2: It won’t work if there is not enough history.
*3: This may contains some bugs since I'm still working in progress to improve.
Please give it try for 1 week free.
Message me or reply to here to unlock your experience!
//—————— Japanese below
このモルガンスタンレー(MS)のほとんど完璧なサイクルをご覧ください。
Cycle finder v1.0. をご紹介します。
Tradingview のために1から開発された、このインディケーターは
あなたのお気に入りの株、先物、FXなどのサイクルをリアルタイムに見つけるお手伝いをします。
使い方 (設定パネル):
- 5個までサイクルの期間を設定できます。
- 参照のバー数を設定 *1
- サイクルは左右にシフトできます。
*1: このインディケーターは、サイクルを見つけるために
Xバーと、X - 参照バー数を比べます。 デフォルトでは2です。
*2: チャートの履歴が少ない場合には、動きません。
*3: ブラッシュアップ中のため、バグを含む可能性があります。
ぜひ1週間無料でお試しください。
プライベートメッセージか、ここにご返信ください。
B3 Bar Cycle MTF (fix)Apologies, there was an error in printing for the thick gray boxes, happened when MTF was switched on. All better, and here is the details from before:
This is an interesting study that can be used as a tool for determining trend direction, and also could be a trailing stop setter. I use it as a gauge on MTF settings. If on, you can look at the bar cycle of the 1h while on the 15m giving you a lot of information in one tool. If a line is missing high or low, it is because it was broken, if both exist you are trading in range and cloud appears. If both sides break you get thick gray boxes above and below bar.
Get used to editing the inputs to suit your liking. Often 3-5 length and always looking at different resolutions to get a big picture story. You could put multiple instances of the study up to see them simultaneously. I based the idea off of Krausz's 3 day cycle which you can read about in his teachings. I tend to find it looking better using Heikin Ashi bar-style.

B3 Bar Cycle MTFThis is an interesting study that can be used as a tool for determining trend direction, and also could be a trailing stop setter. I use it as a gauge on MTF settings, in the pic MTF is turned off. If on, you can look at the bar cycle of the 1h while on the 15m giving you a lot of information in one tool. If a line is missing high or low, it is because it was broken, if both exist you are trading in range and cloud appears. If both sides break you get thick gray boxes above and below bar.
Get used to editing the inputs to suit your liking. Often 3-5 length and always looking at different resolutions to get a big picture story. You could put multiple instances of the study up to see them simultaneously. I based the idea off of Krausz's 3 day cycle which you can read about in his teachings. I tend to find it looking better using Heikin Ashi bar-style.

[RS]MTF Fibonacci Cycles V0EXPERIMENTAL:
Fibonacci rate levels based on price advance/decline, can be used to make visualizations of fib clusters or for cycles.
Ehlers Cyber Cycle Indicator [LazyBear]The Cyber Cycle Indicator, developed by John Ehlers, is used for isolating the cycle component of the market from its trend counterpart. Unlike other oscillators like RSI, Cyber Cycle Indicator's wave has a variable amplitude.
Use the osc/signal crossover for entry/exit points. You can enable highlighting the crossovers by using region fills (via options page). I have also added an option to color the bars based on this.
Actually I have lot of Ehlers indicators in my to-publish backlog, will try to prioritize them over the others in the pipeline. Lets have an Ehlers week for indicators :)
More info:
Cybernetic Analysis for Stocks and Futures
List of my public indicators: bit.ly
List of my app-store indicators: blog.tradingview.com
