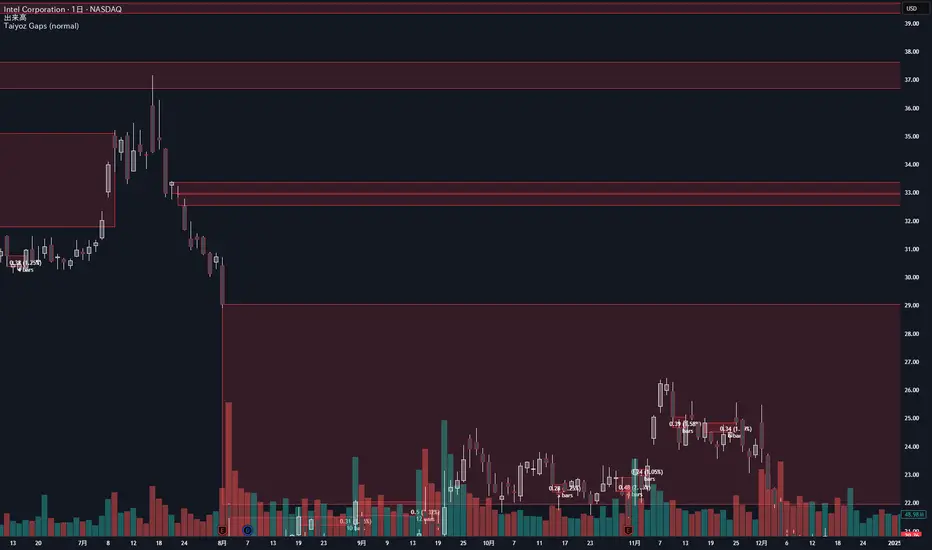
Taiyoz Gaps1. Purpose
Tyoz Gaps highlights “gaps” between yesterday’s close and today’s open directly on your chart. A gap occurs when the opening price is significantly above or below the prior bar’s close. By drawing persistent boxes around each gap, you can instantly see where price left a void and monitor when (or if) that void gets completely filled.
2. Gap Detection Logic
Threshold: A gap is only detected if the open-to-previous-close difference exceeds a user-defined “Minimal Deviation” (percentage of the 14-bar average high-low range).
Direction:
Gap Up: today’s open > yesterday’s close
Gap Down: today’s open < yesterday’s close
3. Box Drawing
For each detected gap, the script draws a rectangular box spanning from yesterday’s close level to today’s open level.
Border & Fill Colors are configurable separately for up-gaps and down-gaps.
Boxes extend to the right as new bars form.
4. Display & Filtering Options
Show Gap Up / Show Gap Down toggles let you hide bullish or bearish gaps independently.
Max Number of Gaps: Limits how many boxes remain on-screen; oldest boxes are removed when the limit is exceeded.
Limit Max Gap Trail Length: Optionally force-close any gap box after a given number of bars, even if unfilled.
5. Closing Logic
Full-Fill Only: A gap box stays visible until price fully “fills” it—i.e., for an up-gap, price must exceed the top edge (yesterday’s close); for a down-gap, price must cross below the bottom edge.
Once filled, the box is removed and a “Gap Closed” alert flag is set.
6. Labels & Alerts
Each active gap can optionally show a label at the gap’s lower edge containing:
Absolute size (in price points) and percentage of the gap
Bar count since the gap formed
Label Text Color and Label Text Size are both user-configurable.
Two built-in alertcondition()s fire when a new gap appears or when a gap closes.
Cycles
Bollinger Band Touch with EMA Filterbollomger band strategy above and below the 100 and above the 200

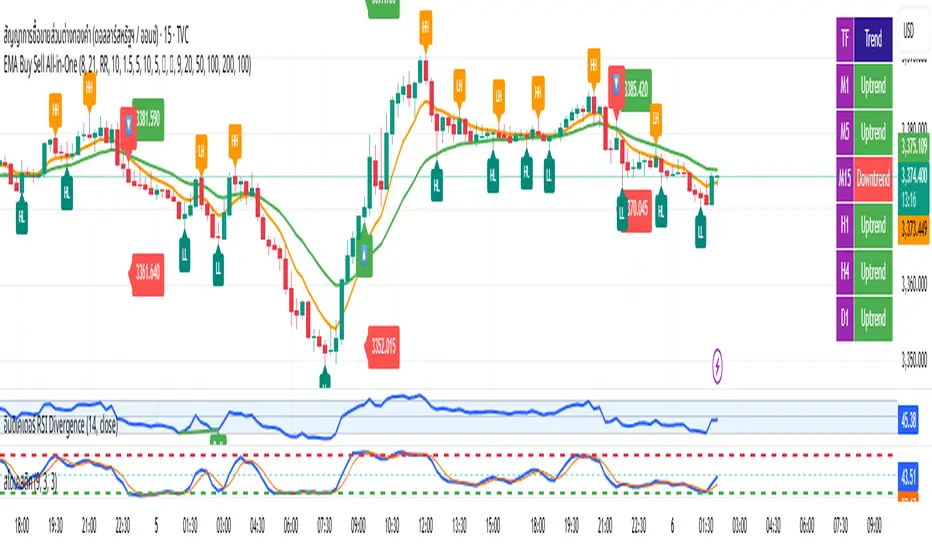
EMA Buy Sell All-in-One✨ Description (แนะนำให้ใช้ตอนกด Publish):
This all-in-one indicator combines several powerful trading tools into one script:
• EMA Cross Entry System: Customizable fast/slow EMA cross for buy/sell signals
• Dynamic SL/TP System: Choose between swing-based or custom SL/TP; auto-calculated RR support
• HH, HL, LH, LL Labels: Market structure points marked directly on chart (toggle ON/OFF)
• Multi-Timeframe Trend Table: Visual overview of EMA trends across D1 → M1 timeframes
• H1 Trend Change Icons: Alerts when the hourly trend flips direction
➤ Clean and responsive display
➤ Fully customizable via input panel
➤ Great for intraday or swing traders following trend + structure alignment
Feel free to fork or modify. Made for those who want clarity and confluence in one view.
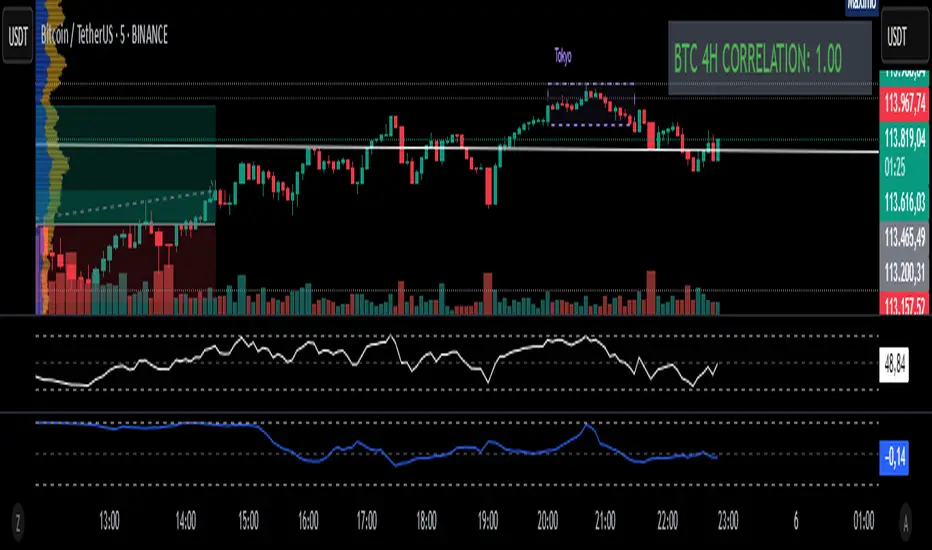
Fixed 4H BTC/Altcoins Correlation for Scalping
Fixed 4H Timeframe: The calculation is hardcoded to the 4-hour timeframe. This ensures the correlation value remains stable and relevant for structural analysis while you trade on lower timeframes.
Clean On-Screen Display: Instead of a separate plot line that can clutter the chart, the indicator displays the correlation value in a clean, simple table in the top-right corner.
Dynamic Coloring: The correlation value is color-coded for quick visual assessment:
Green: Strong correlation (> 0.70)
Yellow: Moderate correlation (0.30 to 0.70)
Red: Weak or negative correlation (< 0.30)
Customizable Inputs: Users can easily configure the BTC symbol (e.g., BINANCE:BTCUSDT, COINBASE:BTCUSD), the correlation lookback period (Length), and the price source (Source) to match their reference indicators or preferences.
Add the indicator to your chart (for example, a 5-minute chart of any altcoin).
The table in the top-right corner will immediately display the altcoin's current correlation to BTC, based on 4-hour data.
Use this value to gauge market sentiment. A high positive correlation suggests the altcoin is likely to follow BTC's moves. A low or negative correlation suggests the altcoin is moving independently.
For perfect synchronization with another standard correlation indicator, go to the script's settings (⚙️ icon) and ensure the Length and Source parameters are identical to your reference indicator.
This tool aims to bridge the gap between high-frequency trading and high-timeframe market structure, providing a crucial piece of information in a simple, stable, and accessible format.

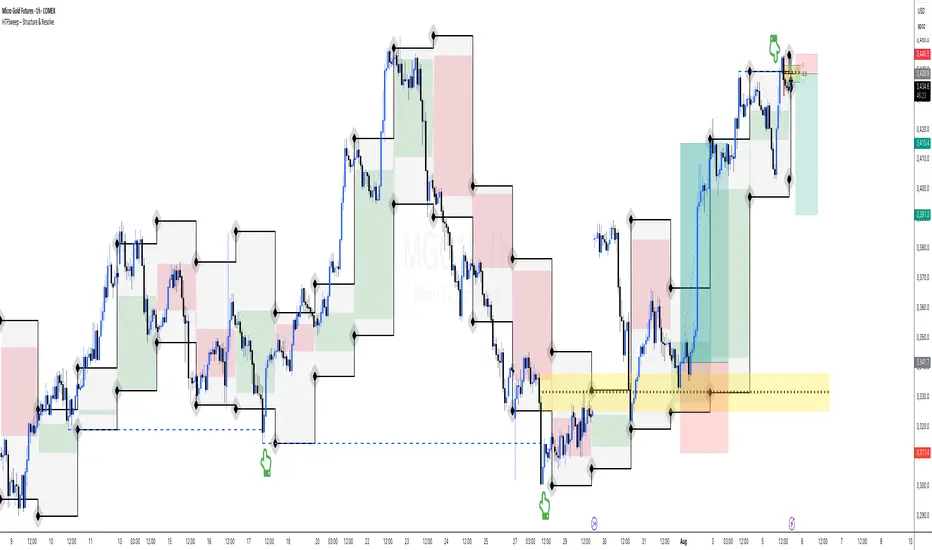
HTFSweep – Structure & ResolveThis indicator isolates higher timeframe Open, High, Low, and Close levels and projects them onto lower timeframes.
It is designed as a structural lens, not a trading signal — a tool for experienced operators who study how intraday price interacts with higher‑timeframe liquidity anchors.
Key Features:
Selectable higher timeframe (default: Daily).
Plots Open, High, Low, Close lines across intraday charts.
Bullish/Bearish candle bodies shaded for context.
Background fill between High and Low for zone visualization.
Purpose:
This script is not a “buy/sell” tool. It is a scope, intentionally minimal, highlighting a repeating place of structural and liquidity significance. Use it to track sweeps of higher‑timeframe levels and confirm structural shifts intraday.
⚠️ Disclaimer: This script provides market structure visualization only. It does not generate trading signals or financial advice.
COMEX_MINI:MGC1!
Period Highlighter ProPeriod Highlighter Pro is a versatile Pine Script indicator designed to visually highlight specific time periods on your TradingView charts, making it easier to analyze seasonal patterns, trading sessions, or specific weekdays. With customizable settings for months, weekdays, or intraday time ranges, this tool adapts to your trading strategy, allowing you to focus on key periods with precision.
Features
Flexible Highlight Modes: Choose from three modes to highlight:
Month Range: Highlight specific months or a range (e.g., March to June) for seasonal analysis.
Weekday Range: Highlight specific weekdays (e.g., Mondays or Monday to Wednesday) for weekly pattern analysis.
Time Range: Highlight daily time windows (e.g., 15:30–22:00) for intraday session analysis, restricted to weekdays.
Customizable Timezone: Set any IANA timezone (e.g., America/New_York, Europe/London) or UTC offset to align highlights with your preferred market hours.
Historical Range Control: Define how far back to apply highlights with options for years (Month Range), weeks (Weekday Range), or days (Time Range).
Visual Customization: Choose your highlight color to match your chart style.
User-Friendly Inputs: Intuitive dropdowns and tooltips guide you through configuring each mode, ensuring only relevant settings are adjusted.
How It Works
Select a highlight mode and configure the corresponding settings:
Month Range: Pick a start month and an optional end month (or "Disabled" for a single month) and set the number of years back.
Weekday Range: Choose a start weekday and an optional end weekday (or "Disabled" for a single day) and set the number of weeks back.
Time Range: Specify a start and end time (24-hour format) and the number of weekdays back. The indicator then applies a semi-transparent background color to chart bars that meet your criteria, making it easy to spot relevant periods.
Use Cases
Seasonal Traders: Highlight specific months to analyze recurring market patterns.
Day Traders: Focus on active trading sessions (e.g., New York open) with precise time range highlighting.
Weekly Pattern Analysts: Isolate specific weekdays to study price behavior.
Global Traders: Adjust for any timezone to align with your market of interest.
Why Use Period Highlighter Pro?
This indicator simplifies time-based analysis by providing a clear visual overlay for your chosen periods. Whether you're studying historical trends or focusing on specific trading hours, Period Highlighter Pro offers the flexibility and precision to enhance your chart analysis.
Licensed under the Mozilla Public License 2.0.
Stochastic MACDStochastic MACD Indicator: Quick Guide
This Pine Script indicator, "Stochastic MACD" (SMACD), blends MACD and Stochastic Oscillator principles to help you spot momentum shifts and potential reversals.
What it Shows:
SMACD Line: Tracks momentum.
Signal Line: Averages the SMACD line, creating crossovers.
Histogram: Visualizes momentum strength, changing color with direction.
Overbought/Oversold Levels: (Default 10 and -10) Help identify stretched market conditions. Adjustable in settings.
Visual Signals (Triangles):
Red Down Arrow (Overbought Signal): Appears when both SMACD and Signal lines are above the Overbought level (default 10) AND SMACD crosses the Signal line upwards. This suggests strong overbought conditions and a potential reversal down.
Green Up Arrow (Oversold Signal): Appears when both SMACD and Signal lines are below the Oversold level (default -10) AND SMACD crosses the Signal line upwards. This suggests potential buying opportunities from oversold conditions and a possible reversal up.
How to Use It:
Confirm Trends: Use the histogram and line directions.
Spot Reversals: Look for the red and green triangles for quick alerts.
Combine: Always use with other analysis like price action or support/resistance.
Important: This is an analytical tool, not financial advice. Trading involves risk.

AMOGH smc bo/bd - Delta Bot IntegrationAMOGH SMC BO/BD – Delta Bot Integration ek advanced Pine Script indicator hai jo CHoCH ke baad breakout/breakdown (BO/BD) entries detect karta hai. Ye structure flip, SL, aur smart alerts ke sath auto-trading bots ke liye optimized hai. Entry precision aur exit logic strategy-grade hai.

Confluence Indicator: Fib, MACD, SMA 50/200This is a scalping indicator best used on the 1hour and 15min charts


Power Metcalfe's + Fibonacci Channel## Metcalfe's Law + Fibonacci Channel - Optimized Bitcoin Valuation Model
This indicator presents an enhanced variation of the classic Bitcoin Metcalfe's Law model, combining logarithmic regression analysis with Fibonacci retracement levels to create a comprehensive valuation framework.
**Key Features:**
- **Optimized Metcalfe's Law calculation** using historical cycle data (2013-2022) for improved accuracy
- **Fibonacci channel overlay** with key levels: 0.382, 0.618, 1.272, 1.618, 2.000, 2.618, 3.000
- **Dynamic trading zones** with visual buy/sell signals based on price position relative to the channel
- **Real-time targets** displaying current Fibonacci projections and fair value estimates
**What makes it different:**
Unlike standard Metcalfe's Law implementations, this version integrates logarithmic growth principles and uses a refined dataset that accounts for Bitcoin's maturation cycles. The Fibonacci overlay provides clearer entry/exit points while maintaining the long-term growth trajectory based on network adoption.
**Best suited for:** Long-term Bitcoin holders and macro traders looking for mathematical support/resistance levels based on network adoption dynamics and scarcity.
The model automatically updates calculations and provides a comprehensive information table showing current formula parameters and key price targets.

WaveTrend LazyBear + BUY/SELL Labels (Custom Color)WaveTrend LazyBear + BUY/SELL Labels (Custom Color)

Mig Trade Model - Kill Zones
Key features:
Liquidity Hunt Detection: Spots aggressive moves that "hunt" stops beyond recent swing highs/lows.
Consolidation Filter: Requires 1-3 small-range candles after a hunt before confirming with a strong candle.
Bias Application: Uses daily open/close to auto-detect bias or allows manual override.
Kill Zone Restriction: Limits signals to London (default: 7-10 AM UTC) and NY (default: 12-3 PM UTC) sessions for better relevance in active markets.
This strategy is inspired by smart money concepts (SMC) and ICT (Inner Circle Trader) methodologies, aiming to capture venom-like "stings" in price action where liquidity is grabbed before reversals.
How It Works
ATR Calculation: Uses a user-defined ATR length (default: 14) to measure volatility, which scales candle body and range thresholds.
Bias Determination:
Auto: Compares daily close to open (bullish if close > open).
Manual: User selects "Bullish" or "Bearish."
Strong Candles:
Bullish: Green candle with body > 2x ATR (configurable).
Bearish: Red candle with body > 2x ATR.
Small Range Candles:
Candles where high-low < 0.5x ATR (configurable).
Liquidity Hunt:
Bullish Hunt: Strong bearish candle making a new low below the past swing low (default: 10 bars).
Bearish Hunt: Strong bullish candle making a new high above the past swing high.
Signal Generation:
After a hunt, counts 1-3 small-range candles.
Confirms with a strong candle in the opposite direction (e.g., strong bullish after bearish hunt).
Resets if >3 small candles or an opposing strong candle appears.
Kill Zone Filter:
Checks if the current bar's time (in UTC) falls within London or NY Kill Zones.
Only allows final "Buy" (bullish entry) or "Sell" (bearish entry) if bias matches and in Kill Zone.
Plots:
Yellow circle (below): Bullish liquidity hunt.
Orange circle (above): Bearish liquidity hunt.
Blue diamond (below): Raw bullish signal.
Purple diamond (above): Raw bearish signal.
Green triangle up ("Buy"): Filtered bullish entry.
Red triangle down ("Sell"): Filtered bearish entry.
Inputs
Bias: "Auto" (default), "Bullish", or "Bearish" – Controls signal direction based on daily trend.
ATR Length: 14 (default) – Period for ATR calculation.
Swing Length for Liquidity Hunt: 10 (default) – Bars to look back for swing highs/lows.
Strong Candle Body Multiplier (x ATR): 2.0 (default) – Threshold for strong candle bodies.
Small Range Multiplier (x ATR): 0.5 (default) – Threshold for small-range candles.
London Kill Zone Start/End Hour (UTC): 7/10 (default) – Customize London session hours.
NY Kill Zone Start/End Hour (UTC): 12/15 (default) – Customize New York session hours.
Usage Tips
Timeframe: Best on lower timeframes (e.g., 5-15 min) for intraday trading, especially forex pairs like EURUSD or GBPUSD.
Timezone Adjustment: Inputs are in UTC. If your chart is in a different timezone (e.g., EST = UTC-5), adjust hours accordingly (e.g., London: 2-5 AM EST → 7-10 UTC).
Risk Management: Use with stop-loss (e.g., beyond the hunt low/high) and take-profit based on ATR multiples. Not financial advice—backtest thoroughly.
Customization: Tweak multipliers for different assets; higher for volatile cryptos, lower for stocks.
Limitations: Relies on historical data; may generate false signals in ranging markets. Combine with other indicators like volume or support/resistance.
This indicator is for educational purposes. Always use discretion and proper risk management in live trading. If you find it useful, feel free to share feedback or suggestions!
