3x EMA fast, 3 x MA slow + BB + PsarThis is a trend system which combines multiple fast EMA + mulitple slower SMA together with bollinger band channel and PSAR.
For entry rules the ones that I use are:
Long
We are inside BB channel, psar is ascending, and our close is above all moving averages or below all EMA'S + 1 SMA
WE can exit either when our close is below all EMA's or when PSAR is descending or when we hit upper/lower BB levels
Short
We are inside BB channel, psar is descnending, and our close is below all moving averages or below all EMA's + 1 SMA
WE can exit either when our close is above all EMA's or when PSAR is ascending or when we hit upper/lower BB levels
If you have any questions, let me know
Daily Charts

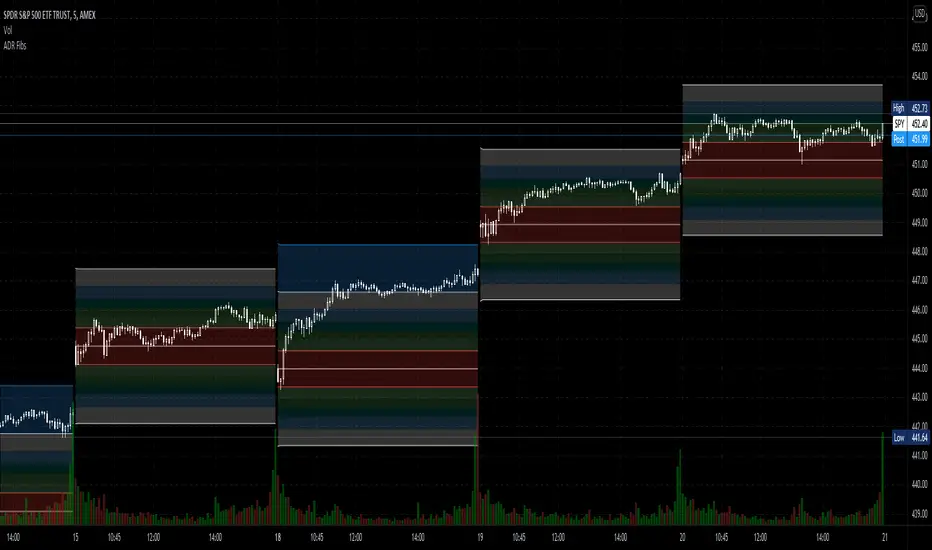
Average Daily Range Fibonacci LevelsThe Average Daily Range is a simple concept, calculated as the difference between daily highs and lows averaged over some period. This indicator uses that range in conjunction with Fibonacci ratios to create zones centered on the day's open that tends to act as areas of support and resistance.
The thicker White lines are the ADR levels; all other lines are the same value adjusted by the various Fibonacci values.
A simpler version of this concept can be seen in my other script, Average Daily Range Zones, which does not include the Fibonacci ratio zones.
Thanks to @Hank Hill for the original idea and TV for the feedback and support on the use of the security() function.
Also thanks to @GoldenCross for the Fibonacci obsession.
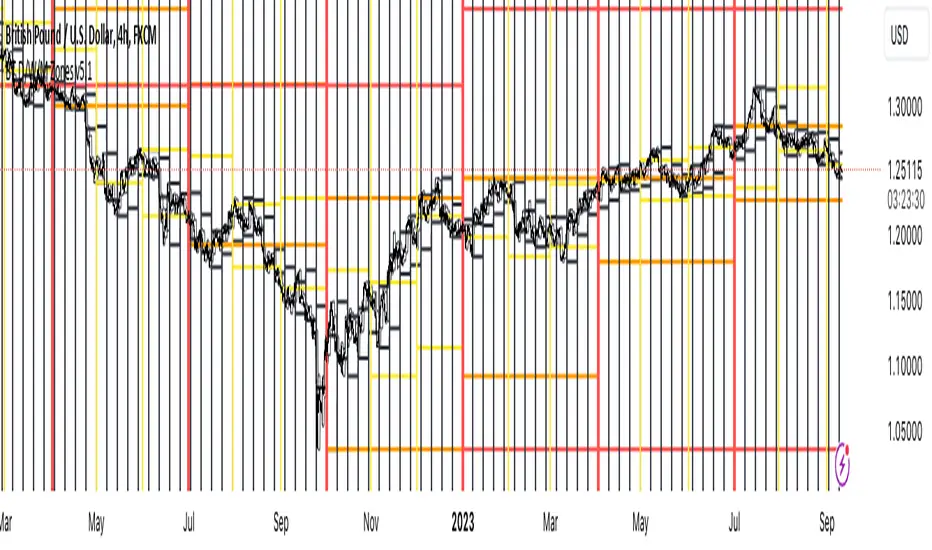
Naked - Daily Weekly MonthlyUser request for Naked Daily Weekly Monthly Opens.
This indicator plots the Daily Weekly Opens (the day after day after creation), they then will stay on the chart until a candle close is completed on the other side of the plot.
In the above chart picture you can see how previous monthly and daily opens have acted as support and resistance.
Thanks go to:
StackOverFlow Bjorn Mistiaen
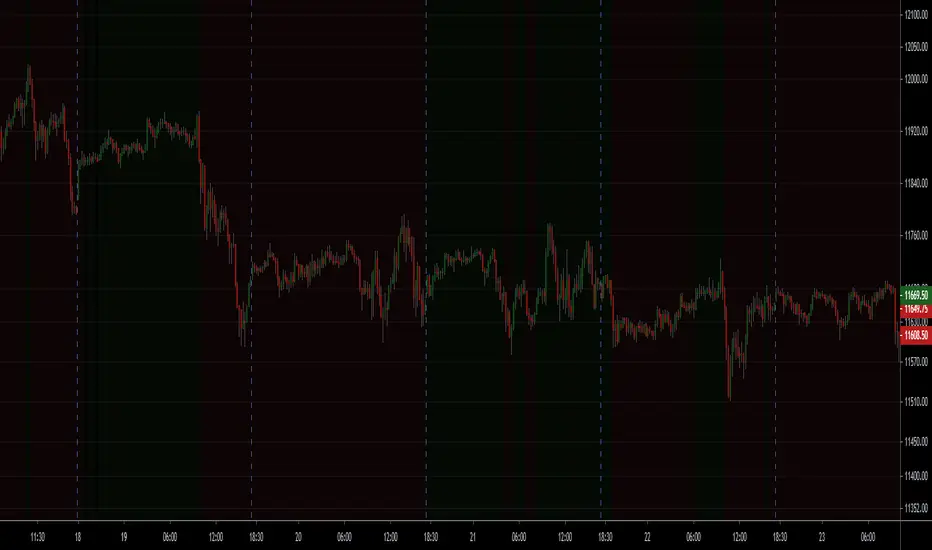
Daily SeasonalityDay trading trend filter indicator designed to hep get better entries or exits based on historical opens and closes each hour.
This indicator is NOT designed as an entry or exit signal. The purpose behind it is to give you statistical information about how likely certain times of day are either bullish , bearish or neutral and use that to confirm or reject other trading signals.
For example you might be anticipating a breakout based on your strategy or another indicator but see that the next few days are usually bearish and re-evaluate entering the trade.
The Daily Seasonality indicator calculates the percentage of candles per day of the week that had a higher close than open.
Default settings are:
- a look-back of 52 weeks (1 year).
- extreme bullish ( bright green) above 74%
-extreme bearish ( bright red) below 25%
- bullish (green) above 55%
- bearish (red) below 45%
- neutral (white) exactly 50%
- no trend (gray) 46% - 54%
All of these are updatable via the settings.
This indicator is designed to work only on the Daily timeframe.

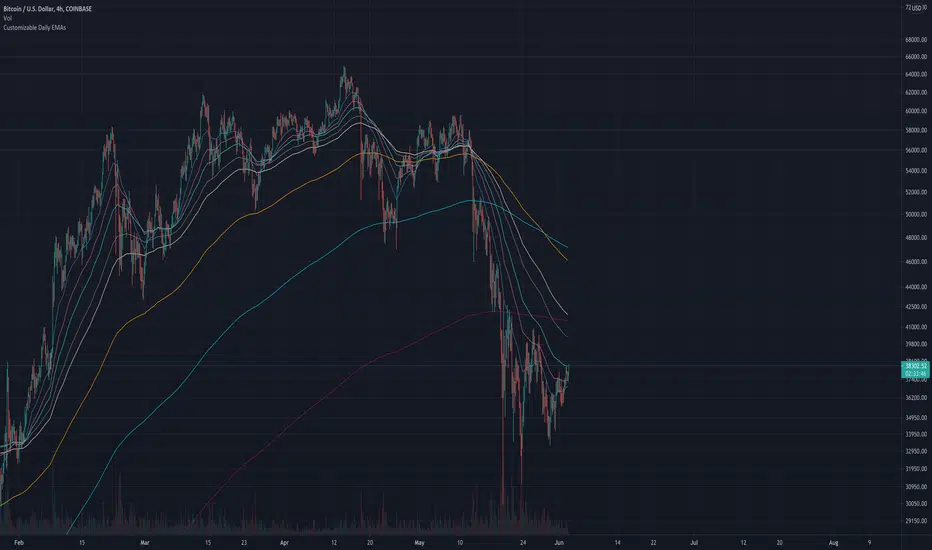
Customizable Daily EMAs (up to 8)This indicator provides you with up to 8 different EMAs that are customizable.
You can specify how many EMAs you want on the chart (up to a maximum of 8), as well as the length and color of each EMA. In addition, the resolution of all EMAs can also be customized - by default all EMAs follow the Daily timeframe but you could set this to any timeframe you want or you could choose for it to follow the timeframe chart as most other EMA Indicators do.
The reason for creating this indicator is because I was looking for Daily EMAs, but wanted to view the chart in a different time period without the EMA lines themselves changing. In addition, I wanted to view ample EMAs at once, and have the ability to change their length as I see fit.
You can see this demonstrated on the 4-hour chart above. Despite the chart being a 4 hourly chart, the EMAs are Daily EMAs.
In the example above all 8 EMAs have been activated, but you could turn any of these off to suit your own preferences.
The default EMAs are set to the following: 20, 50, 100, 200, 5, 9, 13, 26.
The First 4 are ideal for longer-term targets, while the smaller timeframes are more suited to short-term trading targets.
I have made this script Open-source for anybody to view, copy and modify if they need.
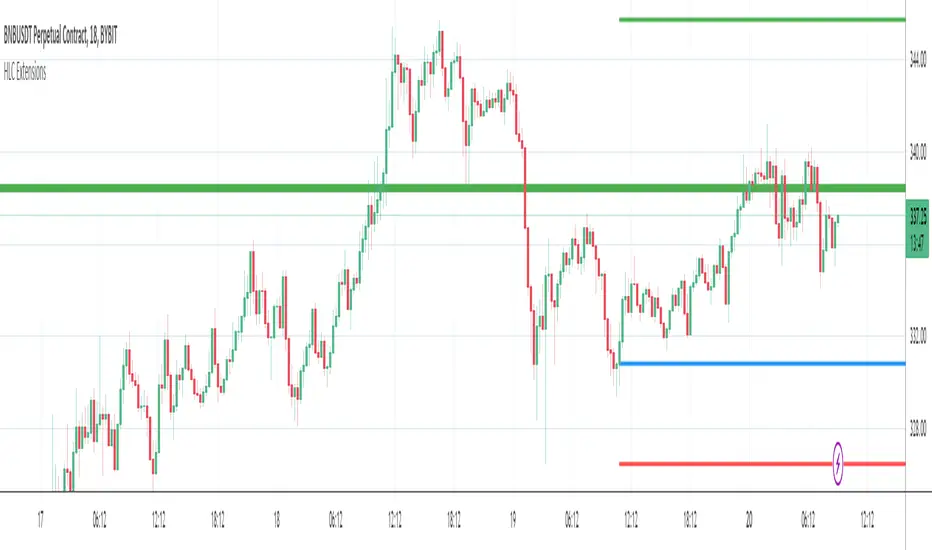
Yesterdays & Last Weeks High Low Close ExtensionsPlots the Extensions of Yesterdays and Last Weeks High Low Close
Unfortunately all of the levels wont always show therefore it is good use this in conjunction with my Levels script
I tried to combine the 2 scripts but doing so gave me memory overload errors in Tradingview thats why I have made them separate
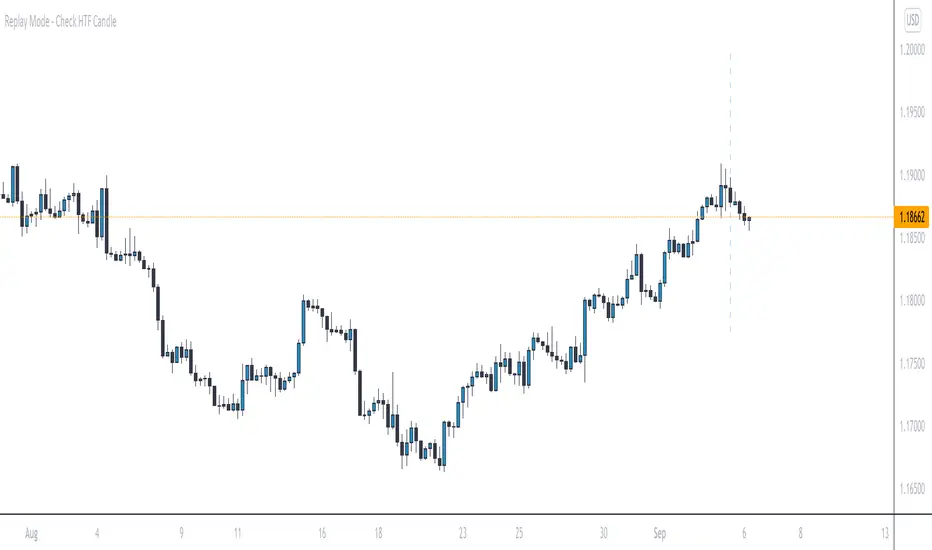
Replay Mode - Check HTF CandleThis indicator is intended to be used while using Replay Mode.
A vertical line will be drawn when you can safely check the 4H, Daily, or Weekly candle without seeing future price.
It is similar to the built-in Session Breaks, but has the benefit of not needing to remove one candle before checking the Daily.
When the line is the color of your 4H settings, it is safe to check the 4H candle.
When the line is the color of your Daily settings, it is safe to check the 4H and Daily candles.
When the line is the color of your Weekly settings, it is safe to check the 4H, Daily and Weekly candles
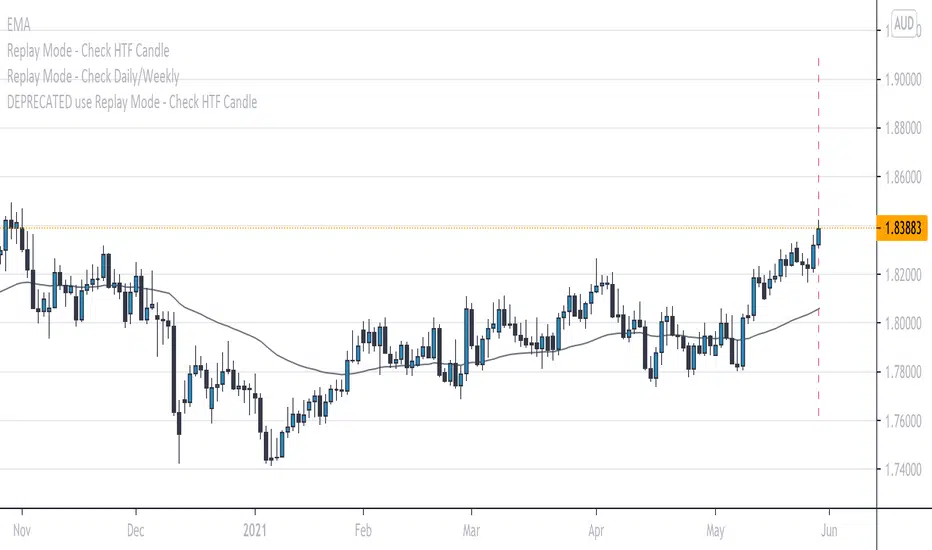
Replay Mode - Check Daily/WeeklyThis indicator is intended to be used while using Replay Mode.
It is similar to the built-in Session Breaks, but has the benefit of not needing to remove one candle before checking the Daily.
When on an intraday chart (timeframe less than Daily), a vertical line will be drawn when you can safely check the Daily or Weekly candle without seeing future price.
When the line is the color of your Daily settings, it is safe to check the Daily candle.
When the line is the color of your Weekly settings, it is safe to check both the Daily and Weekly candle.
Stepping MAInput desired timeframe and etc
Ex: Timeframe Daily
Input 100
Will display daily moving of 100 on every timeframe

Daily High & Low BoundaryDisplays the day's progressive high and low of the day colorized by the day of the week.

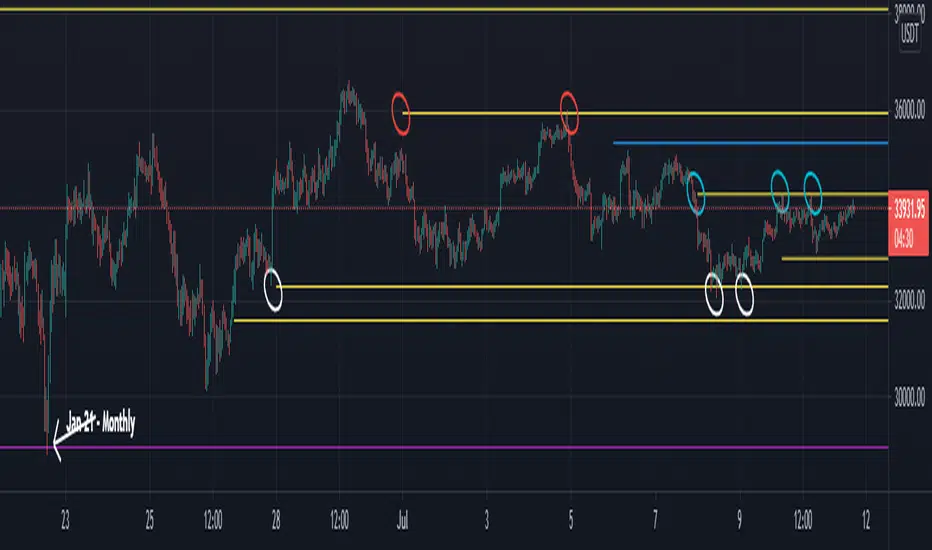
Key Levels SpacemanBTC IDWMKey levels, plotted automatically
Additional timeframes can be added on request
Useful for seeing strength of the trend in the market

Sessions (Nephew_Sam_)Indicator combines the 3;
1. 3 Sessions - with an option to set your own times
2. 4 Killzones- with an option to set your own times
3. Daily Dividers
If you dont want any of the the above or want to decrease your killzones, just uncheck the relevant checkbox under settings - inputs/colors.
Note: Most of this code it taken from other open source scripts, therefore I will leave this as an open source code too.

Weekly/Daily/Hourly/Minutes Colored Background IntervalsThis is my "Weekly/Daily/Hourly/Minutes Colored Background Intervals" assistant. I wouldn't describe it as an indicator, it just exhibits coloration of referenced periods of time with bgcolor() in Pine. With the arrival of 2021, I pondered the necessity of needing a visualization pre-2021 to visually recognize periodicity of market movements by the week, day, hour, or an adjustable period of minutes. While this script is simply generic, I hope you may find useful in your endeavors as a member on TradingView.
Explaining the script's usage, the "Minutes" input can be adjusted from anywhere between 5-55 minutes for only intraday. This can be modified to accommodate 90 minutes (1.5hrs) or any other minutes period desirable by tweaking certain numbers up to 1440. Minutes and Hourly backgrounds are disabled by default for most daily traders. Changing the input() code to `true` will provide them on by default when the script loads, if you choose that route. Each time periods background color is enable/disable capable. All of the colors are easily adjustable to any combination you can ponder for your visual acuity with the color swatch provided by input(type=input.color). The coloring can be "swapped" by input() depending on how you wish to start and end the day visually. I thought this would come in handy. The weekly background can have different starting points, whether it be Sunday, Monday, or any other day such as Friday for example.
The entire script's contents isn't intended for complete re-use as is for publicly published scripts. It's more along the lines of code that could be used to personally modify indicators you have, depending on the time frames you may actually be trading on. The code is basically modular, so you can use bits and pieces of it in your personally modified Pine Editor scripts that you wish to customize for yourself. I will say that the isXxx() functions are completely reusable in any script without any need for author permission inquiries from me, as easy as copy and paste. Those may come in handy for many folks. If you find them useful in certain circumstances, use isXxx() functions as you please. Day of the week detection by functions will have applications beyond my current intended use for them.
Of notable mention, this is a miniature lesson by example of how the new input(type=input.color) may be used. I'm also using `var` inside functions to aid in computational efficiency of the script runtime. The colors are permanently stored at the very beginning of the scripts operation inside the function and just reused from that point onward. Its a rare use case, but well suited for this scripts intention. Once again I have demonstrated the "Power of Pine" for developers of any experience level to learn from via code elegance.
When available time provides itself, I will consider your inquiries, thoughts, and concepts presented below in the comments section, should you have any questions or comments regarding this indicator. When my indicators achieve more prevalent use by TV members , I may implement more ideas when they present themselves as worthy additions. Have a profitable future everyone!

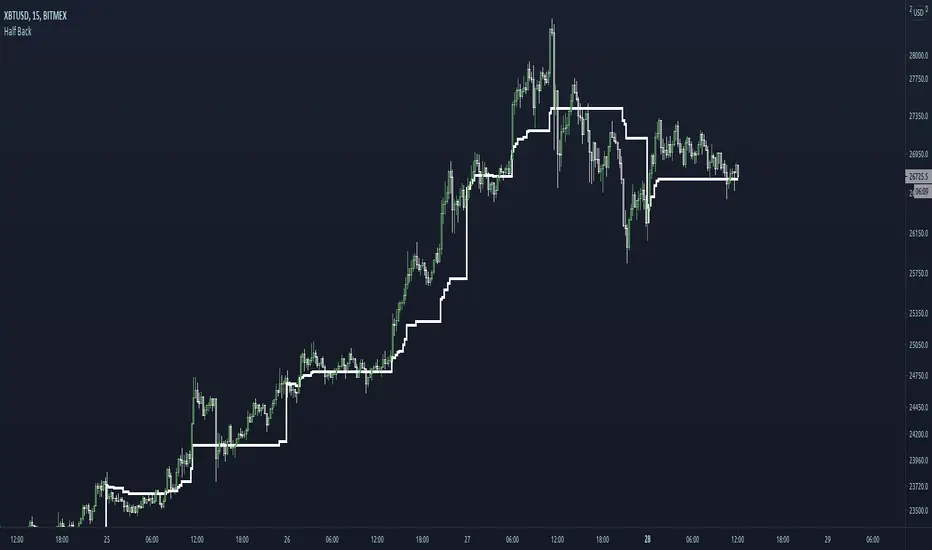
Half BackA dynamic intraday midpoint for Day Timeframe trader reference.
Midpoint is halfway between the day's highest high and lowest low.
Midpoint resets daily.
Key Levels TheHuntThis indicator is made to show you some key levels on the chart on the different timeframes. You can hide them or show them in the settings. The levels are the Monthly Weekly and Daily opens, current monthly, weekly and daily high / low, last weeks high / low & last daily high / low as well as Monday high and low. These levels can be used as key pivots or key liquidity areas. You can also adjust the time to also use the correct Mon range for forex pairs.
As you can see on the chart, that is how the levels show up on the chart.

NSDT Background Bear Bull DayA very basic script that changes the background color of the chart to Green if the price closes over the previous day close, and to Red if the price closes under the previous day close. This allows you to easily see if it is currently a Bull or Bear market with a glance. Alerts added.
EOD TraderMy EOD (End of Day) system for trading on the daily timeframe with minimum stress. Just pair the built-in alerts with the bot of your choice and then let the indicator do the rest. It'll determine the current trend, filter out as much noise as possible and then take you from long to short.
There are options to toggle the following:
Auto fibonacci levels with alerts for the look-back period of your choosing
Auto support and resistance with alerts
Alerts for the price closing above/below the 50MA
A coloured background to show the trend direction (green = up, red = down)
The fib and support levels can be handy when trying to determine when best to take profit or even exit the trade entirely.
Important: I personally use Heikin Ashi candles with this script to further filter entries. An option is available within the script settings to toggle this on/off should you wish to do the same.
This is a premium script. Please DM me for access.

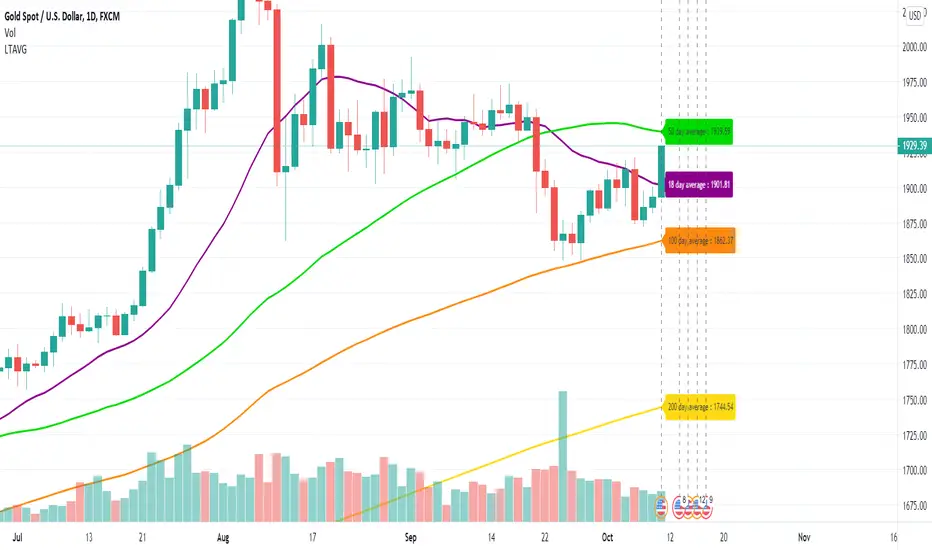
Long Term Moving AverageThis scripts plots the long term moving average calculated daily for 4 sets.
The default averages are:
18 day
50 day
100 day
200 day
The settings can be used to flexibly change this and to hide / show labels
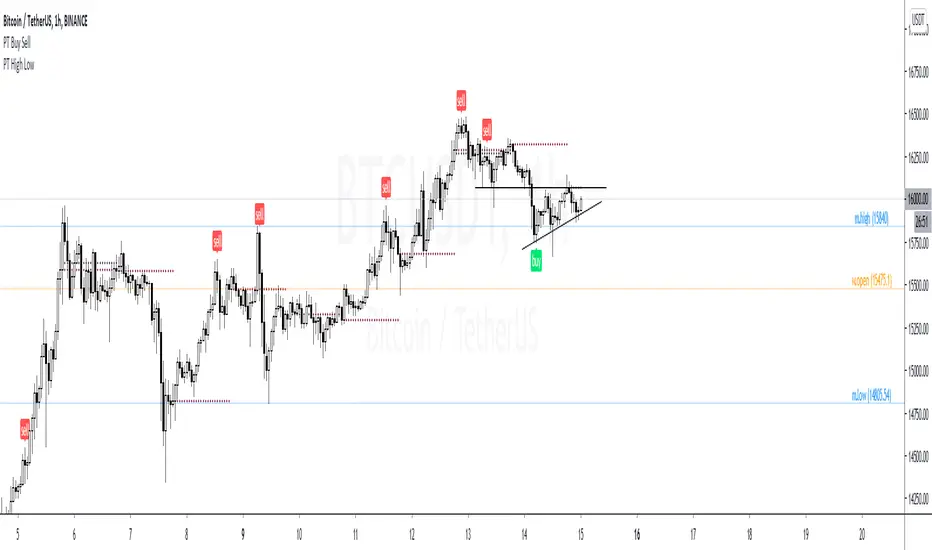
PT High Low Version 1.0 of our PT High Low indicator helps create a visual for the Daily, Weekly, Monthly & Yearly range. These levels will give you an idea of where the price can react if reached. Consider them pivotal areas. We included a toggle that will help you go between the candle's High/Low to the candle's Open/Close. Both features are unique when scalping & swinging. The High/Low will paint a beautiful visual for your day to day trading & the Open/Close will help you determine where price maxed opened & closed for that specified timeframe.
Strategy:
Price tends to gravitate between the Daily level when playing intraday scalps. If playing the weekly, you want to be above the weekly pivot to punt longs & under the weekly level to punt shorts. More likely than not, when the price hits a monthly or yearly level, we get a noticeable reaction off it.
This Oscillator was built around our buy sell indicator & it is used on all time frames for swinging & scalping. It is included as part of the library. Just message us for access!
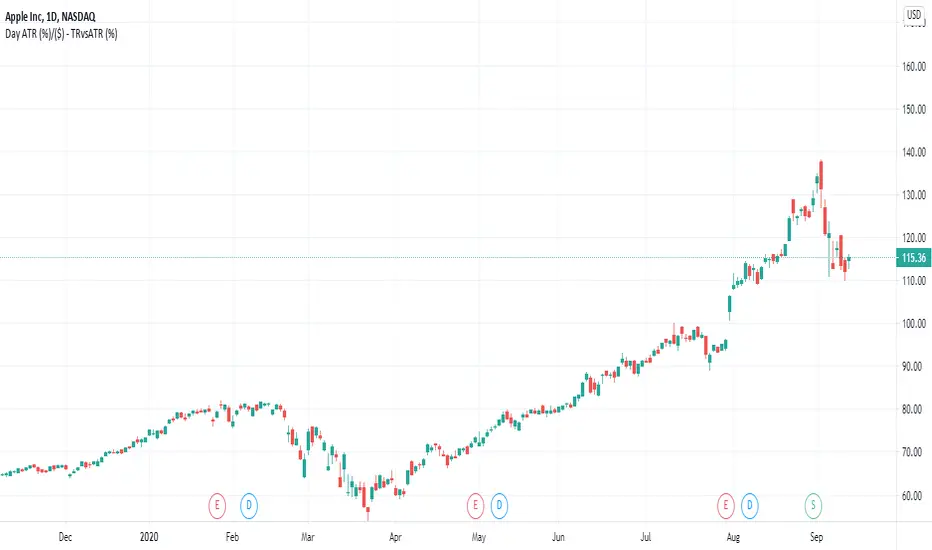
Daily Average True RangeThis script should give you a quick idea how far your stock has moved intraday compared to the ATR.
Daily Range 1) Daily high - low range as a column chart
2) If differentiates the days of the week, Wednesday - Blue, Thursday - Red

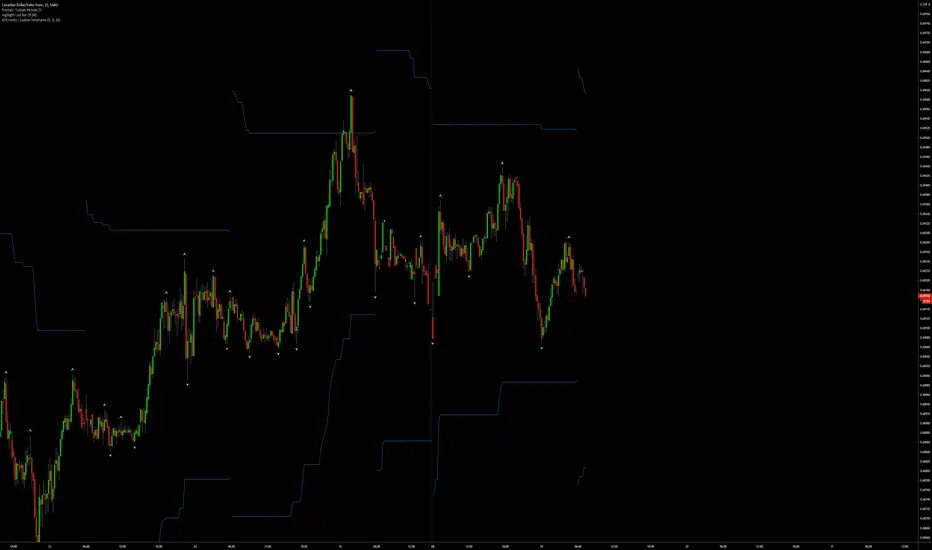
ATR Limits | Custom Timeframe | Day | Week | Month | H4 | H1Marks out the ATR limits for your own custom selected timeframe
Allows you to set an "Exact Distance" for the ATR.
Note:
If the "Exact Distance" is set = 0
then an ATR will be calculated for you based on an average of the "ATR Periods"
i.e. By Default: atr(20)
Otherwise if "Exact Distance" is not = 0
then ATR limits will be calculated using your specified distance
E.g. Exact Distance = 0.5
Low of Day = 1.0
High of Day = 1.1
ATR Limit Low = 1.1 - 0.5 = 0.6
ATR Limit High = 1.0 + 0.5 = 1.5
Enjoy!
BT D/W/M SeparatorsThis will print vertical lines for Daily/Weekly/Monthly open and close times. Also highlighting the days of the week including weekends for the crypto lovers :-)