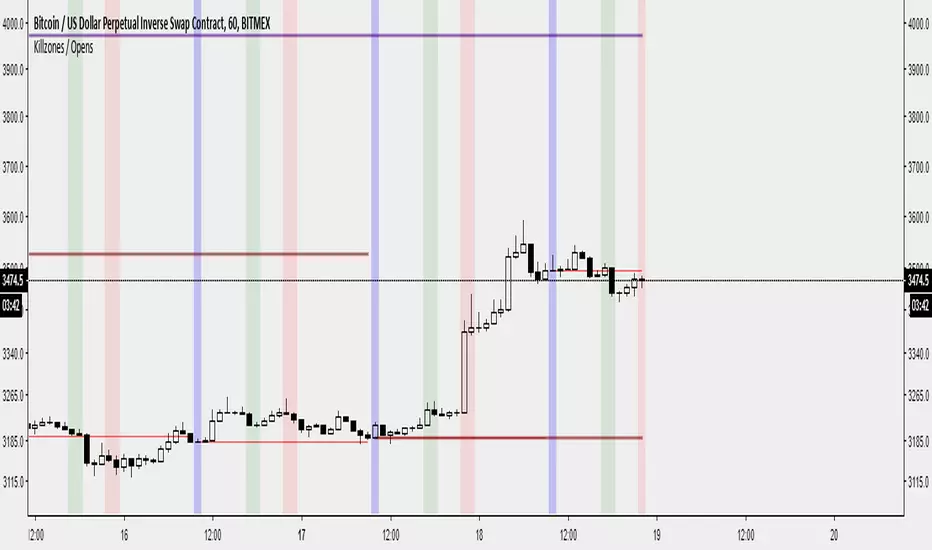
Killzones / Daily Open / Weekly Open / Monthly Open by @bartbtcI've created an indicator that :
- Displays the previous day's, week's, month's open on the current period's price action.
- Displays a vertical bar at the daily open. (The first 30-60 minutes from the daily open is commonly where the high/low of the day is made)
- Displays London/NY opens as vertical bars (london close is an option, but I have disabled it by default. I have removed Asia as I believe it is not useful - deal with it!)
Features:
- Displays daily data/killzones only on timeframes lower than 60minutes (you can modify this in the settings as you wish)
- Displays weekly open only on timeframes lower than weekly
- Displays monthly open only on timeframes lower than monthly
Let me know on Twitter on @bartbtc if there's any issues or if you have any other features you think might be useful.
Daily Charts
MWD_XO_OPENSCreated by TraderX0 & Stingray
Helps you plot the Monthly, Weekly, and Daily Opens quickly on your chart; Open the options menu to adjust colors and toggle time-frames(M/W/D) on/off.

Daily Moving AveragesPlots the 20, 50, 100 & 200 daily moving averages on any lower timeframe, but it uses a custom function to calculate the plots rather than using the security() function, so the lines are smooth rather than jagged.
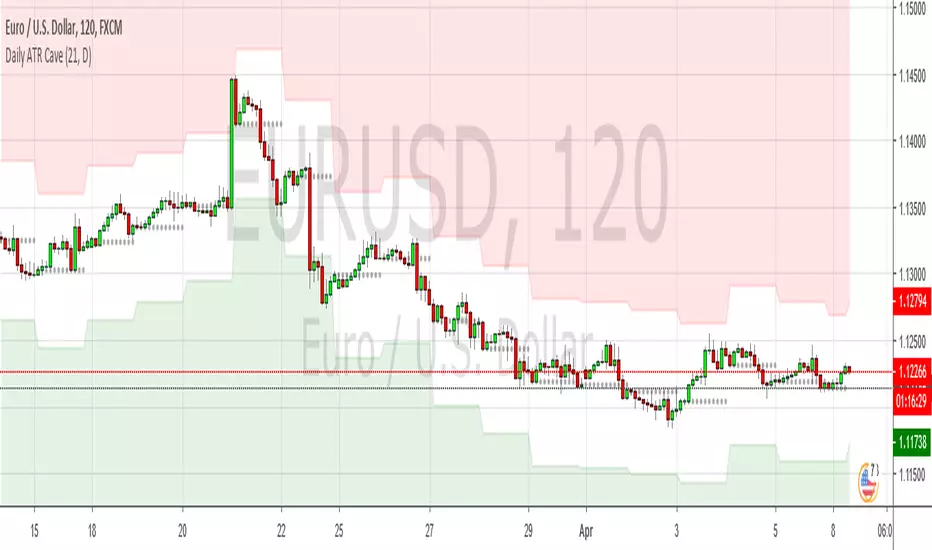
Daily ATR CaveSimilar to the RSI Cave idea, this plots daily Average True Range values on lower timeframes, as well as the daily open level, which is show as a grey dotted line. Basically a simple way to visualise basic mean reversion stuff
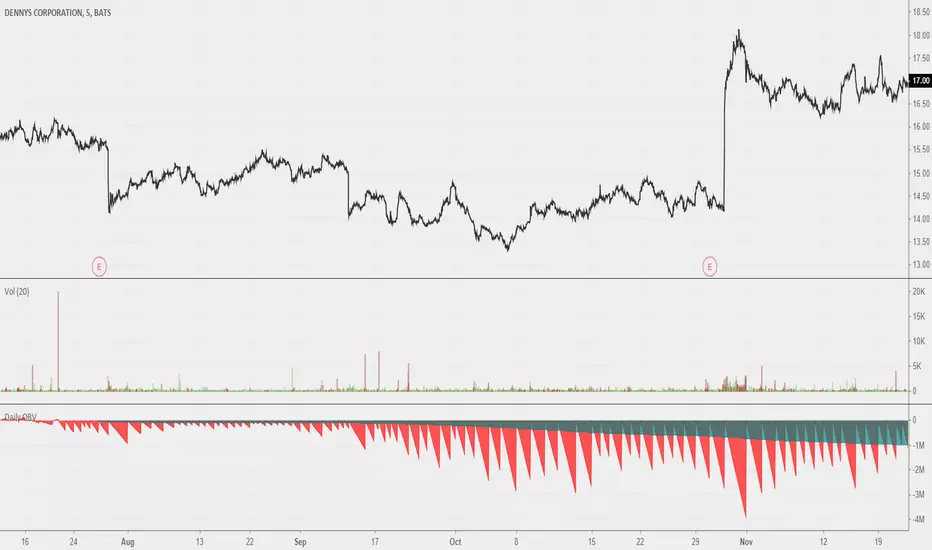
Daily OBVOBV that should reset on a daily session break. Looks neat when you scroll out all the way. Good use remains to be found; I believe this could be a useful reference for a more fleshed out idea for 'local zone' OBVs. Maybe comparing previous sessions' daily OBVs to current.
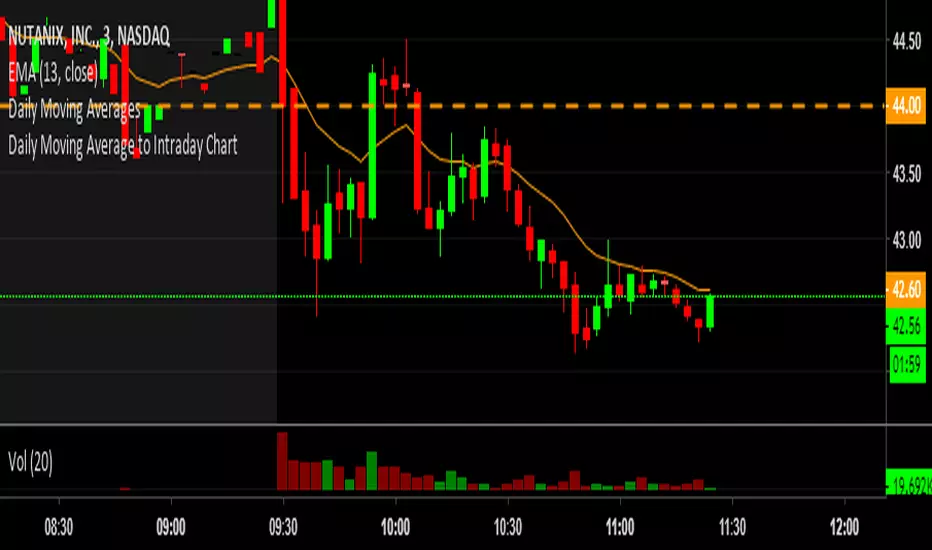
Daily Moving Average to Intraday ChartThis is going to include the 20EMA, 100SMA and 200SMA automatically into your intraday charts.
50-100-200 Day SMAA simple indicator that display the 50, 100, and 200 Daily SMA. It will always display the DAILY 50,100, 200, regardless of the time frame you are looking at. Makes it easy to quickly display these key averages while also looking at smaller timeframes like 1H candles.

Pivot Points (with Mid-Pivots)Brief Description
Pivot points are horizontal support and resistance lines placed on a price chart. They make strong levels of support and resistance because banks, financial institutions and many traders use them.
The indicator is set to the Daily Pivot Range by default (no support for weekly, monthly, quarterly, or yearly Pivots).
Indicator Settings
Show Mid-Pivots?
Show R3 and S3 levels?
Key Levels [@treypeng]Draws horizontal lines for Daily, Hourly (1) and Weekly levels. Really handy to switch on quickly when scalping.
Light blue: Previous hour OHLC
Thick light blue: Previous hour Close / current hour Open
Dark blue: Yesterday OHLC
Thick dark blue: Yesterday Close / today Open
Purple: Weekly Open
It's a bit ugly, I'd prefer horizontal rays instead of lines stretching back across the chart but I couldn't figure out how to do this in PineScript. If I get it sorted, I'll publish an update.

Daily Exponential Moving AveragesTired of wasting countless hours switching back and forth between timeframes?
Worry not! For only 499.95$ now you can... Oh wait this script took me 5 minutes I can't sell that.
The idea is priceless thought.
This is a very basic script that lets you view 2 daily exponential moving averages from any timeframe (you won't see much from higher timeframes thought).
To see the 1 hour regular divergence at the top you would still need to check the 1 hour.
I recommend having a vague idea of the trend on daily/weekly chart and then looking only at 4 HR with daily indicators on it like with this script + maybe if you want you might use the 1HR chart for confirmation or to try and pinpoint the best place to enter.
No matter what your holding periods are, other timeframes are bad anyway.
Going to release a couple more scripts in the coming weeks.

Session RangeSimple script for showing the high/low/midrange of a session. By default configured to do the Daily range using the "regular" session. But it's configurable. For example on this chart I am showing the Weekly range.

Daily High/Lowmodified version of Mike Witts Daily High/Low indicator.
This is a simple change that removes the 1-day offset from the indicator.

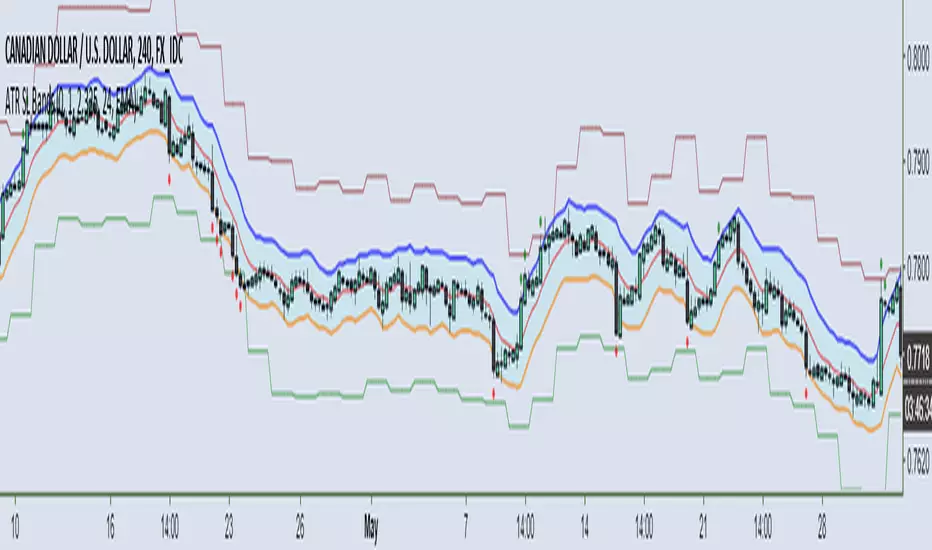
ATR Trailing Stop Bands [NeoButane]These ATR bands and trailing stops can be used as a way to manage risk, enter breakout trades, or as support/resistance.
Please see here for information about payment and access: medium.com
ATR Bands Features:
Shape plotted for closes out of bands
Custom resolution
Bands multiplier: useful for reducing size to increase signal
Band smoothing type: EMA, Hull MA, or no moving average smoothing
Calculated in geometric mean (log scaling) to resolve issues with flash dumps or pumps
Alerts for closing outside of bands
ATR Trailing Stop Features:
Based on daily resolution timeframe
Trailing stop multiplier: useful for curve-fitting to your instrument's normal trading range. Recommended multiplier between 1.5-3
Can be used as trading range (>3) or for breakout trading (<1.5)
Alerts for price touching stops
Instabots previous highs and lowsAdds previous daily, weekly and monthly highs and lows to the chart.
By default it just adds the price line to the chart. Change the default option to plot the highs and lows onto the chart, like below...
FofT - 1h, 4h, and D multi-timeframe EMAs in any time intervalView multiple-timeframe EMAs in a single interval. All EMA lines stay the same no matter your preference to trade in 15m, 1h, 3h…. etc.
Default EMA length is 10 (can be changed in the format settings)
Line colors
1h EMA - Yellow
4h EMA - Red
D EMA - Blue
How to add to chart
Click on "Add to Favorite scripts" in the bottom right
While in chart view click on "/" button on your keyboard or click on the Indicators button on the top tool bar
Go to Favorites Tab and click on this indicator
Other interval EMAs will be added based on request. Feel free to leave any questions or requests in the comment section below.
If you find this script useful, please like and share.

Daily SMA x2 With InputsIdeal for Intraday charts when you want to know the daily SMAs or for daily charts if you want to save on an indicator


Binque's Multi-Moving Average Binque's Multi-Moving Average - One indicator with four simple moving average and four exponential moving averages, plus as a bonus a Day High moving average and a Day Low Moving Average.
Simple Moving Average or MA(14), MA(50), MA(100) and MA(200) all in one indicator
Exponential Moving Average or EMA(8), EMA(14), EMA(20) and EMA(33) all in one indicator
Day High Moving Average - Tracks the Daily High versus most moving averages track the daily close.
Day Low Moving Average - Tracks the Daily Low versus most moving average track the daily close.
To Disable moving averages, Set the color to the chart background and then set the length to 1 and uncheck.
I Use the Daily High Moving Average to track upward resistance in a stock movement for Swing Trading.
I Use the Daily Low Moving Average to track my trailing stop in a stock movement for Swing Trading.

DRS - Daily Range SystemAn indicator that visualizes the evolution of a daily candle, inspired by a thread on forexfactory: www.forexfactory.com
Applied on a timeframe lower than D (actually lower than H4), it visualizes the evolution of the day's high and low, as well as mid and 25% and 75% lines.
The sole input parameters are the hour at which a day is supposed to start, and the extent of the "trade allowed" region as explained in the FF -1.44% thread.

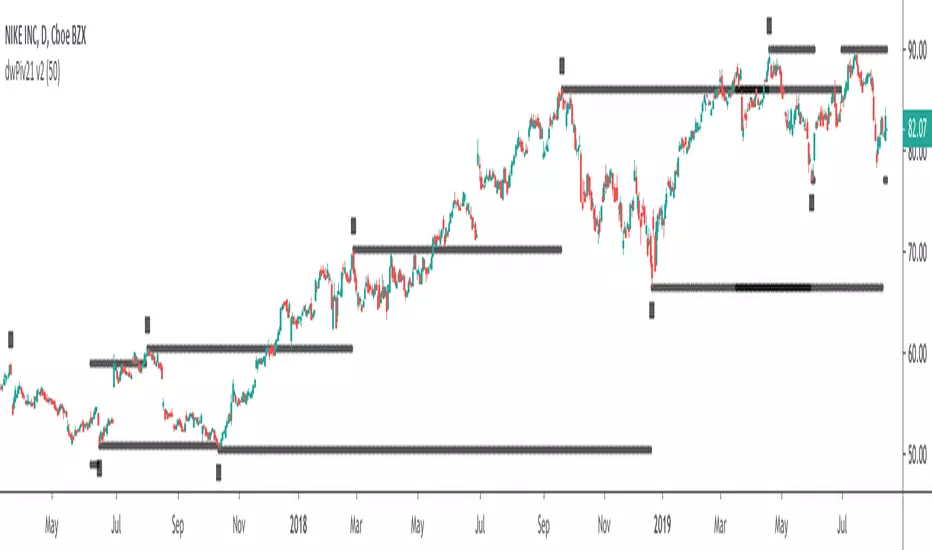
dwPiv21This is a customised indicator highlighting key levels of support and resistance on the daily time frame.
dwPiv11This is a customised indicator highlighting key levels of support and resistance on the daily time frame.
dwPiv4This is a customised indicator highlighting key levels of support and resistance on the daily time frame.

dPiv5This is a customised indicator highlighting key levels of support and resistance on the daily time frame.