Three Bar Gap (Simple Price Action - with 1 line plot)This script is tailored towards experienced traders who prefer to view raw price charts during live execution. It searches for a three-bar pattern of what is colloquially called "fair value gap", or "imbalance" and uses a single line to plot the results. The goal is to display price in a way that is as simple as possible so that chart readers who don't prefer to add indicators on their screen will still find this indicator as an acceptable option to consider for.
From a code perspective, this script explores a new PineScript feature called UDT (user-defined types). This is an incredible update because it brings developers one step close to having the ability to create abstract data types.
█ What is price action?
Experienced traders will tell you that the chart that they use for live execution is raw, clean, and uses no indicators. They say they execute on price action, so what exactly is price action?
There is no formal definition to it, but one can agree that it implies the process of analyzing price without considering the fundamentals, without needing to know what the news was about, and without needing to know any of the Greeks (except for the desire to “seek alpha” Ha.haa...). This is not to say that price action traders are executing in their own vacuums without the need to know what is happening around the world. Surely fundamentals and financial models can be used beforehand for developing a bias for what is being traded, but it’s price-first at the moment of execution. That said, Factor (A) is Price.
Factor (B) is time-perception, it’s how the trader reads the tape. How the trader perceives price to change with respect to time is valuable information. Interpretation of "time" will be elaborated in the next section that talks about candlestick patterns detected by this script.
Putting this together, price action means the analysis of price movement by only considering (A) price, and (B) time, to predict which direction the market will move. A speculative trader is timing the market with the expectation to make a quick in-and-out profit; she/she is using price action. On the other hand, a long term investor holding a diversified portfolio with a strategy based on modern portfolio theory combined with fundamental analysis (at this point candlesticks are irrelevant) but has one additional criteria of, say, can only go Long on a stock when it has closed Green on Daily; he/she is also considered to be executing on price action.
█ Candlestick patterns
This script calculates the displacement of highs and lows over three consecutive bars.
A) Down move = When High of the recent confirmed bar is lower than the Low of the previous-previous candle
B) Up move = When Low of the recent confirmed bar is higher than the High of the previous-previous candle
(Note that its the confirmed bar that is being talked about, so it does not repaint)
An ATR filter will be applied to reduce the number of lines generated as many times they might just be associated with minor price changes.
Interpretations:
When price moves quickly across three bars, it can be thought that it has gapped. Although the candle in the middle appears to be solid, it’s not from a conceptual perspective. This is because time itself is arbitrary; timeframes don’t necessarily have to be fixed intervals. Take stocks with regular trading hours for example, if price makes a breakaway gap and you bundle the after-hours and pre-market sessions together as one candle, never minding that intervals should be fixed, then you will see the exact three-bar-gap patterns. Similar happens during intraday sessions on lower timeframes, if you zoom-in closer, you’ll see that ticks within the middle candle are sparsely dispersed. This is why it's called a gap.
█ Parameters with fixed inputs & assumptions used:
ATR is used for filtering out minor movements that will likely be deemed as irrelevant by trader for the purpose of live execution. The following inputs are required:
A) ATR lookback period
B) Multiplier
The product of ATR(len=A) and B produces a threshold for minimum distance that price must gap by. Initially, it was proposed to be only based on one ATR, but often an ATR is too wide and using it will filter out too many lines. Because of this observation, a multiplier (Parameter B) has been introduced to allow users to apply fractional ATR as a threshold.
█ Applications:
For trend followers: Follow the direction of the gap. Entering above recent high/low points above/below the first impulse with a stop-limit order is a viable tactic.
For contrarians fading a trend: The mid-point is a good point of reference for predicting potential areas of support/resistance.
Fairvaluegap

Liquidity Hunter - FattyTradesThis indicator is used to automatically identify and plot two forms of liquidity that will be targeted by market makers.
The first form of liquidity is based on multi-time fame highs and lows. It plots 1H, 4H, D, W, & M liquidity on an intraday chart to make it easier to identify. I believe hat liquidity is what drives the market and the most common form of this liquidity can be identified through higher time frame highs and lows. You can use whatever method you prefer to determine which liquidity pool will be targeted. When the liquidity is purged, it will be shown as dotted lines. This should not be used as traditional support/resistance, but rather as targets for the market.
The second form of liquidity is in the form of imbalances or fair value gaps. You can select a higher time frame to be plotted along with the current time frame you're viewing to identify imbalances that will likely be targeted intraday. We know that higher time frame fair value gaps work equally well as targets for market makers. When a higher time frame FVG is broken into, it can also act as a very powerful form of support and resistance. By default, when a fair value gap has been mitigated it will be removed from the chart, however this can be disabled.
Between these two forms of market maker liquidity targets on the chart, it will be easier to formulate a thesis intraday to determine where the market will move. It can help minimize the amount of switching between higher time frames that needs to be done, allowing you to identify targets while trading on your favorite intraday time frame for optimal risk/reward.
In the near future, I will build in alerting mechanism to alert when liquidity on higher time frames as been purged/mitigated.

Imbalance Detector [LuxAlgo]This indicator detects and highlights market imbalances alongside a dashboard returning information about their frequency of occurrence and their fill percentage. Imbalances included in this script are Fair Value Gaps (FVG), Opening Gaps (OG) and Volume Imbalances (VI).
Alerts are available for the occurrences of all market imbalances.
Settings
Imbalances
Each imbalance has the same settings layout:
Imbalance: Enable/disable the detection of the specific imbalance.
Min Width: If enabled, requires the imbalance area width to be greater than the specified value. This minimum width can be expressed in points, percentages or ATR multiples.
Extend: Extend imbalances by a specified number of bars.
Dashboard
Show Dashboard: Enable/disable the dashboard on the chart.
Dashboard Location: Location of the dashboard on the chart.
Dashboard Size: Size of the dashboard.
Usage
Market imbalances are part of the many concepts available to price action traders and highlight areas where there is a disparity between supply and demand.
It is common to see price come back to these areas and traders often use them as supports and resistances but also as targets.
Details
The script can detect three distinct types of imbalances described below.
Fair Value Gaps
Fair Value Gaps (FVG) are three candle formations characterized by a gap between the wicks of the non-adjacent candles in the formation.
A bullish FVG is characterized by a gap between the current price low and the 2 bars anterior price high, and a bearish FVG is characterized by a gap between the current price high and the 2 bars anterior price low.
Opening Gaps
Opening Gaps (OG) are imbalances characterized by non-existent activity within a specific price range.
A bullish OG occurs when the current price low is greater than the previous high, a bearish OG occurs when price high is lower than the previous price low.
Opening Gaps primarily occur in closing markets, as such they are less common in the cryptocurrency market.
Most of the time an Opening Gap will also be accompanied by a Fair Value Gap, in order to avoid clutter the indicator will not detect Fair Value Gaps if Opening Gaps are enabled and if an Opening Gap has been detected
Volume Imbalances
Volume Imbalances (VI) are characterized by a price discontinuity between the opening price and previous close, but unlike Opening Gaps we do not see nonexistent activity within a certain price range.
A bullish VI occur when both the opening and closing prices are superior to the previous closing price, with the current price low overlapping the previous price high. A bearish VI occur when both the opening and closing prices are inferior to the previous closing price, with the current price high overlapping the previous price low.
Because Volume Imbalances can occur excessively on markets with frequent gaps, we make use of an additional condition for filtering out less significant imbalances. Bullish VI's will require the previous price high to be lower than the opening price, while bullish VI's will require the previous price low to be higher than the opening price.

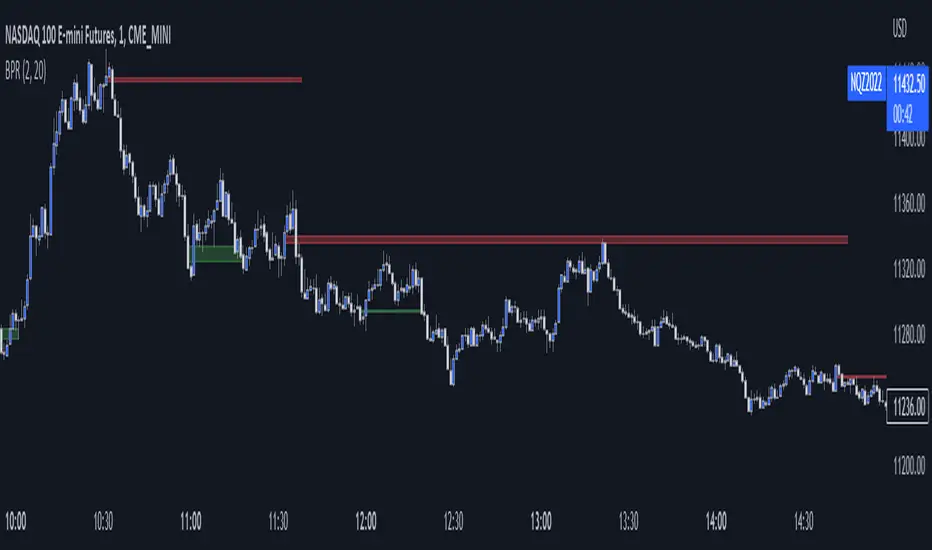
Automatic Closest FVG with BPRFair Value Gaps are a hugely popular concept and because of that there are numerous indicators available. This one however, was designed to automate the process of actually using them in trading.
Designed with lower time frame entries in mind (though will work on HTF just as well), this indicator automatically draws the closest, non-mitigated FVG, to the current price, cutting out the work of looking for what FVG is relevant.
The indicator also has an option to show when the current nearest pair of FVGs form a BPR or 'balanced price range'.
There are various option for what counts as mitigation, including no mitigation at all, and when mitigated an FVG is no longer considered for proximity searching.

ICT - GAPs and Volume Imbalance
GAPs
Gaps are areas on chart where the price have moved sharply up or down, with no trading in between. Gaps often fill, but they don't have to.
Volume Imbalance
Volume imbalance - determined using 2 candles
Bullish Volume Imbalance - area between the close of 1st candle and the open of 2nd candle
Bearish Volume Imbalance - area between the close of 1st candle and the open of 2nd candle
How to use the indicator:-
When you find imbalance in volume or a GAP in the chart, you may expect price to rebalance it before continuation.
Importantly, GAPs/Imbalances do not always fill. Traders should never assume that a gap/imbalance will fill without understanding the reasons for the gap and monitoring trading activity around the gap.
Pair it with your current bias for better results.

Bodies X Wix Version of Smart Money Tools by makuchaku & eFeThis is the same Script as Super Fair Value Gaps / FVG /BoS / by makuchaku & eFe. Mine Should Default to Large Text instead of small. The Super Order Blocks I believe was meant to for you to find one of the many Smart Money tools such as turn on the Fair Value gap but leave the others off, or Turn on where the Break of Structure and leave the others off. The reason I believe this is because the default values for each of the structures were default colored (green for positive and red for negative) for all.
Mine has a different Color for every possible structure. As long as you can read with the larger text that I added, then you can create your own boxes positive for break of structure, rejection block, order blocks and fair value gaps for any time frame. The reason I did that is because There's only certain things I believe I will need to mark for myself in each time frame, and then from there You can stretch iyour own box out further in time because if price touches a fair value gap for example, the fair value gap should conyinue in time until at least 2 candles have filed the Fair valu gap going both directions. That's truly when the fair value gap should is mitigated and will from off the chart. However, If I knew How to add the code for that, I would.
Additionally, I have the Max Boxes per chart, so you should have the ability to see every OB, FVG,RJB, & BoS on the chart
I tried my hardest to create a colored border that was different from the box. But the way the original was coded was almost impossible to do. Because they defined each of the structures (FVG, OB, BoS, RJB) outer levels, when the outer levels connect via math in the code, then it joins all the outside lines for a rectangle. When creating a box, the coloe will always be the same as the border unfortunately. (Unless I replan this from the beginning)
I also Changed the default labels for reach structure from a hard to read gray to a white that pops out.
Also, chart indicators are a little large as well. Such as the cross, sideways cross, The green Triangle, and the white Diamond. You'll get used to it or you can change it as well.
Creating videos for students, you need something they can see.
So, I just wanted to ensure everything was a little more unique and easily usable when showing this to my students when I send them private videos for our weekly lessons. I'm trying to learn how to use the IPFS for THAT, (which i see has invaded PineScript) Hope this indicator helps.
If you're to borrow this, Just make sure you keep the authors in the name makuchaku & efe

Balanced Price Range (BPR)This script finds BPR's, which some simply refer to as a "double Fair Value Gap" (FVG). In a BPR, there is an overlapping vertical area between a recent bullish and bearish FVG. You may tune the parameters to filter out smaller FVG's or BPR's, as well as how far back the indicator must look to find a matching pair.
MTF Fair Value Gap Indicator ULTRAFVG Fair Value Gap Indicator
FVG's commonly known as Fair Value Gaps are mostly in use for forex trading, however it’s been widely used in price action trading, even on regular large cap stocks. Think of it as an imbalance area where the price of the stock may actually be under/over valued due to many orders being injected in a short amount of time, ie . a gap caused by an impulse created by the speed of the price movement. In essence, the FVG can become a kind of magnet drawing the price back to that level to attempt to balance out the orders (when? we don't know). Please do research to understand the concept of FVG's.
You can look for an opportunity as price approaches the FVG for entry either long/short because after all, it is an "Area of Interest" so the price will either bounce or blow through the area. No indicator works 100% of the time so take in context as just another indicator. It tends work on larger time frames best.
IMPORTANT TV RELATED LIMITATIONS: You should take the time to understand the following. A MAXIMUM of 500 boxes and labels are allowed, thus if you elect to display many different time frames of FVGs and/or select to not auto delete old Daily FVGs, the oldest FVGs will be deleted and not be seen. Additionally if you are on a smaller chart time frame (1 min), you may not see older FVGs such as Daily ones that occurred and still exist from long ago. This is due to TV limitation of 20,000 candles of history in each chart timeframe. Example: A 1 minute chart supports approximately 14 days worth of data so looking for Daily FVGs would only go back that far, whereas if your chart was set to 5 minutes you'd be able to see 5 times as many, ie . 60 days worth of Daily FVG's. Obviously setting your chart and looking for Daily FVG's would support up to 20,000 days worth.
The Indicator Provides many different features:
*Creation of FVG's for all hours or just during market hours. Currently you can enable FVG’s for the following timeframes: Current chart timeframe, 5Min, 10Min, 15Min, 1Hr, 4Hr, 8Hr, Daily, Weekly, Monthly.
*Text label displays overlaying FVG bands including creation timestamps.
* Bands reflecting FVG's in action (created/deleted) for the current chart time frame, 15min, 1hr, 4hr, 8hr and daily time frames. The FVG's will be overlayed on the chart if enabled.
*Mitigation Action - Normal - When FVG is balanced out by price action, the FVG will disappear. Dynamic - The FVG band will decrease as the price movement eats into it thus only showing the remaining imbalance. None - For those that wish to retain FVG's even if they were mitigated. Half - FVG’s disappear when the price intrudes 50% of the overall FVG band zone.
*Mitigation Type - The elimination or balancing of the FVG is caused by either the candle wick or body passing completely through the FVG.
*Maximum FVGs - A maximum number of FVGs are created for each different enabled time frame (be aware setting a large number could impact system performance).
*All FVG band colors can be customized by the user.
* All FVG bands auto extend to the right.
* Intrusion Alerts - Trading View alerts are supported. You can use the indicator settings to enable an alert if the price intrudes into the FVG zone by a certain percentage. This is not related to mitigation or removal of the FVG, just a warning that price has reached the area of interest.

Mark FVGsMark FVGs is marking FVG (stands for Fair Value Gap, other name is Imbalance or IMB) on your chart so that you can instantly detect them
It supports:
- marking bullish and bearish partly filled or unfilled FVGs of the current timeframe
- marking bullish and bearish already filled FVGs of the current timeframe
- marking bullish and bearish FVGs of the any 4 timeframes on your current timeframe
technically it re-builds them on the last bar or as soon as new realtime bar is updated. it looks with 1k bars back to find the nearest specific number of FGVs
Adjustments:
- changing the maximum number of FVGs to display.
- changing the color of FVG area
- displaying already filled FVG of the current time frame
- changing the mode of displaying area it can either extended or fixed width
- displaying labels of other time frame FVGs

Fair Value Gap [LuxAlgo]Fair value gaps (FVG) highlight imbalances areas between market participants and have become popular amongst technical analysts. The following script aims to display fair value gaps alongside the percentage of filled gaps and the average duration (in bars) before gaps are filled.
Users can be alerted when an FVG is filled using the alerts built into this script.
🔶 USAGE
In practice, FVG's highlight areas of support (bullish FVG) and resistances (bearish FVG). Once a gap is filled, suggesting the end of the imbalance, we can expect the price to reverse.
This approach is more contrarian in nature, users wishing to use a more trend-following approach can use the identification of FVG as direct signals, going long with the identification of a bullish FVG, and short with a bearish FVG.
🔹 Mitigation
By default, the script highlights the areas of only unmitigated FVG's. Users can however highlight the mitigation level of mitigated FVG's, that is the lower extremity of bullish FVG's and the upper extremity of bearish FVG's.
The user can track the evolution of a mitigated FVG's using the "Dynamic" setting.
🔹 Threshold
The gap height can be used to determine the degree of imbalance between buying and selling market participants. Users can filter fair value gaps based on the gap height using the "Threshold %" setting. Using the "Auto" will make use of an automatic threshold, only keeping more volatile FVG's.
🔶 DETAILS
We use the following rules for detecting FVG's in this script:
Bullish FVG
low > high(t-2)
close(t-1) > high(t-2)
(low - high(t-2)) / high(t-2) > threshold
Upper Bullish FVG = low
Lower Bullish FVG = high(t-2)
Bearish FVG
high < low(t-2)
close(t-1) < low(t-2)
(low(t-2) - high) / high < -threshold
Upper Bearish FVG = low(t-2)
Lower Bearish FVG = high
🔶 SETTINGS
Threshold %: Threshold percentage used to filter our FVG's based on their height.
Auto Threshold: Use the cumulative mean of relative FVG heights as threshold.
Unmitigatted Levels: Extent the mitigation level of the number of unmitigated FVG's set by the user.
Mitigation Levels: Show the mitigation levels of mitigated FVG's.
Timeframe : Timeframe of the price data used to detect FVG's.

Extreme Bars"Extreme Bars" is a simple but useful indicator that marks overbought and oversold candles. This indicator paints candles that fall far above the average red, and the candles that rise above the average green. Of course, they can change these colors if they want. "Extreme Bars" can be interpreted in many different ways. The starting points of colored candles can often be good support or resistance. In addition, it would be wise to close the positions opposite the colored candles and to maintain the positions compatible with the colored candles. It is also possible that the gaps formed by the colored candles will be closed in the future. The sensitivity of the indicator can be changed in the settings section.

MTF fair value gap v2 thigh gaps yumwell load in 2 FVG indicators one for current chart then one for MTF of interest.
Higher timeframe FVGs are more important and can be used for bias or even targets for internal liquidity.
big thanks @shanxia for basically re-doing the FVGs into arrays hehehe..
Can now delete mitigated or change mitigated color..
I dont know who uses extensions but if you want to suffer in your private time then go ahead...
pre sure this is the sexiest FVG indicator validate me in the description pls
Fractal Break Imbalance / Fair Value Gap (FVG) / Liquidity VoidFractal Break Imbalance / Fair Value Gap (FVG) / Liquidity Void
Order imbalances in either direction, either excess buy or sell orders, reduce liquidity. The market will seek to fill gaps sooner or later. The script marks an imbalance / FVG after a fractal break. It also marks any other imbalance.
Default Colours:
Green - Imbalance after fractal break to the upside
Red - Imbalance after fractal break to the downside
Yellow - Other imbalances
How To Use:
Gaps can be used to determine possible entries and targets. Those familiar with liquidity raids, supply and demand, and ICT concepts may realise it's potential.
Indicator in use:

Fair Value Gap█ OVERVIEW
This indicator displays the Fair Value Gap of the current timeframe and an additional higher timeframe. For each FVG the gaps act as targets creating bullish and bearish gaps that are often filled.
█ FEATURES
MTF Options
MidPoint FIll
Delete Old On Fill
Label FVG Timeframe
MTF Options
Enabling the MTF Options will allow the user to use the "MTF Timeframe" setting to choose what HTF Fair Value Gap to display
MidPoint FIll
A line plot at the Half way point will be included in the Fair Value Gap, this will be used to delete the gap when reached instead of a full fill.
Delete Old On Fill
Deletes historical Fair Value Gaps when filled.
Label FVG Timeframe
Labels Every Fair Value gap with there relevant timeframe to make it easier to determine which gap is being filled.
█ HOW TO USE IT
The indicator is quite straight forward in its application, providing users with targets that are often filled as they are seen as market imbalance.
Just applying it to your chart will provide the existing Fair Value Gaps. MTF Confluence is helpful in seeing what is happening on the macro perspective.
█ SUGGESTION
My suggestion for clarity is to use a different color to some degree between the MTF and Current TF as Opposed to text, keeps the chart clear.
█ LIMITATIONS OF PINE (Please read)
I see many users going on different indicators with MTF in mind and trying to use it for LTF data e.g. 1hour chart, and selecting 5min in chart settings.
This is not recommended by the team themselves and should be noted for use always use HTF: www.tradingview.com
To understand how to use fair value gaps I recommend learning about the subject some more, searching online will provide you resources. The internet is your friend when learning. All the best.

ICT Fair Value Gap [LM]Hello traders,
I would like to present you ICT Fair Value Gap script. The idea is the same as in my other script to look form imbalances. I have improved the previous script from teaching of ICT and created this script to train the eye to see those gaps. Shrinking option also shows if the gap has been already filled and also in case gap is filled you can get alert in case you will set it up .
The script has two settings:
general settings - definition of volatility condition for middle candle
box settings - setting for boxes, box colors, shrinking
I hope you enjoy it,
Lukas

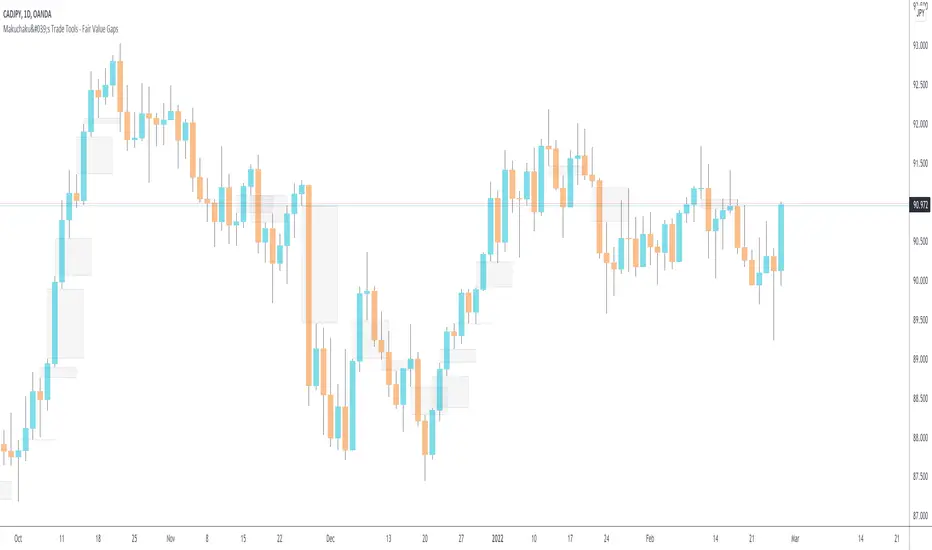
Makuchaku's Trade Tools - Fair Value GapsFair Value Gaps are a 3 candlesticks patterns, formed when the 3rd candle does not fully overlaps the 1st candle, leaving a gap in the 2nd candle.
muh gap! [FAIR VALUE GAP FINDER]Change the colors of the indicator to contrast your chart! Make sure to also change the transparency for the colors.
---
This indicator finds fair value gaps which are inefficiencies in price delivery. Gaps can be used for entry or even bias.
I've included midpoints, lines, and boxes. Boxes have the greatest range with respect to historic PA so keep that in mind.
I will be updating this script in the future, potentially adding an MTF function, mitigation of gaps and alarms.
Let me know if you guys have any additional ideas.
Best,
P

Fair Value Gap / FVG - HTF Orderflow bias / trendCalculates Fair Value Gap (FVG) as a counter and plots it below price.
FVG Counter value resets to +ve or -ve once the FVG counter reverses direction.
Use this script to find a bias to trade with.
Best used on HTF (like 1W, 1D), so the bias can be transferred to LTF (like 4H, 1H).
If you end up using this script, please leave a comment below on how you used it. I can try to incorporate those ideas in an update.
Cheers!
