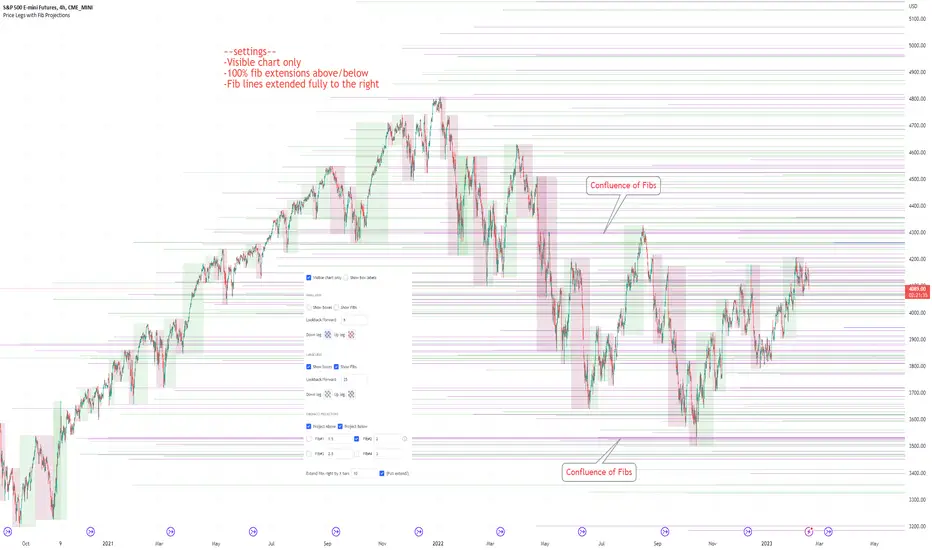
Price Legs & Fib Projections: Fibonacci Confluence-Plots price legs based on two user input lookback numbers. Smaller number for small legs, larger number for large legs.
-Plots Fib projections of these price legs, above and below; User can input four independent fib levels or standard deviation levels
## User Inputs ##
~Show visible chart only; Show price leg labels (time and price); show small legs (fibs and/or boxes); show large legs (fibs and/or boxes)
~Input 4 Fibonacci levels or measured move levels. Toggle each level on/off
~toggle on/off Fib levels ABOVE or fib levels BELOW
~extend Fib levels 'X' bars to the right, or toggle on/off 'Full Extend' to the right
## Tips & Notes ##
-use 'Full Extend' together with 'visible chart only' if searching for multiple confluence of Fib levels.
-can quickly get very cluttered, but the aim in writing this was to try to find area of confluence at a glance amongst a mess of levels, then hide the indicator and study/note that area.
-if lines don't print toward the left hand side of the chart you've likely reached the max line limit set by Tradingview.
-Fib level input of 1.0 represents zero % extension above the high or below the low of the leg; 2.0 represents 100% extension.
1hr S&P: Visible chart only; large legs only; 50%, 100%, 150%, 200% Fib extensions; Above only; lines extended fully to the right:
Usage notes; 15m S&P: Small & Large price legs; partial extend; all fib levels above/below:
Fibonacci
Fibonacci Levels Based on Supertrend [By MUQWISHI]A “ Fibonacci Levels Based on Supertrend ” indicator is supertrend indicator planned with Fibonacci retracements levels. Fibonacci retracements provides a sequence of levels starting from 0% to 100% in addition to extension levels. 0% is measured to be the initial Supertrend line, and 100% is the previous Supertrend line where it has been broken by candle. This tool could be valuable in terms of managing trades by setting targets and reducing the risk in the trend direction.
█ OVERVIEW
█ INDICATOR SETTINGS
Please let me know if you have any questions.
Thank you.

Fibonacci Step IndicatorThe Fibonacci Step Indicator assumes irregularity in calculating a moving average. It is measured as the mean of the previous lows and highs situated at Fibonacci past periods. For example, the mean of the lows from 2, 3, 5, 8, etc. periods ago form the Fibonacci step indicator.
The indicator uses the formula for the first twelve Fibonacci numbers on highs and lows so that it creates a moving support/resistance zone. Afterwards, the zone is stabilized by taking the highest highs of the upper indicator and the lowest lows of the lower indicator part.
The indicator is used as a trend following way. It can be compared to the Ichimoku Kinko Hyo cloud (without the future projection). The zone form a support and resistance area. During ranging periods, the market will fluctuate within the area which is a bad time to follow the trend (if any).

XYZ Super Fibonacci Channel Cluster
Simple setups
Just input two different ema, X and Y.
Multiple = input Phi factor (ex: 0.38 , 0.618 , 1.618 , 3.14)
Usage
Grouping movements into channels to identify trend acceleration and deceleration
Example usability in the BTC/USD trading pair (timeframe = 1D) =>
Input Setups
Source = hlc3
Multiplier = 2
X Ema = 13
Y Ema = 21
How to identify acceleration and deceleration?
H_1 to H_2 => Bullish but no acceleration (because at same top level border).
H_2 to H_3 => Bullish with acceleration (go up to another top level border).
H_3 to H_4 / H_4 to H_5 => Bullish deceleration (because drop to another top level border).
L_1 to L_2 => Bearish signal (because fall below EMA-super and touch the bottom border of Super Channel).
L_2 to L_3 => Bearish acceleration (drop to another bottom level border).
L_3 to L_4 => Bearish deceleration (go up to another bottom level border).

Fibonacci Breakout Target LevelsFibonacci Extension
Fibonacci Extension is a powerful technical analysis tool that traders use to predict where the market might find support and resistance. It is based on the Fibonacci sequence and uses levels that are found by extending the 23.6%, 38.2%, 50%, 61.8%, and 100% Fibonacci ratios from a swing high or low. These levels can be used to find possible areas of support and resistance, and traders often use them to figure out when to get into or get out of a trade.
What does this indicator do?
This indicator gets five levels of the Fibonacci Extension and uses it for both the low and the high. The default lookback period is 10 days, and it checks for the highest and lowest price in that period. Then it calculates the extension levels and plots them, and it also adds a line that shows you the current breakout target levels.
How to use?
The primary use intended for this indicator is to be used to determine possible breakout target levels. Let's say you are trading a range and a breakout happens. You can use this indicator to determine possible take-profit zones and possible support and resistance zones.
Features:
Change the lookback period for the Fibonacci Extension levels.
Disable the Fibonacci Bands if you just want to see the FIB levels.
You can also change the 5 levels and add different Fibonacci numbers.
In this image, you can see how you can use this indicator to determine take-profit levels. The Fibonacci Extensions will determine potential support and resistance levels, which could be good places to exit your long or short positions.

3 Zigzag for MTF Fib Alert [MsF]Japanese below / 日本語説明は英文の後にあります。
-------------------------
This indicator that automatically displays Fibonacci from each High & Low based on 3 Zigzags. It's useful for multi-timeframe analysis.
For example, Fibonacci calculated from the high and low prices (Zigzag 3 Period=100) of the upper timeframe can be displayed on the lower timeframe.
Also, you can set alerts for each Fibonacci point. It is useful when you are waiting for the price to return to the discount (50% or less) or the premium (50% or more) of the upper timeframe.
"Fib 1 - Crossing 0.00" … Trigger an alert when crossing the 0% line in Fibonacci of Zigzag1
"Fib 1 - Crossing 100.0" … Trigger an alert when crossing the 100% line in Fibonacci of Zigzag1
"Fib 1 - Crossing 23.6" … Trigger an alert when crossing the 23.6% line in Fibonacci of Zigzag1
"Fib 1 - Crossing 38.2" … Trigger an alert when crossing the 38.2% line in Fibonacci of Zigzag1
"Fib 1 - Crossing 50.0" … Trigger an alert when crossing the 50.0% line in Fibonacci of Zigzag1
"Fib 1 - Crossing 61.8" … Trigger an alert when crossing the 61.8% line in Fibonacci of Zigzag1
"Fib 1 - Crossing 76.4" … Trigger an alert when crossing the 76.4% line in Fibonacci of Zigzag1
*Same as Zigzag 1 and Zigzag 2 too.
"Choose Zig Zag Leg for fib" parameter means...
Latest : Calculate Fibonacci based on "the most recent Zigzag line".
Previous : Calculate Fibonacci based on "the previous Zigzag line".
-------------------------
3つのZigzagを元に各High&Lowからフィボナッチを自動で表示するインジケーターです。
Zigzagの期間を工夫することで、マルチタイムフレーム分析に役立ちます。
例えば、以下の設定とした場合:
Zigzag 1 Period … 8
Zigzag 2 Period … 25
Zigzag 3 Period … 100
上位時間足Zigzag(Period=100)の高値安値から形成されるフィボナッチを下位時間足に表示することができるのです。
また、このインジケーターではフィボナッチのポイント毎にアラートの設定が可能です。
上位時間足の割安価格(50%以下)や割高価格(50%以上)に価格が戻ってくるのを待っている時などに力を発揮してくれます。
"Fib 1 - Crossing 0.00" … Zigzag1のフィボナッチにおいて、0%ラインとクロスした場合にアラートを発報します
"Fib 1 - Crossing 100.0" … Zigzag1のフィボナッチにおいて、100%ラインとクロスした場合にアラートを発報します
"Fib 1 - Crossing 23.6" … Zigzag1のフィボナッチにおいて、23.6%ラインとクロスした場合にアラートを発報します
"Fib 1 - Crossing 38.2" … Zigzag1のフィボナッチにおいて、38.2%ラインとクロスした場合にアラートを発報します
"Fib 1 - Crossing 50.0" … Zigzag1のフィボナッチにおいて、50.0%ラインとクロスした場合にアラートを発報します
"Fib 1 - Crossing 61.8" … Zigzag1のフィボナッチにおいて、61.8%ラインとクロスした場合にアラートを発報します
"Fib 1 - Crossing 76.4" … Zigzag1のフィボナッチにおいて、76.4%ラインとクロスした場合にアラートを発報します
※Zigzag1およびZigzag2のフィボナッチも同様
"Choose Zig Zag Leg for fib"パラメータについて:
Latest … 一番新しいZigzagのライン(UpまたはDown)を元にフィボナッチを計算します。
Previous … ひとつ前のZigzagのライン(UpまたはDown)を元にフィボナッチを計算します。

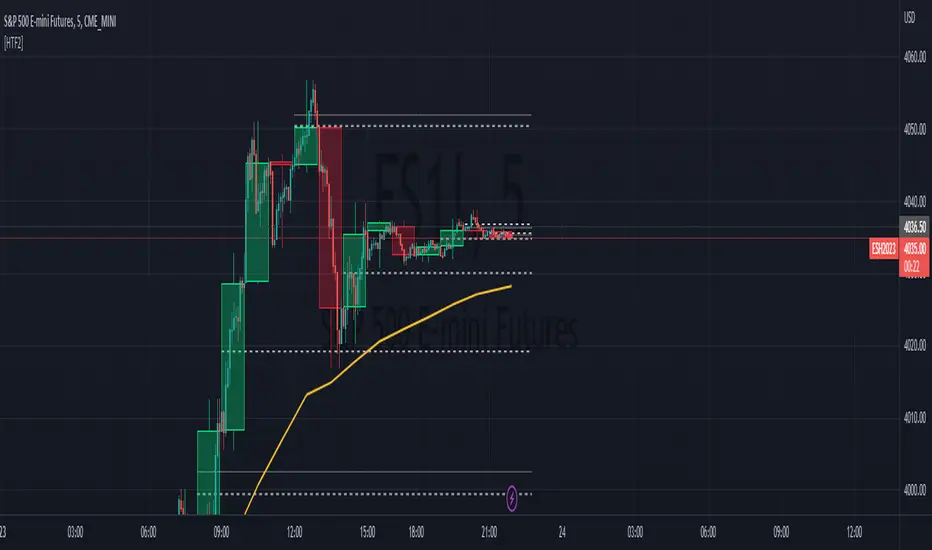
HTF Tool 2HTF Tool 2: Because the previous version was removed for being too powerful.
HTF Tool allows Users to display Higher Timeframe(HTF) Candles on their Chart with retracement lines drawn from the (High/Low) range of the HTF candle, as well as a live HTF MA.
This indicator perfectly handles Requested data to display a non-lagging HTF Moving Average(MA) by bridging a solid historical data stream with the live data stream.
This is done by offsetting plot data backwards to the middle of the last HTF candle, and then drawing a line from the last candle middle, to the live candle middle.
I have manipulated the data display to give the appearance that it consists of only 1 plot line, Whereas in reality, The HTF MA consists of 3 different processes:
- 1 historical plot value, to display the (correct) historical EMA with the same plot points you would see on the HTF chart from the same ema.
- 1 live line, re-drawn at every tick to mimic the way plot values move around while the bar is live.
- 1 live plot value, that is only displayed as a number on the status line and price scale to make it look like these are the outputs from the constantly redrawing line.
Because of this, This indicator displays the exact same way you would see this data on the requested timeframe's chart .
Note: You will see 2 values on the status line, these are the Historic MA, and Live MA values (Left, Right).
When hovering over historic values, a Historic MA value will only display in the middle of the HTF bars (same bar as the HTF wick)
This indicator include:
- HTF Candles, Drawn in the Traditional Candlestick Fashion.
- A User Adjustable HTF EMA / SMA , This Moving Average is accurate the the display you would see on a HTF chart.
- User Adjustable Retracement lines, up to 3 levels. These levels dynamically delete when price crosses them.
- Adjustable Display Range to display more or less HTF candles.
- Toggleable "Safe Mode" to keep the indicator display looking clean at all times.*
All Colors are Customizable to fit your layout style (Candle, Levels, HTF MA)
*Safe mode checks that your current chart's timeframe cleanly multiplies into your requested timeframe an odd number of times. This keeps the HTF candle wicks perfectly centered, and keeps the candle body width perfectly consistent.
If you choose to turn safe mode off here are some things to consider:
All Vertical data is consistent with the HTF requested , ONLY the horizontal alignment of the indicator will be thrown off.
When on low timeframes requesting other relatively low timeframes these issues are extremely more apparent than when requesting substantially larger timeframes.
Example: Safe Mode will likely need to be turned off for any 4h chart request, but as seen in the following image, the bars still look very normal.
Note: If you ONLY want to see the Levels and Moving Average... You ARE capable of requesting the current chart's timeframe. If you do this, the indicator will stop drawing the HTF candles, since your chart already shows that timeframe's candles.
Enjoy!
Dynamic Fibonacci RetracementA simple fibonacci retracement tool that dynamically updates itself based on current price and previous retracement values.
Features the essential aspects of the built-in tool and more.
Auto Trendline
Auto Reversal
Auto Level Adjustment
Labels indicating retracement value
Customizable lookback range
The top and bottom levels will auto-adjust according to where price currently is, which will also affect fibonacci levels as it progresses.

Fibonacci compressionThis script will search x-bars back, if it can find a triangle formation that meets certain Fibonacci ratios.
Based on the trend-based fib extension tool from the first high to the first low and then the 2nd high (in a bullish structure, inverse for bearish), we can predict the take profit levels.
The main target is the 0.618, first take profit is at the 0.236. In a strong trend, one can aim for the 1 fib ratio.
Once the 3 points are known, the script will already plot the take profit levels. It is better to wait until the full pattern develops with a 2nd lower high and a 2nd higher low.
The way I use it, is closing 20% at TP1, 80% of the remainder at TP2 and final close out at TP3.
Stop loss is the red line which will show up after a full pattern is formed.
Plot out the profit levels with the trend based fib extension tool, because once there's a break-out of the pattern, the script won't show the compression any more. (or use the replay button to go back in time to plot it again)
The volume label will appear once there's a divergence between the low and higher low or the high and lower high. It is based on my cumulative volume script. It only works well on timeframes above 4 hour, but volume in favor of a short, doesn't always guarantee a good short setup, so don't take it for granted.
It has around a 30 - 33% chance of hitting your TP2, so make sure the risk to reward is at least 3.
Happy trading!

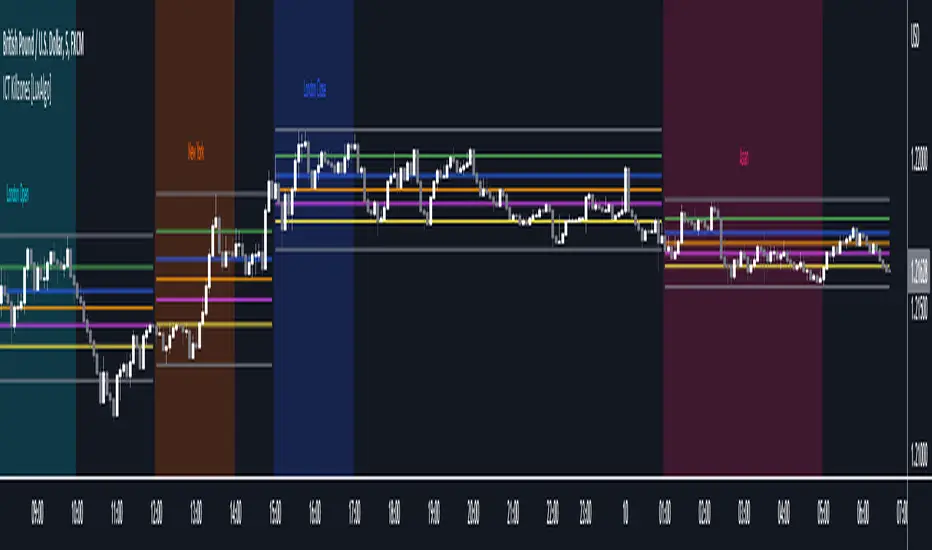
ICT Killzones [LuxAlgo]This script highlights ICT Killzones on the chart along with Fibonacci retracements constructed from each Killzone's price range, allowing traders to find more optimal entries.
Settings
Killzone Retracements
Show Retracements: Determines whether Fibonacci retracements are displayed on the chart.
Extend: Determines if the retracements are extended outside the Killzone.
Reverse: Switches the maximum and minimum levels for the calculation of the retracements.
Other settings allow disabling as well as changing the retracement value and color.
Usage
Killzones are introduced by forex trader ICT and represent different time intervals that aims at offering optimal trade entries. Killzones include:
New York Killzone (7:9 ET)
London Open Killzone (2:5 ET)
London Close Killzone (10:12 ET)
Asian Killzone (20:00 ET)
Note that using timeframes superior to 1h can highlight incorrect intervals
Fibonacci retracements on an active Killzone are subject to changes, if no Killzones are active then the associated Fibonacci retracements will stay at their current level.
Disabling specific Killzones while having extended retracements will allow them to extend further. In the image above the New York and Asian Killzones are disabled.
OTE optimal trade entry (ICT); visible chart only: Dynamic-simple tool based on ICT free YouTube material of many years.
-Highlights a box showing Optimal Trade Entry (OTE): 61.8% - 78.6% retracement
-Auto shifts depending on Bull or Bear move on chart.
--If visible chart is Bullish (low then high): shows OTE box 61.8-78.6% retracement down from the high
--If visible chart is Bearish (high then low): shows OTE box 61.8-78.6% retracement up from the low
-Thanks the use of PineCoders Visible Chart Library, and some of the example code there

AutoLevelsAuto Levels is a Work in progress.
It is based on the previous days ATR and the current days opening tick.
It takes that info and uses Fibonacci to automatically draw key levels for the day.
I have added the BULL BAR ( Green bar ) and Bear Bar ( Red Bar ) to signal as a Go Long / Go Short line in the sand.
The Tan bars are also proven key "Take Profit" levels.
These are, on average, major points of reversals, dip buys or consolidation.
I use this on the 5min timeframe and a close above or below a key level is my signal and direction. Auto Levels have proven to be a great indicator of major support and resistance.

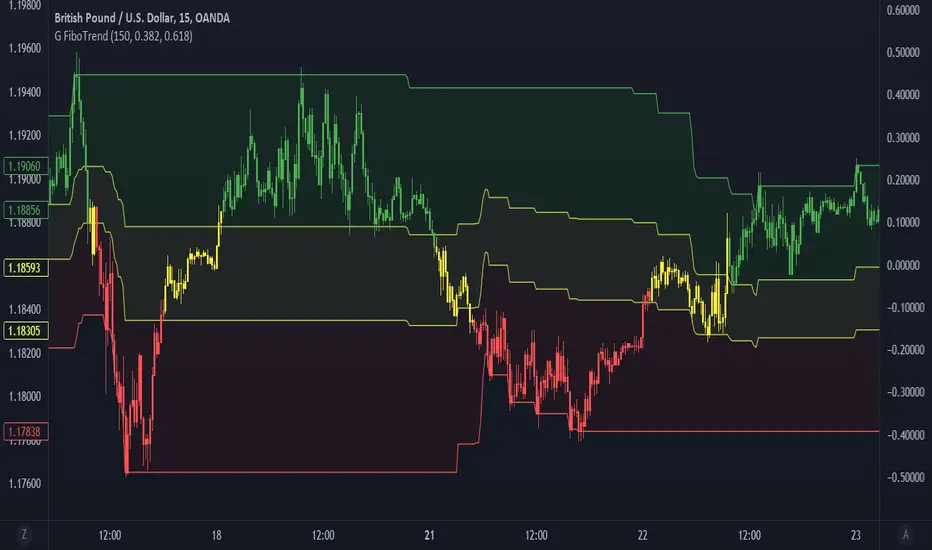
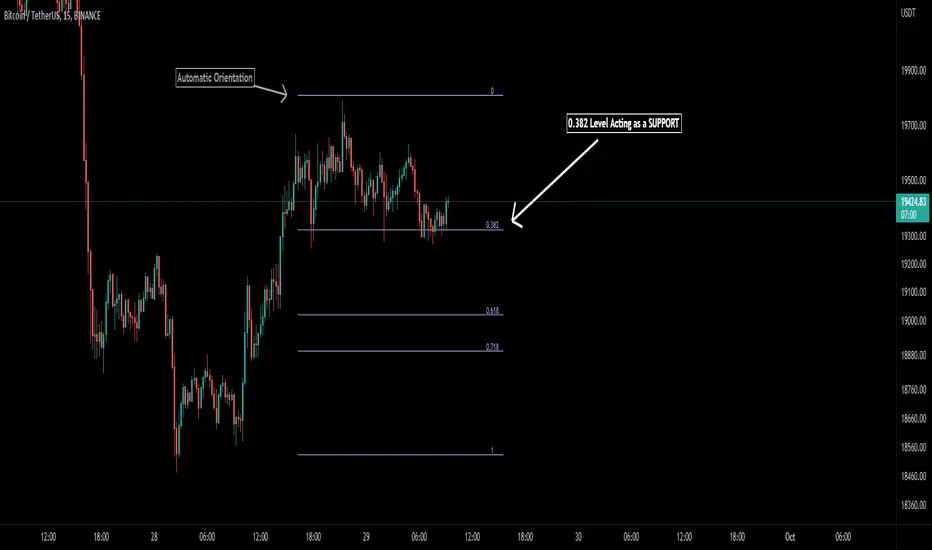
Gedhusek TrendFibonacciThis indicator is a trend filter based on fibonacci retracement levels
How to read:
- There are three filled zones --> red, yellow and green
- If the price is inside of red zone, there is a downtrend on the market
- If the price is inside the yellow zone, there is a sideways trend on the market
- If the price is inside the green zone, there is a uptrend on the market
- Also, candles are going to have a corresponding color based on the current trend
Calculations of the indicator:
1. Calculate distance between maximal and minimal price over the last "x" bars (choose value for "x" in inputs menu under the "Analysis period")
2. Use this distance for calculating two retracement levels (choose retracement levels in inputs menu)
3. These two retracement levels create an area of what is going to be considered as sideways market
Example:
- Lets say we chose Analysis period of 100, Lower Fibonacci Level as 0.382 and Upper Fibonacci Level as 0.618
- Maximum price over the last 100 bars was of 120 and minimum price was 20. That leaves us with the difference of 100 points
- Now we calculate the fibonacci levels --> 100*0.382 = 38.2 and 100*0.618 = 61.8
- The next step is to add the levels to the lowest price point --> 20 + 38.2 = 58.2 and 20 + 61.8 = 81.8
- And now we have our zones. If the price is going to be below the lower fibonacci level (in this case 58.2), we consider it as a bearish trend. If the price is between those fibonacci levels (58.2 and 81.8), we consider it as a sideways trend. And if the price is above the upper fibonacci level (81.8), we consider it as a bullish trend.
Inputs:
- Analysis period --> number of bars within which the system is going to look for max and min price
- Lower Fibonacci Level --> Choose from options and must be lower or the same as "Upper Fibonacci Level"
- Upper Fibonacci Level --> Choose from options and must be higher or the same as "Lower Fibonacci Level"
- Show Filling --> whether you wish to fill the areas with color
- Change Candle Color --> whether you wish to change the color of candles based on current trend.
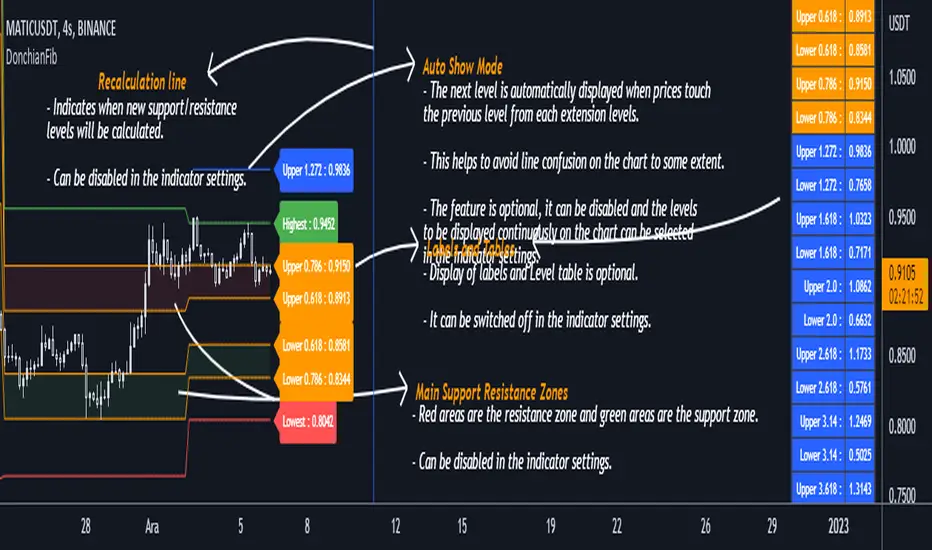
DonchianFib[Akcay]How does it work?
- The indicator detects the highest and lowest price level in the last x periods every time prices advance by x periods.
- From these values, retracement (0.618, 0.786) and expansion levels (1.272, 1.618, 2, 2.618, 3.14, 3.618, 4.236) are obtained.
- Since the symmetrical counterpart of the retracement levels is used, there are two of each of the 0.618 and 0.786 lines, for a total of four.
How can it be used?
- It can be used for step buying.
- It can be used for step selling.
- Can be used to set a profit target.
- Can be used to set a stop target.
- This indicator can be used in the same way as Pivot levels can be used. You can think of this indicator like the Pivot Points Standard indicator, where you set the period more flexibly.
Which indicators can it be combined with?
- I don't think there are any limitations, but I think it is compatible with trend detection indicators, trend detection with DonchianFib, and stepped buy/sell with limit orders.
- If you want to enter a position with mismatch signals, you can wait for the DonchianFib levels to break.
- Its use is limited by your imagination :)
Where does the name come from?
- As the name suggests, Donchian Channels. I was inspired by Donchian Channels when developing the indicator. Donchian channels show the highs and lows of prices over the last x number of periods. DonchianFib does this once for every x periods and uses the fibonacci levels to create upper and intermediate levels.
Note : I don't know if such an indicator has been done before or not. If it has been done, I haven't seen it in tradingview.
Çalışma mantığı nedir ?
- Gösterge, fiyatlar her x periyot kadar ilerlediğinde son x periyot içerisindeki en yüksek ve en düşük fiyat seviyesini tespit eder.
- Bu değerler üzerinden geri çekilme (0.618, 0.786) ve genişleme seviyeleri (1.272, 1.618, 2, 2.618, 3.14, 3.618, 4.236) elde edilir.
- Geri çekilme seviyelerinin simetrik karşılığı kullanıldığından 0.618 ve 0.786 çizgilerinden her birinden iki adet olmak üzere toplamda dört adet bulunur.
Nasıl kullanılabilir ?
- Kademeli alım yapmak için kullanılabilir.
- Kademeli satım yapmak için kullanılabilir.
- Kâr hedefi belirlemek için kullanılabilir.
- Stop hedefi belirlemek için kullanılabilir.
- Pivot seviyelerinden nasıl faydalanılıyorsa bu göstergeden de aynı şekilde faydalanılabilir. Bu göstergeyi, periyodunu kendinizin daha esnek bir şekilde belirlediğiniz Pivot Noktalar Standartı göstergesi gibi düşünebilirsiniz.
Hangi göstergelerle kombine edilebilir ?
- Bunun için herhangi sınırlama yapmak doğru değil ancak trend tespit etmeye çalışan göstergelerle uyumlu olduğunu düşünüyorum. Bu göstergeler ile trend tespiti yapıp DonchianFib ile alım/satım yerleri belirlenebilir ve limit emirleri ile kademeli alım/satım yapılabilir.
- Uyuşmazlık sinyalleri ile pozisyona girilmek isteniliyorsa DonchianFib seviyelerinin kırılması beklenebilir.
- Kullanımı sizin hayal gücünüz ile sınırlıdır :)
Adı nereden geliyor ?
- Adından da anlaşılacağı üzere Donchian Kanallarından. Göstergeyi geliştirirken Donchian Kanallarından ilham aldım. Donchian kanalları fiyatların son x periyot içerisindeki en yüksek ve en düşük seviyelerini grafikte gösteriyor. DonchianFib ise bunu her x periyot için bir defa yapıp, fibonacci seviyelerini de kullanarak üst ve ara seviyeler oluşturuyor.
Not : Daha önce böyle bir göstergenin yapılıp yapılmadığını bilmiyorum. Yapıldı ise ben tradingview'da görmedim.
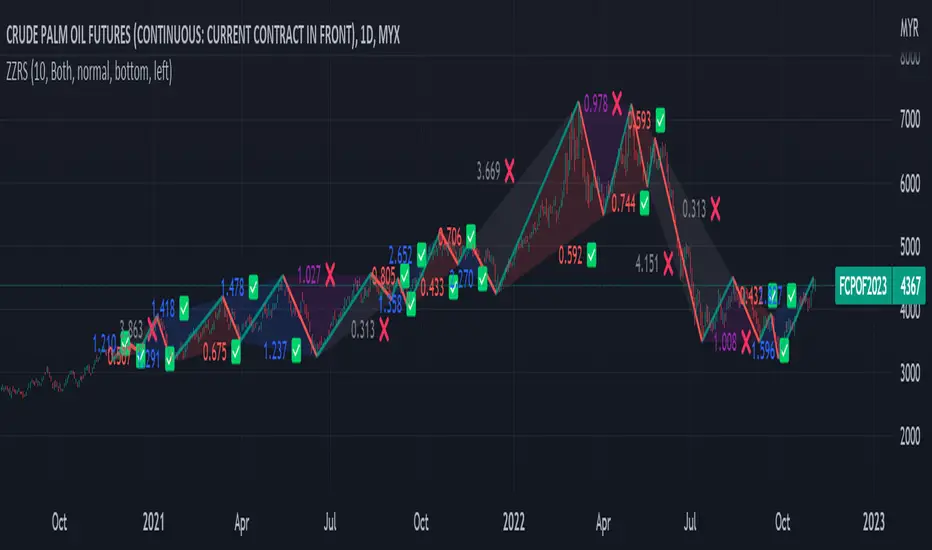
Zig Zag Ratio Simplified█ OVERVIEW
This indicator was to show ratio between zig zag. Ideally to find Fibonacci Retracement / Projection, Harmonic Patterns, ABCD, Elliot Wave and etc.
█ CREDITS
LonesomeTheBlue
█ FEATURES
Table can positioned by any position and font size can be resized.
█ USAGE / TIPS EXAMPLES (Description explained in each image)
Fibonacci Plot [ABA Invest]]ABOUT
This Fibonacci tool is easier than the usual Fibonacci drawing. with this, we can use Fibonacci drawing by choosing 2 different candles as starting point and ending point
INPUT SETTING
Fibonacci type: we can choose the type
option 1--> Fibonacci standard: display multiple levels constructed using the starting price point, ending price point, and multiple Fibonacci ratios. These levels can be used as support and resistance
option 2--> Fibonacci musang displays multiple levels constructed using the starting price point, ending price point, and multiple Fibonacci ratios. these levels can be used as taking profit level and also to know the ending of trendline
Drawing point: we can choose the type how we want the tools to draw our starting and ending point at candlestick
- wick to wick
- wick to body
- body to body

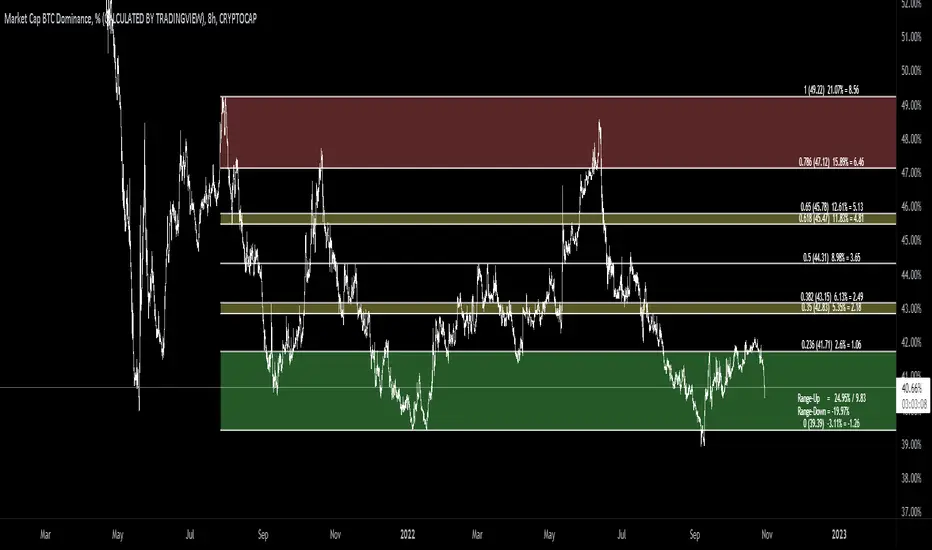
[MAD] Fibonacci retracementThis is just a Fibonacci Retracement tool with some interactive information based on the actual closing price
How to use:
add the script,
input left bottom with the 1st click,
input top with the 2nd click
Informations you can see than:
Fiblevel (Price) %till_this_point = pricedifference
additional:
Bottom of the fib
Range Up in % + Price-Range
Range Down in %
you can shift the comma with the decimal functions for trading shitcoins as example
if looking into the past, level/price will follow, liveinfo using the close is than hidden
what will follow:
reverse
log/linear
autogrow when range will be wicked
maybe alerts on levels... have to think about how to capture correctly
Auto Fibo Multi Timeframe [Misu]█ This indicator shows a Multi Timeframe automatic Fibonacci retracement levels.
This indicator is built using pivots from a user-selected timeframe to draw and orient the Fibonacci retracement.
Fibonacci analysis uses a logical sequence of numbers to predict trends and price action.
█ Usages:
The Fibonacci retracement is used to identify hidden support and resistance levels that an investor can use for entry, exit, and stop placement.
Depending on your usage, you can track breakouts above and below retracement levels to provide early entry points for major breakouts and breakdowns.
Higher timeframe Fibs allow you to have more relevant and weighted signals.
█ Features:
Choose Timeframe
Choose Fib levels
Color Fib Levels Individually
Color Fib Levels all in one
█ Parameters:
Timeframe: The Timeframe chosen.
Left Bars: A parameter used to calculate pivots.
Right Bars: A parameter used to calculate pivots.
UI Settings: Select Fibs levels and colors.

Auto Fibonacci [Misu]█ This indicator shows an automatic Fibonacci retracement levels.
This indicator is designed based on highs, lows, and trend interpretation to orientate the fibonacci retracement in the good direction.
Fibonacci analysis uses a logical sequence of numbers to predict trends and price action.
█ Usages:
The Fibonacci retracement is used to identify hidden support and resistance levels that an investor can use for entry, exit, and stop placement.
Depending on your usage, you can track breakouts above and below retracement levels to provide early entry points for major breakouts and breakdowns.
█ Features:
> Choose Fib levels
> Color Fib Levels all in one
> Color Fib Levels Individually
█ Parameters:
Deviation: A parameter used to calculate pivots.
Depth: A parameter used to calculate pivots.
UI Settings: Select Fibs levels and colors.
Auto Fibonacci Levels + Auto Trend Line generatorAnother indicator for you guys!!!
This indicator consists of the 5 key Fibonacci retracement levels, plotted automatically to user input settings. I also have included an auto support/resistance trend line generator.
What is a Fibonacci retracement?
'Fibonacci retracement is a method of technical analysis for determining support and resistance levels. It is named after the Fibonacci sequence of numbers, whose ratios provide price levels to which markets tend to retrace a portion of a move before a trend continues in the original direction.' - Wikipedia
How to use the Fibonacci retracement?
- The Fibonacci levels are default. These percentiles from price to the average of the high in a sample and low in a sample give you a guideline of where a bottom may be, where a top may be, and where a range is being created.
- Look for the price to reject from 61.8% and 76.4%, and also look for price to bounce from 38.2% and 23.6%. If a lower low/higher high is made, the fib levels will follow and the percentiles within will be recalculated after a 5 candle offset period.
- If you see price trending towards the lower percentiles (38&23) and using the 50% as resistance, look for a break downwards and vice versa.
-This Fibonacci set as all others is subject to fake-out, always use this with another series indicator, or don't use it as a signal for entry at all (unless you have a backdated strategy)
How to use the trend line generator?
-The trend line generator will only plot when a lower low/higher high has taken place within the input amount of candles. It is also offset by a user amount.
-The check box will give the option to have the trend line's plot or not.
- If you see a green/red dot it means that that will be your first coordinate for the trend line, and until the computations are complete it will give you an idea of which direction it will be in (resistance or support)
-When opening this indicator zoom out all the way to connect any trend lines that do not load automatically.
Let me know if you have any questions, suggestions or issues! Thank you everyone!
-Cheatcode1 :)
SP:SPX TVC:DXY BMFBOVESPA:EUR1! CME:BTC1! BINANCE:BTCUSDT

+ Dynamic Fibo-Donchian ChannelsThis is my second Donchian Channels indicator (and will probably be my last because how many does one really need). This version is different from my other one in that, well, it's 'dynamic' which simply means that it self adjusts based on the same formula that my Ultimate Moving Average does. What does that mean? It just means that the script takes an average of 8 different length, in this case, highest highs and lowest lows. The user doesn't need to pick a lookback/length/period/what-have-you. The indicator does it all itself. This, I think, makes for a very nice baseline or bias indicator to fit within a system that utilizes something like that. I also think it makes for a more accurate gauge of higher highs and lower lows within a timeframe, because honestly what does it mean to make a lower low over 20 periods or 8 periods or 50 periods? I don't know. What I do know is that traditional Donchian Channels never made much sense to me, but this does.
Additionally, I've kept (I guess that's not 'additionally') the fibonacci retracement levels from my other Donchian Channels indicator. These are calculated off the high and the low of the Donchian Channels themselves. You will see that there are only three retracement levels (.786, .705, .382), one of which is not a fib level, but what some people call the 'OTE,' or 'optimal trade entry.'' If you want more info on the OTE just web search it. So, why no .618 or .236? Reason being that the .618 overlaps the .382, and the .236 is extremely close to the .786. This sounds confusing, but the retracement levels I'm using are derived from the high and low, so it was unnecessary to have all five levels from each. I could have just calculated from the high, or just from the low, and used all the levels, but I chose to just calculate three levels from the high and three from the low because that gives a sort of mirror image balance, and that appeals to me, and the utility of the indicator is the same.
The plot lines are all colored, and I've filled certain zones between them. There is a center zone filled between both .382 levels, an upper and lower zon filled between the .786 and either the high or the low, and a zone between the .705 and .785
If you like the colored zones, but don't like the plots because they cause screen compression, turn off the plots under the "style" tab, or much more simply right click on the price scale and click 'scale price chart only.' Voila! No more screen compression due to a moving average or some other annoyance.
Besides that basis being a nice baseline indicator the various fib bands (or just the high and low bands) make for excellent mean reversion extremes in ranging environments.
There are alerts for candle closes across every line.
Below is an image of the indicator at default settings.
Below is an image of the indicator with the center .382 channel turned off.
Below is an image of the indicator with just the .786/.705 channel showing .
CDC Fibonacci Retracement and ExtensionThis indicator is meant to be used as a tool to quickly identify
fibonacci retracements and projections in multiple charts during
the same date range.
Users can set the calculation date range and quickly flip through
different charts for comparisons
Steps for using this indicator is as follows:
1. Specify Start Date and End Date for calculations
2. Choose Open-ended mode for just retracements, this will disregard
end date in calculations.
3. Select price source, if Use Highs/Lows is selected, the indicator will
use high and low prices for calculation, if not, closing price eill
be used instead
4. Select and/or modify retracement / projection lines as you see fit.
5. Enjoy the result!

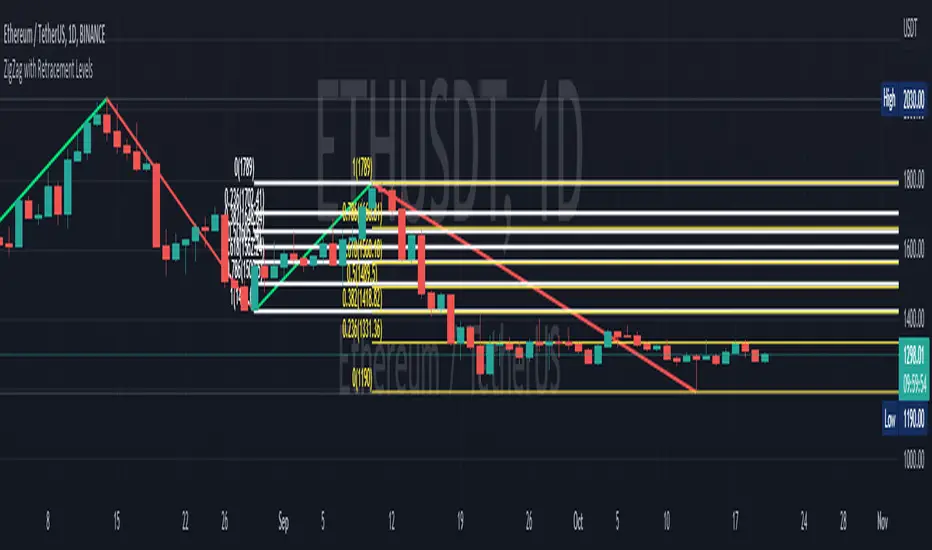
ZigZag with Retracement LevelsThis is a modification to "ZigZag with Fibonacci Levels" by LonesomeTheBlue.
By default, the script finds the ZigZag, draws Fibonacci lines and labels accordinly. ZigZag period can be set.
The modification to the original script provides the following features:
1) Option for user to customize retracement levels, if they don't want to use Fibonacci levels. This allows for different strategy adoptions.
2) Option to show Fibonacci or custom retracement levels based on the latest pivot (including the current bar)
For example:
Enjoy and happy trading~!!