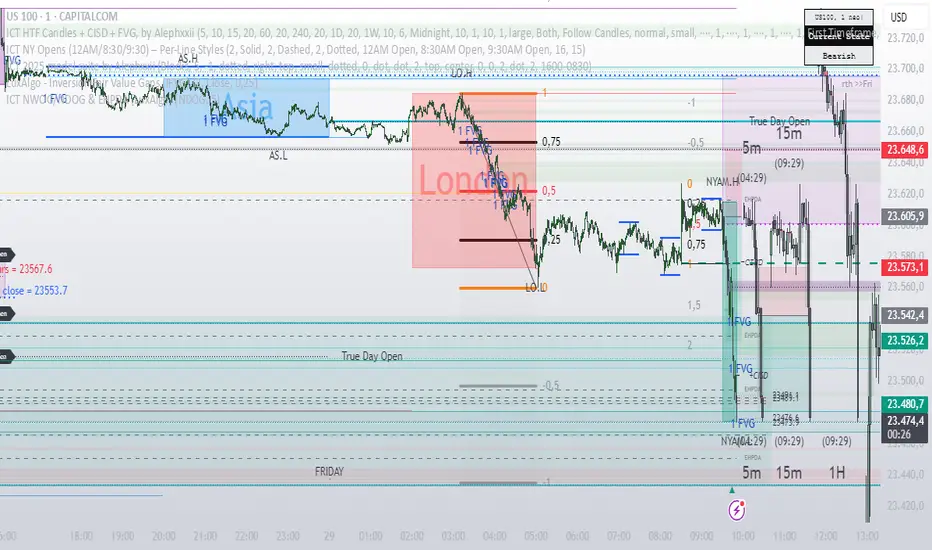
TDT Candle CounterThis indicator allows you to count candles inside a custom date range and display labels directly on the chart.
It supports three different counting modes:
🔢 Modes
Every Candle → Marks every bar sequentially (1, 2, 3, 4, …).
Alternative Sequence → Marks bars that match the sequence 1, 5, 9, 17, 25, 37, ….
Special Sequence (default) → Marks bars that match the sequence 1, 3, 7, 13, 21, 31, ….
Each mode has its own color so you can quickly distinguish which cycle is active.
⚙️ Features
Custom start and end date for the counting period.
Option to highlight the active period with a background color.
Labels are positioned above or below candles depending on the initial direction.
Alerts when:
Counting starts
Counting ends
🎯 Use Cases
Visualize candle sequences for cycle analysis.
Track market structure with custom numerical references.
Combine with other tools to study periodic behavior.
Inspired by Time Dilation Theory (TDT)
This counting approach is inspired by the Time Dilation Theory (TDT) methodology created by ICT Morpheus. According to TDT, markets unfold in cycles of 1, 3, 7, 13, 21… etc., reflecting natural rhythms of expansion, contraction, and distortion—an idea grounded in fractal time behavior across multi-timeframe analysis
Incorporating TDT principles into this tool helps visualize and align potential turning points and momentum shifts across different timeframes.
Pine Script® indicator