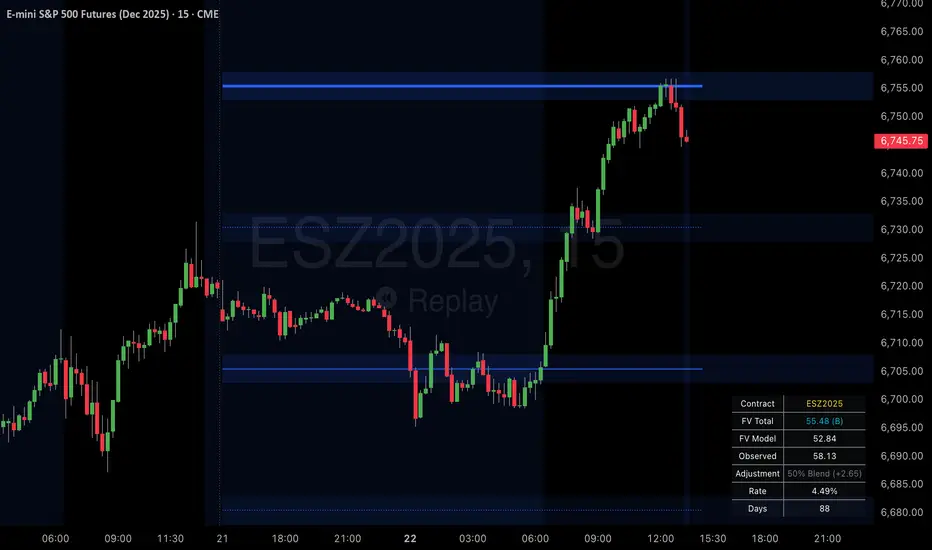
KIMATIX S|R Zones ScalpKIMATIX S|R Zones Scalp is a multi-timeframe support–resistance engine built for intraday scalpers and day traders.
The script automatically detects swing highs/lows on higher timeframes and converts them into precise S/R zones that extend into the future.
Each zone is visualized as a clean price band, color-coded by timeframe (15m / 5m) and by role (support or resistance).
When price breaks decisively through a zone, that level dynamically flips from resistance to support (or vice versa), keeping the map always up to date.
To avoid chart clutter, only the closest zones around current price are displayed, giving you an ultra-clean “trade map” with the most actionable levels for entries, partials, and stops.
Perfect for scalping indices, futures, FX, and crypto.
Key Features
Automatic 15m and 5m support & resistance zone detection
Wick-based swing identification for precise levels
Dynamic role flip: resistance → support and support → resistance after breaks
Distance-based filtering: shows only the nearest zones around price
Adjustable zone width, lookback and projection length
Separate colors for HTF/LTF and for support vs. resistance
Works on any symbol and intraday timeframe
Use it as a standalone S/R map or as a confluence layer with orderflow, volume or trend tools.
Futurestrading

6-9 session & levels6-9 Session & Levels - Customizable Range Analysis Indicator
Description:
This indicator provides comprehensive session-based range analysis designed for intraday traders. It calculates and displays key levels based on a customizable session period (default 6:00-9:00 AM ET).
Core Features:
Session Tracking
Monitors user-defined session times with timezone support
Displays session open, high, and low levels
Highlights session range with optional box visualization
Shows previous day RTH (Regular Trading Hours: 9:30 AM - 4:00 PM) levels
Range Levels
25%, 50%, and 75% range levels within the session
Range deviations at 0.5x, 1.0x, and 2.0x multiples
Fibonacci extension levels (customizable, default 1.33x and 1.66x)
Optional fill zones between Fibonacci levels
Time Zone Highlighting
Marks the 9:40-9:50 AM period as a potential reversal zone
Vertical lines with shading to identify key time windows
Statistical Analysis
Calculates mean and median extension levels based on historical sessions
Displays statistics table showing current range, average range, range difference, and z-score
Customizable sample size (1-100 sessions) for statistical calculations
Option to anchor extensions from either session open or high/low points
Input Settings Explained:
Session Settings
Levels Session Time: Define your session window in HHMM-HHMM format (default: 0600-0900)
Time Zone: Choose from UTC, America/New_York, America/Chicago, America/Los_Angeles, Europe/London, or Asia/Tokyo
Anchor Settings
Show Session Anchor: Toggle the session anchor line (marks session open price at 6:00 AM)
Anchor Style/Color/Width: Customize appearance (Solid/Dashed/Dotted, color, 1-4 width)
Show Anchor Label: Display price label for the anchor
Session Open Line: Similar options for the session open reference line
Range Box Settings
Show Range Box: Display a shaded rectangle highlighting the session high-to-low range
Range Box Color: Set the box background color and transparency
Range Levels (25%/50%/75%)
Show Range Levels: Toggle all three intermediate levels on/off
Individual Level Styling: Each level (25%, 50%, 75%) has its own color, style, and width settings
Show Range Level Labels: Display price labels for each level
Range Deviations
Show Range Deviations: Toggle deviation levels on/off
0.5x/1.0x/2.0x Settings: Each deviation multiplier can be customized with its own color, line style (Solid/Dashed/Dotted), and width
Show Range Deviation Labels: Display labels showing the deviation price levels
Previous Day RTH Levels
Show Previous RTH Levels: Display yesterday's regular trading hours high and low
RTH High/Low Styling: Separate color, style, and width settings for each level
Show Previous RTH Labels: Toggle price labels for RTH levels
Time Zones
Show 9:40-9:50 AM Zone: Highlight this specific time period with vertical lines and shading
Zone Color: Set the background fill color for the time zone
Zone Label Color/Text: Customize the label appearance and text
Fibonacci Extension Settings
Show Fibonacci Extensions: Toggle Fib levels on/off
Fib Extension Color/Style/Width: Customize line appearance
Show Fib Extension Labels: Display price labels
Fib Ext Level 1/2: Set custom multipliers (default 1.33 and 1.66, range 0-5 in 0.1 increments)
Show Fibonacci Fills: Display shaded zones between Fib levels
Fib Fill Color: Customize the fill color and transparency
Session High/Low Settings
Show Session High/Low Lines: Display the actual session extremes
Style/Color/Width: Customize line appearance
Show Labels: Toggle price labels for high/low levels
Extension Stats Settings
Show Statistical Levels on Chart: Display mean and median extension levels based on historical data
Extension Anchor Point: Choose whether to anchor from "Open" or "High/Low" of the session
Number of Sessions for Statistics: Set sample size (1-100, default 60) for calculating averages
Mean/Median High Extension: Separate styling for each statistical level (color, style, width)
Mean/Median Low Extension: Separate styling for downside statistical levels
Tables
Show Statistics Table: Display a summary table with current range, average range, difference, z-score, and sample size
Table Position: Choose from 9 positions (Bottom/Middle/Top + Center/Left/Right)
Table Text Size: Select from Auto, Tiny, Small, Normal, Large, or Huge
Display Settings
Projection Offset: Number of bars to extend lines forward (default 24)
Label Size: Choose from Tiny, Small, Normal, or Large
Price Decimal Precision: Set decimal places for price labels (0-6)
How It Works:
The indicator tracks the specified session period and calculates the session's open, high, low, and range. At the end of the session (9:00 AM by default), it projects all configured levels forward for the trading day. The statistical features analyze the last N sessions (you choose the number) to calculate typical extension behavior from either the session open or the session high/low points.
The z-score calculation helps identify whether the current session's range is normal, expanded, or contracted compared to recent history, allowing traders to adjust expectations for the rest of the day.
Use Case:
This indicator helps traders identify key support and resistance levels based on early session price action, understand current range context relative to historical averages, and spot potential reversal zones during specific time periods.
Note: This indicator is for informational purposes only and does not constitute investment advice. Always perform your own analysis before making trading decisions.

Robrechtian Long-Medium Breakout Trend SystemRobrechtian Long–Medium-Term Breakout Trend System
A professional, rule-based trend-following strategy designed to capture large, sustained price movements using pure price action and breakouts.
This system follows long-established trend-following philosophy: no prediction, no volatility targeting, and no profit targets. Only disciplined entries, position additions, and exits driven entirely by trend structure.
Core Principles
Breakout-driven entries: Initial positions are taken only when price breaks above/below the 80-day Donchian channel, confirming a long–medium-term trend shift.
Short-term confirmation: Breakouts must also exceed the 20-day channel, reducing false positives.
Trend-direction filter: A 50-day moving average slope filter ensures alignment with the broader trend.
Explosive bar filter: Entries avoid excessively large, single-candle expansions (>2.5× ATR(20)) to prevent chasing exhaustion spikes.
Pyramiding into strength: Additional units are added only when price makes fresh 20-day breakouts in the direction of the trend. No scaling out. No adding on dips.
Exit only on trend violation: Positions are closed exclusively when price breaks the opposite 80-day channel. This preserves unlimited upside while enforcing disciplined exits.
Pure trend philosophy: No volatility targeting, no smoothing, no discretionary overrides, no optimization for short-term performance.
Intended Use
This system is designed primarily for diversified futures portfolios, where diversification across dozens of globally liquid markets creates robustness and stability. However, it may also be used on individual assets for educational and analytical purposes.
The system embraces the core trend-following logic:
Small losses, big winners, and unlimited upside when trends persist.
⚠️ WARNINGS / DISCLAIMERS
⚠️ Warning 1 — This strategy is not optimized for single stocks
The Robrechtian Trend System is designed for multi-asset futures portfolios, not single equities.
Performance on individual tickers may vary greatly due to lack of diversification.
⚠️ Warning 2 — Trend following includes substantial drawdowns
Deep drawdowns are a normal and expected feature of all long-term trend-following systems.
The strategy does not attempt to smooth returns or manage volatility.
If you seek steady, low-volatility equity curves, this system is not suitable.
⚠️ Warning 3 — No volatility targeting or risk smoothing
This system intentionally avoids volatility-based position sizing.
Trades may experience larger fluctuations than systems using risk parity or vol targeting.
⚠️ Warning 4 — Not financial advice
This script is for educational and research purposes only.
Past performance does not guarantee future results.
Use at your own risk.
⚠️ Warning 5 — TradingView backtests have known limitations
TradingView does not simulate:
futures contract roll logic
slippage
real bid/ask spreads
liquidity conditions
limit-up/limit-down behavior
Results may vary from live market execution.

GRA v5 SNIPER# GRA v5 SNIPER - Documentation & Cheatsheet
## 🎯 Get Rich Aggressively v5 - SNIPER Edition
**Precision Futures Scalping | NQ • ES • YM • GC • BTC**
> **Philosophy:** *Quality over quantity. One sniper shot beats ten spray-and-pray attempts.*
---
## ⚡ QUICK CHEATSHEET
```
┌─────────────────────────────────────────────────────────────────────────────┐
│ GRA v5 SNIPER - QUICK REFERENCE │
├─────────────────────────────────────────────────────────────────────────────┤
│ │
│ 🎯 SIGNAL REQUIREMENTS (ALL MUST BE TRUE): │
│ ═══════════════════════════════════════════ │
│ ✓ Tier → B minimum (20+ pts NQ) │
│ ✓ Volume → 1.5x+ average │
│ ✓ Delta → 60%+ dominance (buyers OR sellers) │
│ ✓ Body → 70%+ of candle range │
│ ✓ Range → 1.3x+ average candle size │
│ ✓ Wicks → Small opposite wick (<50% of body) │
│ ✓ CVD → Trending with signal direction │
│ ✓ Session → London (3-5am ET) OR NY (9:30-11:30am ET) │
│ │
├─────────────────────────────────────────────────────────────────────────────┤
│ │
│ 📊 TIER ACTIONS: │
│ ════════════════ │
│ S-TIER (100+ pts) → 🥇 HOLD position, ride the wave │
│ A-TIER (50-99 pts) → 🥈 SWING for 2-3 minutes │
│ B-TIER (20-49 pts) → 🥉 SCALP quick, 30-60 seconds │
│ │
├─────────────────────────────────────────────────────────────────────────────┤
│ │
│ 🚨 ENTRY CHECKLIST: │
│ ═══════════════════ │
│ □ Signal appears (S🎯, A🎯, or B🎯) │
│ □ Table shows: Vol GREEN, Delta colored, Body GREEN │
│ □ CVD arrow matches direction (▲ for long, ▼ for short) │
│ □ Session active (LDN! or NY! in yellow) │
│ □ Enter at close of signal candle │
│ │
├─────────────────────────────────────────────────────────────────────────────┤
│ │
│ ⛔ DO NOT TRADE WHEN: │
│ ════════════════════ │
│ ✗ Session shows "---" (outside key hours) │
│ ✗ Vol shows RED (below 1.5x) │
│ ✗ Body shows RED (weak candle structure) │
│ ✗ Delta below 60% (no clear dominance) │
│ ✗ Multiple conflicting signals │
│ │
├─────────────────────────────────────────────────────────────────────────────┤
│ │
│ 📈 INSTRUMENT SETTINGS: │
│ ════════════════════════ │
│ NQ/ES (1-3 min): S=100, A=50, B=20 pts │
│ YM (1-5 min): S=100, A=50, B=25 pts │
│ GC (5-15 min): S=15, A=8, B=4 pts │
│ BTC (1-15 min): S=500, A=250, B=100 pts │
│ │
└─────────────────────────────────────────────────────────────────────────────┘
```
---
## 📋 DETAILED DOCUMENTATION
### What Makes SNIPER Different?
The SNIPER edition eliminates 80%+ of signals compared to standard GRA. Every signal that passes through has been validated by **8 independent filters**:
| Filter | Standard GRA | SNIPER GRA | Why It Matters |
|--------|-------------|------------|----------------|
| Volume | 1.3x avg | **1.5x avg** | Institutional participation |
| Delta | 55% | **60%** | Clear buyer/seller control |
| Body Ratio | None | **70%+** | No dojis or spinners |
| Range | None | **1.3x avg** | Significant price movement |
| Wicks | None | **<50% body** | Conviction in direction |
| CVD | None | **Required** | Trend confirmation |
| B-Tier Min | 10 pts | **20 pts** | Filter noise |
| Session | Optional | **Required** | Institutional hours |
---
### Signal Anatomy
When you see a signal like `A🎯`, here's what passed validation:
```
Signal: A🎯 LONG at 21,450.00
Validation Breakdown:
├── Points: 67.5 pts ✓ (A-Tier = 50-99)
├── Volume: 2.1x avg ✓ (≥1.5x required)
├── Delta: 68% Buyers ✓ (≥60% required)
├── Body: 78% of range ✓ (≥70% required)
├── Range: 1.6x avg ✓ (≥1.3x required)
├── Wick: Upper 15% ✓ (<50% of body)
├── CVD: ▲ Rising ✓ (Matches LONG)
└── Session: NY! ✓ (Active session)
RESULT: VALID SNIPER SIGNAL
```
---
### Table Legend
| Field | Reading | Color Meaning |
|-------|---------|---------------|
| **Pts** | Point movement | Gold/Green/Yellow = Tiered |
| **Tier** | S/A/B/X | Gold/Green/Yellow/White |
| **Vol** | Volume ratio | 🟢 ≥1.5x, 🔴 <1.5x |
| **Delta** | Buy/Sell % | 🟢 Buy dom, 🔴 Sell dom, ⚪ Neutral |
| **Body** | Body % of range | 🟢 ≥70%, 🔴 <70% |
| **CVD** | Cumulative delta | ▲ Bullish trend, ▼ Bearish trend |
| **Sess** | Session status | 🟡 Active, ⚫ Inactive |
---
### Trading Rules
#### Entry Rules
1. **Wait for signal** - Don't anticipate
2. **Verify table** - All conditions GREEN
3. **Enter at candle close** - Not during formation
4. **Position size by tier:**
- S-Tier: Full size
- A-Tier: 75% size
- B-Tier: 50% size
#### Exit Rules
| Tier | Target | Max Hold Time |
|------|--------|---------------|
| S | Let it run | 5-10 minutes |
| A | 1:1.5 R:R | 2-3 minutes |
| B | 1:1 R:R | 30-60 seconds |
#### Stop Loss
- Place at **opposite end of signal candle**
- For S-Tier: Allow 50% retracement
- For B-Tier: Tight stop, quick exit
---
### Session Priority
```
LONDON OPEN (3:00-5:00 AM ET)
════════════════════════════
• Best for: GC, European indices
• Characteristics: Stop hunts, reversals
• Look for: Sweeps of Asian session levels
NY OPEN (9:30-11:30 AM ET)
════════════════════════════
• Best for: NQ, ES, YM
• Characteristics: High volume, trends
• Look for: Continuation after 10 AM
```
---
### Common Mistakes to Avoid
| Mistake | Why It's Bad | Solution |
|---------|-------------|----------|
| Trading outside sessions | Low volume = fake moves | Wait for LDN! or NY! |
| Ignoring weak body | Dojis reverse | Body must be 70%+ |
| Fighting CVD | Swimming upstream | CVD must confirm |
| Oversizing B-Tier | Small moves = small size | 50% max on B |
| Chasing missed signals | FOMO loses money | Wait for next setup |
---
### Alert Setup
Configure these alerts in TradingView:
| Alert | Priority | Action |
|-------|----------|--------|
| 🎯 S-TIER LONG/SHORT | 🔴 High | Drop everything, check chart |
| 🎯 A-TIER LONG/SHORT | 🟠 Medium | Evaluate within 30 seconds |
| 🎯 B-TIER LONG/SHORT | 🟢 Low | Quick glance if available |
| LONDON/NY OPEN | 🔵 Info | Prepare for action |
---
### Pine Script v6 Notes
This indicator uses Pine Script v6 features:
- `request.security_lower_tf()` for intrabar delta
- Type inference for cleaner code
- Array operations for CVD calculation
**Minimum TradingView Plan:** Pro (for intrabar data)
---
## 🏆 Golden Rule
> **"If you have to convince yourself it's a good signal, it's not a good signal."**
The SNIPER edition is designed so that when a signal appears, there's nothing to think about. If all conditions are met, you trade. If any condition fails, you wait.
**Leave every trade with money. That's the goal.**
---
*© Alexandro Disla - Get Rich Aggressively v5 SNIPER*
*Pine Script v6 | TradingView*

Micro/Mini P&L [LDT]Overview
Micro/Mini P&L is a risk and P&L visualization tool built primarily for futures traders.
It provides accurate dollar-based calculations for either micros or minis, regardless of which contract type you are currently charting.
The indicator automatically detects your instrument (NQ, MNQ, ES, MES, YM, RTY, CL, GC, etc.) and adjusts point-value data accordingly, allowing you to chart one contract while evaluating risk for another.
This removes the need for manual conversions and keeps your position data consistent at all times.
Although optimized for futures, the tool also works on any other asset for general trade-level visualization.
Features
• Automatic instrument detection for major futures markets including NQ/MNQ, ES/MES, YM/MYM, RTY/M2K, CL/MCL, GC/MGC and others.
Point-value logic adjusts instantly based on the detected symbol ensuring accurate calculations without manual configuration.
• Micro/Mini display toggle, allowing you to calculate dollar values for either contract type regardless of which contract is on your chart.
Useful for traders who prefer charting minis whilst trading micros or the opposite.
• Trade-level visualization, including Entry, Take Profit and Stop Loss levels with automatically drawn lines and optional TP/SL zone shading for clear and structured display on the chart.
• Dynamic P/L calculations, showing both point-based and dollar-based metrics in real time.
This includes TP/SL dollar values, points to target/stop, real-time P/L and an optional risk-reward ratio.
• Adaptive risk table, displaying contract counts from 1 up to your selected maximum, total dollar risk for each row and highlighting your chosen contract size.
This provides a straightforward method for evaluating risk, scaling and position sizing.
• Customizable display options, including color settings, label visibility, extension length, bar offsets and table positioning.
This allows the tool to remain clean, unobtrusive and easy to integrate into any chart layout.
Purpose
This tool is designed to give futures traders a clear, consistent and reliable way to view dollar-accurate risk per contract without performing manual conversions.
Whether you trade micros or minis, the displayed values always align with your selected contract type, even when charting the opposite market.

GRAM SCALP_PDH/PDL/P.POC/P.VAL/P.VAH_9/21EMA)This is a simple scalping strategy for futures markets (e.g., MNQ/ES), designed for prop firm challenges that require consistency and good R/R. It focuses on intraday trades during NY session (9:30 ET onward), using bias, EMAs, and key levels from prior Globex session (18:00–17:00 ET).
Goal: Set-and-forget limit orders in bias direction, aiming for small, consistent wins.
Daily Bias (Trend Detection):
Based on the first 15-min candle (9:30–9:45 ET).
If close > open (green): LONG ONLY bias – background shades green, label says "LONG ONLY".
If close < open (red): SHORT ONLY bias – background shades red, label says "SHORT ONLY".
Trade only in bias direction to avoid counter-trend risks. No bias? Sit out.
EMAs for Entries/Confirmation:
9 EMA (orange): Fast line for short-term trend/pullbacks.
21 EMA (purple): Slower line for overall direction.
Entry idea: Wait for price to pull back to 9/21 EMA in bias direction, then enter on bounce/break (e.g., long above EMA on green bias).
Use as dynamic support/resistance – don't trade if price is far from EMAs.
Key Levels from Prior Session (Globex 18:00–17:00 ET):
PDH (Previous Day High): Gray line – potential resistance/target for longs.
PDL (Previous Day Low): Gray line – potential support/target for shorts.
Volume Profile (VP):
POC (Point of Control, orange): Highest volume price – strong magnet; price often returns here.
VAH (Value Area High, fuchsia circles): Top of 70% volume range – resistance; break above = bullish.
VAL (Value Area Low, fuchsia circles): Bottom of 70% volume range – support; break below = bearish.
Use levels for entries (e.g., bounce off VAL for long), stops (behind level), or targets (e.g., aim for POC/VAH).
Trading Rules:
Session: NY open (9:30 ET) to close (16:00 ET). Avoid news/high volatility.
Bias Only: After 9:45 ET, check label/color – trade longs on green, shorts on red.
Entries: Set limit orders at key levels/EMAs in bias direction. E.g., long bias: Buy limit at VAL or EMA pullback.
Risk Management:
Stop Loss: Behind nearest level (e.g., below VAL for long) or fixed 10-20 ticks.
Take Profit: 1:2 risk-reward or at next level (e.g., PDH/POC).
Position Size: 1-2% risk per trade; max 5 trades/day for prop rules.
Exits: Trail with EMAs or exit at EOD. No overnight holds.
Avoid: Choppy markets, gaps through levels, or no clear bias.
Why It Works:
Bias filters bad trades; EMAs confirm momentum; VP/PDH/PDL provide high-probability zones based on where volume/price settled overnight.
Simple, mechanical – ideal for prop challenges (rules on drawdown, consistency).
Backtest on 2-min charts; aim for 60%+ win rate on small scalps (5-20 ticks).
Customize in indicator settings (e.g., VP bin size, line colors). Test on demo before live. Not financial advice – trade at own risk.10 web pages

ETH SuperTrend Hull Strategy - 15min Futures(重制版)🟠 ETH SuperTrend Hull Strategy - 15min Futures
Strategy Overview
The "ETH SuperTrend Hull Strategy" is a sophisticated 15-minute trading system specifically designed for Bitcoin perpetual contracts. This advanced algorithm integrates SuperTrend indicators with Hull moving averages to deliver high-precision trend following through a triple-confirmation mechanism, featuring intelligent position management and multi-level take-profit systems.
Core Value Proposition
Triple Trend Confirmation: SuperTrend + Hull MA + ATR volatility filtering
Adaptive Take-Profit System: 6-level dynamic profit targets adjusted to market conditions
Smart Position Management: Three martingale modes with automatic sizing
Real-time Webhook Integration: Direct exchange connectivity for automated execution
🟠 Technical Framework
Multi-Layer Trend Detection
Layer 1 - SuperTrend Filter
pinescript
= ta.supertrend(supertrend_factor, supertrend_atr_period)
is_supertrend_long = direction < 0 // Bullish trend line
is_supertrend_short = direction >= 0 // Bearish trend line
Layer 2 - Hull MA Confirmation
pinescript
HMA = HMA(close, 73) // Hull Moving Average
hull_is_green = HULL > HULL // Uptrend confirmation
hull_is_red = HULL <= HULL // Downtrend confirmation
Layer 3 - ATR Breakout Signals
pinescript
xATR = ta.atr(5)
nLoss = key_value * xATR // Dynamic stop distance
Entry Conditions
Long Entry:
Price breaks above ATR trailing stop
Hull MA shows green uptrend
SuperTrend indicates bullish momentum
Price positioned above Hull MA
Short Entry:
Price breaks below ATR trailing stop
Hull MA shows red downtrend
SuperTrend indicates bearish momentum
Price positioned below Hull MA
🟠 Risk Management System
Position Sizing
text
Base Position = Initial Capital × Risk % / Entry Price × Leverage
Actual Position = Base Position × Martingale Multiplier (1.0-5.0x)
Martingale Modes
4x Mode: Conservative approach, maximum 4x position scaling
5x Mode: Balanced risk management, maximum 5x scaling
5x Big Mode: Aggressive growth with faster position increases
Dynamic Take-Profit System
6-Level Profit Targets:
TP1: 2.2×ATR (Close 30%)
TP2: 4.5×ATR (Close 25%)
TP3: 7.5×ATR (Close 20%)
TP4: 10.5×ATR (Close 10%)
TP5: 15.5×ATR (Close 7%)
TP6: 20.5×ATR (Close 3%)
ATR Adaptive Adjustment:
Short-term ATR > Long-term ATR: TP distance +0.5
Short-term ATR < Long-term ATR: TP distance -0.5
🟠 Configuration Parameters
Core Settings
pinescript
// Trend Sensitivity
key_value = 2.0 // ATR multiplier (lower = more sensitive)
supertrend_factor = 3.0 // SuperTrend factor
// Risk Management
risk_percent = 19.9 // Per trade risk %
leverage = 1.0 // Leverage multiplier
Hull MA Configuration
pinescript
length = 73 // Hull period (55-200)
modeSwitch = "Hma" // Hull variant (Hma/Thma/Ehma)
🟠 Quick Start Guide
Initial Setup
Apply to BTCUSDT perpetual 15-minute chart
Configure Webhook Signal ID and User ID
Adjust position parameters according to risk preference
Signal Monitoring
Long Signals: Green arrows with Hull MA turning green
Short Signals: Red arrows with Hull MA turning red
Trend Direction: SuperTrend line color changes
Execution Workflow
Wait for triple-signal confluence
Confirm all entry conditions met
System automatically calculates position size and TP levels
Webhook sends trade instructions to connected platform
Advanced Features
Heikin-Ashi Mode: Smooth price data using Heikin-Ashi candles
Fixed Position Mode: Disable martingale, use fixed sizing
Multi-Timeframe: Higher timeframe confirmation integration
🟠 ETH SuperTrend Hull Strategy - 15min Futures
策略概述
"ETH超级趋势Hull策略"是一款专为比特币永续合约设计的15分钟短线交易系统。该策略融合超级趋势指标与Hull均线,通过三重过滤机制实现高精度趋势跟踪,具备智能仓位管理和多级止盈体系。
核心价值
三重趋势确认:Supertrend + Hull均线 + ATR波动过滤
自适应止盈系统:6级动态止盈,根据市场波动调整目标
智能仓位管理:支持三种倍投模式,自动调整仓位规模
实时Webhook通知:直连交易平台,实现自动化执行
🟠 策略原理
趋势识别系统
第一层 - 超级趋势过滤
pinescript
= ta.supertrend(supertrend_factor, supertrend_atr_period)
is_supertrend_long = direction < 0 // 绿色趋势线
is_supertrend_short = direction >= 0 // 红色趋势线
第二层 - Hull均线确认
pinescript
HMA = HMA(close, 73) // Hull移动平均线
hull_is_green = HULL > HULL // 上升趋势
hull_is_red = HULL <= HULL // 下降趋势
第三层 - ATR突破信号
pinescript
xATR = ta.atr(5)
nLoss = key_value * xATR // 动态止损距离
入场条件
多头入场:
价格突破ATR追踪止损
Hull均线呈绿色上升趋势
超级趋势显示看涨信号
价格位于Hull均线上方
空头入场:
价格跌破ATR追踪止损
Hull均线呈红色下降趋势
超级趋势显示看跌信号
价格位于Hull均线下方
🟠 风险管理
仓位计算
text
基础仓位 = 初始资金 × 风险比例% / 入场价格 × 杠杆倍数
实际仓位 = 基础仓位 × 倍投系数 (1.0-5.0倍)
倍投模式
4倍模式:保守型,最大4倍加仓
5倍模式:均衡型,最大5倍加仓
5倍大模式:激进型,更快仓位增长
动态止盈系统
6级止盈目标:
TP1: 2.2×ATR (平仓30%)
TP2: 4.5×ATR (平仓25%)
TP3: 7.5×ATR (平仓20%)
TP4: 10.5×ATR (平仓10%)
TP5: 15.5×ATR (平仓7%)
TP6: 20.5×ATR (平仓3%)
ATR自适应调整:
短期ATR > 长期ATR:止盈距离+0.5
短期ATR < 长期ATR:止盈距离-0.5
🟠 参数配置
核心参数
pinescript
// 趋势敏感度
key_value = 2.0 // ATR乘数,值越小越敏感
supertrend_factor = 3.0 // 超级趋势因子
// 风险管理
risk_percent = 19.9 // 单次交易风险%
leverage = 1.0 // 杠杆倍数
Hull均线设置
pinescript
length = 73 // Hull周期 (55-200)
modeSwitch = "Hma" // Hull变体 (Hma/Thma/Ehma)
🟠 使用指南
初始设置
添加到BTCUSDT永续合约15分钟图表
配置Webhook信号ID和用户ID
根据风险偏好调整仓位参数
信号监控
多单信号:绿色箭头,Hull均线转绿
空单信号:红色箭头,Hull均线转红
趋势方向:超级趋势线颜色变化
执行流程
等待三重信号共振
确认入场条件满足
系统自动计算仓位和止盈
通过Webhook发送交易指令
高级功能
K线均线模式:使用Heikin-Ashi平滑价格
固定仓位模式:禁用倍投,固定仓位大小
多时间框架:集成更高时间框架确认

AlgoIndexOS-ES-FuturesAlgoIndexOS — ES Futures Strategy v2.0 (5-Minute RTH)
Scope (read first)
ES on 5-minute only, RTH session. The strategy operates on U.S. Regular Trading Hours (09:30–16:00 ET) using a 5-minute ES chart. It builds an Opening Session Range (OSR) from the RTH open, then runs a breakout engine when internal quality conditions are met. Exits are target-based with an intrabar touch-to-flat safety. Positions are flattened at the RTH session end by default. Alerts can post JSON to your Webhook URL for automation.
What this is
One intraday engine with four curated presets (“Stages”) tuned for distinct segments of the NY session. Stages keep the core logic consistent while applying time-of-day context and conservative governors. Single invite-only listing; not a multi-post suite.
How it trades (high-level)
Range context: Builds and locks the OSR from the opening bell; entries only arm after the range is set.
Quality gating: Trades only when internal trend/volatility/confirmation conditions align (no parameter disclosure).
Breakout execution: Signals at bar close; bracket exits manage take-profit (limit) with an intrabar “TP-touch” safety to avoid phantom fills; optional stop-loss.
Session safety: Positions flat at RTH close by default (time exit).
(No settings or thresholds are disclosed; presets encapsulate research choices.)
Stages (session templates; one engine)
A single Stage selector chooses among four presets optimized for different parts of the RTH session (morning vs mid-day; long/short focus). Internal parameters remain fixed to preserve tested behavior.
Public inputs (kept minimal)
Stage (choose your preset)
TP / SL (points) shown for transparency; effective values are governed by the selected preset to maintain consistency with research.
Optional display overlays (status line/markers) for readability.
Alerts (how to use)
Create an alert on the strategy and choose Strategy → Order fills. Use a webhook if you want automation. The payload includes the exact chart symbol so it works on ES1! or a specific ES contract:
{
"tv_symbol": "{{ticker}}",
"tv_exchange": "{{exchange}}",
"action": "buy|sell|exit",
"price": {{close}},
"time": "{{timenow}}"
}
If your receiver needs a fixed root (e.g., “ES”), map it on your server using tv_symbol for context.
Backtest & assumptions
Backtest assumptions (initial capital, commission, slippage, margin) are user-configurable in TradingView. Results on your chart reflect your settings. This script evaluates ES fills on 5-minute RTH bars; live execution will differ.
Operating notes
Use on ES only, 5-minute timeframe, RTH session.
If you run multiple Stages, use separate charts/tabs and coordinate net exposure in your own tooling if needed.
Publish with a clean chart for clarity.
Disclosures (compliance)
No investment advice. This script is for research/education and tooling only. It does not provide investment, legal, tax, or accounting advice and does not recommend any security, instrument, or strategy. Use at your own risk.
Hypothetical performance (CFTC 4.41). Hypothetical or simulated results have many limitations, and no representation is made that any account will achieve similar outcomes. Past performance is not necessarily indicative of future results.
Futures risk. Trading futures involves substantial risk of loss and is not suitable for all investors. Leverage, gaps, slippage, and connectivity can cause losses exceeding initial investment.
Backtesting limitations. Results depend on data quality, chart resolution, session filters, and user assumptions; live execution will differ.
Intellectual property. © 2025 AlgoIndex. All Rights Reserved. Redistribution, resale, or decompilation prohibited without written consent.

Risk-On / Risk-Off Toolkit [SB1] (NQ, RTY, YM) VIXDescription:
The Risk-On / Risk-Off Toolkit is a professional-grade market context indicator designed to help traders quickly identify broad market sentiment shifts and gauge risk appetite. By combining major US equity futures (NQ, RTY, YM) with VIX dynamics, this toolkit provides clear visual signals of “Risk-On” (bullish, lower volatility environment) and “Risk-Off” (bearish, higher volatility environment) conditions. This is ideal for traders using discretionary analysis, swing strategies, intraday scalping, or portfolio positioning decisions.
My Personal Thoughts: Utilize all 3 charts to Identify which is Leading and who is lagging between the 3 (NQ, RTY, YM) Key Features:
Futures Trend Analysis:
Monitors the Nasdaq 100 (NQ), Russell 2000 (RTY), and Dow Jones (YM) futures in real-time.
Determines bullish/bearish bias based on each futures contract’s current close relative to its open.
Identifies when all three indices are moving in sync, highlighting broad market directional alignment.
VIX Confirmation:
Integrates the CBOE Volatility Index (VIX) to gauge market risk sentiment.
Confirms Risk-On conditions when VIX is falling while all three futures are bullish.
Confirms Risk-Off conditions when VIX is rising while all three futures are bearish.
Optional background shading visually highlights Risk-On (green) and Risk-Off (red) conditions for quick, intuitive assessment.
Strong Body Candle Signals:
Detects high conviction candlestick moves where the body represents at least 85% of the total range.
Confirms whether the candle closes near its extreme (top for bullish, bottom for bearish) within 15% of the range.
Plots arrows for strong bullish or bearish candles:
Green triangle-up for bullish strong candles
Red triangle-down for bearish strong candles
Provides a visual cue for intraday or swing traders to confirm trend momentum without cluttering the chart with labels.
Alert System:
Alerts can be set for Risk-On alignment: all monitored futures are bullish and VIX is falling.
Alerts can also be set for Risk-Off alignment: all monitored futures are bearish and VIX is rising.
Ensures traders never miss shifts in broad market sentiment, suitable for both intraday and end-of-day review.
Table Summary:
Provides a top-right summary table of each monitored market and VIX:
Displays Index Name and Current Bias (Bullish/Bearish/Neutral).
Highlights bullish conditions in green and bearish conditions in red.
Includes VIX status as “↓ Falling”, “↑ Rising”, or “Flat”, providing a quick visual reference of volatility trends.
Customizable Visuals:
Control the visibility of strong candle arrows.
Maintains dynamic bar coloring for strong candle moves (green for bullish, red for bearish).
How to Use the Risk-On / Risk-Off Toolkit:
Trend Confirmation: Use the alignment of NQ, RTY, and YM to determine whether the overall market environment is bullish or bearish.
Risk Sentiment Filter: Use VIX confirmation to identify if traders are in a risk-on or risk-off sentiment. This is especially useful for adjusting position sizing, hedging, or timing entries.
Momentum Validation: Strong candle arrows indicate decisive moves, providing additional confirmation for trade entries, breakouts, or trend continuation.
Alerts & Visual Cues: Set alerts to be notified whenever Risk-On or Risk-Off conditions are met, helping you act in real-time.
Quick Reference: Use the summary table for a bird’s-eye view of market alignment across indices and VIX, avoiding the need to track multiple charts simultaneously.
Why This Indicator is Unique:
Combines three major US indices with volatility confirmation to identify true macro market sentiment shifts.
Provides both visual and alert-based signals for actionable insights.
The inclusion of strong candle arrows gives intraday and swing traders a clear, low-latency cue for high-probability moves.
Perfect for multi-timeframe analysis and adaptable to both short-term and long-term strategies.
Indicator Name Justification:
The name “Risk-On / Risk-Off Toolkit ” accurately reflects the core function: identifying broad market risk appetite and sentiment alignment across key indices with volatility confirmation. It communicates instantly that the tool helps traders understand when the market is favoring risk-taking (Risk-On) versus risk-aversion (Risk-Off).

Buy on Blue, Sell on Red (EMA + optional RSI) TyusEThis indicator is a trend-following system that helps traders identify potential buy and sell opportunities using a combination of EMA crossovers and an optional RSI filter for confirmation.
It plots:
🔵 Blue dots (BUY signals) when the fast EMA crosses above the slow EMA — signaling bullish momentum.
🔴 Red dots (SELL signals) when the fast EMA crosses below the slow EMA — signaling bearish momentum.
You can optionally filter these signals using the RSI (Relative Strength Index) to avoid false breakouts — for example, only taking BUY signals when RSI is above 55 (showing strength) and SELL signals when RSI is below 45 (showing weakness).
⚙️ Features
Adjustable Fast EMA and Slow EMA lengths
Optional RSI confirmation filter
Customizable RSI thresholds for entries
“Confirm on bar close” setting to reduce repainting
Built-in alert conditions for real-time notifications
💡 How to Use
Use blue dots as potential long entries and red dots as potential short entries.
Confirm direction with overall trend, structure, or higher timeframe alignment.
Combine with support/resistance, volume, or price action for best results.
⚠️ Note
This is a technical tool, not financial advice. Always backtest and use proper risk management before trading live markets.
T.E

Futures Fighter MO: Multi-Confluence Day Trading System ADX/SMI👋 Strategy Overview: The Multi-Confluence Mashup
The Futures Fighter MO is a comprehensive, multi-layered day trading strategy designed for experienced traders focusing on high-liquidity futures contracts (e.g., NQ, ES, R2K).
This strategy is a sophisticated mashup that uses the 1-minute chart for surgical entries while enforcing strict environmental filtering through higher-timeframe data. We aim to capture high-conviction moves only when multiple, uncorrelated signals align.
🧠 How the Logic Works (Concepts & Confluence)
Our logic is built on four pillars, which must align for a trade to be executed:
Primary Trend Filter
Indicators :
ADX/DMI (15-Minute Lookback)
Role :
Price action is filtered to ensure the ADX (17/14) is above 25, confirming a strong, prevailing market trend (Bullish or Bearish). Trades are strictly rejected during "Flat" (sideways) market regimes.
Entry Signal Types
The system uses multiple entry types:
- 🟢 Trend Long/Short: A breakout/rejection near the 200-Period EMA is confirmed by the primary ADX trend.
- 🔴 Engulfing Rejection: A strong signal when a Bullish/Bearish Engulfing or Doji prints near the long-term 500-Period EMA (emaGOD) while the Stochastic Momentum Index (SMI on 30M) is in an extreme overbought/oversold state (below $-40$ or above $40$).
Volatility & Volume Confirmation
Indicators: Average True Range (ATR) and 20-Period SMA of Volume
Role: Every entry requires a volume spike (Current Volume $> 1.5 \times$ SMA Volume) to confirm that the move is supported by significant liquidity. Volatility is tracked via ATR to define bar range and stop boundaries.
Structural Guardrails
Indicators: Daily Pivot Points (PP, S1-S3, R1-R3)
Role: Trades are disabled if the current bar's price range intersects with a Daily Pivot Point. This is a critical filter to avoid high-chop consolidation zones near key structural levels.
📊 Strategy Results & Required Disclosures
I strive to publish backtesting results that are transparent and realistic for the retail futures trader.
- Initial Capital: $50,000 - A realistic base for Mini/Micro futures contracts.
- Order Size: 1 Contract (Pyramiding up to 3) - Conservative risk relative to the account size.
- Commission: $0.11 USD per order - Represents realistic costs for low-cost brokers.
- Slippage: 2 Ticks - Accounts for expected market friction.
⚠️ Risk Management & Deviations
Stop-Loss: The strategy uses a dynamic stop-loss system where positions are closed upon a reversal (e.g., breaking the 50-Period EMA or failure to hold a Pivot Point), rather than a fixed tick-based stop. This is suited for experienced traders using a low relative risk (single Micro-contract entry) on a larger account. Users must confirm that the first entry's maximum potential loss remains below $10\%$ of their capital for compliance.
Trade Sample Size: Due to data limitations of the TradingView Essential plan (showing $\approx 50$ trades over 2 weeks), the sample size is under the ideal $100+$ target. Justification: This system is designed to generate signals across a portfolio of correlated futures markets (NQ, ES, R2K, Gold, Crude), meaning the real sample size for a user tracking the portfolio is significantly higher.
Drawdown Control: This strategy is designed for manual management. It requires the user to turn the script/alerts OFF after a significant drawdown and only reactivate it once a recovery trend is established externally.
The strategy uses a combination of dynamic trailing stops, structural support/resistance zones, and a fixed profit target to manage open positions.
🛑 Strategy Exit Logic
1. General Stop-Loss (Dynamic Trailing Stop)
These conditions act as the primary dynamic stop, closing the position if the market reverses past a key Moving Average (MA):
- Long Positions Closed When: The current bar's close crosses under the 50-Period EMA (emaLong).
- Short Positions Closed When: The current bar's close crosses above the 50-Period EMA (emaLong).
2. Profit Target (Fixed Percentage)
The script includes a general exit based on a user-defined profit percentage:
Take Profit Trigger: The position is closed when the currentProfitPercent meets or exceeds the input Profit Target (%) (default is 1.0% of the entry price).
3. Structural Exits (Daily Pivot Points)
These exits are high-priority, "close all" orders that trigger when the price fails to hold or reclaims a recent Daily Pivot Point, suggesting a failure of the current move.
- VR Close All - Long ($\sym{size} > 0$) - Price crosses under a Daily Resistance Level (R1, R2, or R3) minus 1 ATR within the last 10 bars. This indicates the current momentum failed to hold Resistance as support.
- VS Close All - Short ($\sym{size} < 0$) - Price crosses above a Daily Support Level (S1, S2, or S3) plus 1 ATR within the last 10 bars. This indicates the current momentum failed to hold Support as resistance.
4. Trend Failure Exit (Trend-Following Signals Only)
This exit protects against holding a position when the primary high-timeframe trend used for the entry has failed:
- Long Positions Closed When: The primary trend is no longer "bullish" for more than 2 consecutive bars (i.e., it turned "bearish" or "flat").
- Short Positions Closed When: The primary trend is no longer "bearish" for more than 2 consecutive bars (i.e., it turned "bullish" or "flat").
5. End of Day (EOD) Session Control
The final hard exits based on time:
- End of Session (EoS): At 11:30 AM, new trades are disabled (TradingDay := false). Open positions are kept.
- End of Day (EoD): At 1:30 PM, all remaining open positions are closed (strategy.close_all).
🤝 Development & Disclaimer
This script and description were created with assistance from Gemini and GitHub Copilot. My focus is on helping fellow real estate investors and day traders develop mechanically sound systems.
Disclaimer: This is for educational purposes only and does not constitute financial advice. Always abide by the Realtor Code and manage your own risk.

NY VIX Channel Trend US Futures Day Trade StrategyNY VIX Channel Trend Strategy
Summary in one paragraph
Session anchored intraday strategy for index futures such as ES and NQ on one to fifteen minute charts. It acts only after the first configurable window of New York Regular Trading Hours and uses a VIX derived daily implied move to form a realistic channel from the session open. Originality comes from using a pure implied volatility yardstick as portable support and resistance, then committing in the direction of the first window close relative to the open. Add it to a clean chart and trade the simple visuals. For conservative alerts use on bar close.
Scope and intent
• Markets. Index futures ES and NQ
• Timeframes. One to thirty minutes
• Default demo. ES1 on five minutes
• Purpose. Provide a portable intraday yardstick for entries and exits without curve fitting
• Limits. This is a strategy. Orders are simulated on standard candles
Originality and usefulness
• Unique concept. A VIX only channel anchored at 09:30 New York plus a single window trend test
• Addresses. False urgency at session open and unrealistic bands from arbitrary multipliers
• Testability. Every input is visible and the channel is plotted so users can audit behavior
• Portable yardstick. Daily implied move equals VIX percent divided by square root of two hundred fifty two
• Protected status. None. Method and use are fully disclosed
Method overview in plain language
Take the daily VIX or VIX9D value, convert it to a daily fraction by dividing by square root of two hundred fifty two, then anchor a symmetric channel at the New York session open. Observe the first N minutes. If that window closes above the open the bias is long. If it closes below the open the bias is short. One trade per session. Exits occur at the channel boundary or at a bracket based on a user selected VIX factor. Positions are closed a set number of minutes before the session ends.
Base measures
Return basis. The daily implied move unit equals VIX percent divided by square root of two hundred fifty two and serves as the distance unit for targets and stops.
Components
• VIX Channel. Top, mid, bottom lines anchored at 09:30 New York. No extra multipliers
• Window Trend. Close of the first N minutes relative to the session open sets direction
• Risk Bracket. Take profit and stop loss equal to VIX unit times user factor
• Session Window. Uses the exchange time of the chart
Fusion rule
Minimum gates count equals one. The trade only arms after the window has elapsed and a direction exists. One entry per session.
Signal rule
• Long when the window close is above the session open and the window has completed
• Short when the window close is below the session open and the window has completed
• Exit on channel touch. Long exits at the top. Short exits at the bottom
• Flat thirty minutes before the session close or at the user setting
Inputs with guidance
Setup
• Use VIX9D. Width source. Typical true for fast tone or false for baseline
• Use daily OPEN. Toggle for sensitivity to overnight changes
Logic
• Window minutes. Five to one hundred twenty. Larger values delay entries and reduce whipsaw
• VIX factor for TP. Zero point five to two. Raising it widens the profit target
• VIX factor for SL. Zero point five to two. Raising it widens the stop
• Exit minutes before close. Fifteen to ninety. Raising it exits earlier
Properties visible in this publication
• Initial capital one hundred thousand USD
• Base currency USD
• request.security uses lookahead off
• Commission cash per contract two point five $ per each contract. Slippage one tick
• Default order size method FIXED with value one contract. Pyramiding zero. Process orders on close ON. Bar magnifier OFF. Recalculate after order is filled OFF. Calc on every tick ON
Realism and responsible publication
No performance claims. Past results never guarantee future outcomes. Fills and slippage vary by venue. Shapes can move while a bar forms and settle on close. Strategy uses standard candles.
Honest limitations and failure modes
Economic releases and thin liquidity can break the channel. Very quiet regimes can reduce signal contrast. Session windows follow the exchange time of the chart. If both stop and target can be hit within one bar, assume stop first for conservative reading without bar magnifier.
Works best in liquid hours of New York RTH. Very large gaps and surprise news may exceed the implied channel. Always validate on the symbols you trade.
Entries and exits
• Entry logic. After the first window, go long if the window close is above the session open, go short if below
• Exit logic. Long exits at the channel top or at the take profit or stop. Short exits at the channel bottom or at the take profit or stop. Flat before session close by the configured minutes
• Risk model. Initial stop and target based on the VIX unit times user factors. No trail and no break even. No cooldown
• Tie handling. Treat as stop first for conservative interpretation
Position sizing
Fixed size one contract per trade. Target risk per trade should generally remain near one percent of account equity. Risk is based on the daily volatility value, the max loss from the tests for one year duration with 5min chart was 4%, while the avg loss was below <1% of the total capital.
If you have any questions please let me know. Thank you for coming by !

Crypto Futures Basis Tracker (Annualized)🧩 What is Basis Arbitrage
Basis arbitrage is a market-neutral trading strategy that exploits the price difference between a cryptocurrency’s spot and its futures markets.
When futures trade above spot (called contango), traders can buy spot and short futures, locking in a potential yield.
When futures trade below spot (backwardation), the reverse applies — short spot and go long futures.
The yield earned (or cost paid) by holding this position until expiry is called the basis. Expressing it as an annualized percentage allows comparison across different contract maturities.
⚙️ How the Indicator Works
This tool calculates the annualized basis for up to 10 cryptocurrency futures against a chosen spot price.
You select one spot symbol (e.g., BITSTAMP:BTCUSD) and up to 10 futures symbols (e.g., DERIBIT:BTCUSD07X2025, DERIBIT:BTCUSD14X2025, etc.).
The script automatically computes the days-to-expiry (DTE) and the annualized basis for each future.
A table displays for each contract: symbol, expiry date, DTE, last price, and annualized basis (%) — making it easy to compare the forward curve across maturities.
⚠️ Risks and Limitations
While basis arbitrage is often considered low-risk, it’s not risk-free:
Funding and financing costs can erode returns, especially when borrowing or using leverage.
Exchange or counterparty risk — if one leg of the trade fails (e.g., exchange default, margin liquidation), the hedge breaks.
Execution and timing risk — the basis can tighten or invert before both legs are opened.
Liquidity differences — thin futures may have large bid-ask spreads or slippage.
Use this indicator for analysis and monitoring, not as an automated trading signal.
Disclaimer: Please remember that past performance may not be indicative of future results. Due to various factors, including changing market conditions, the strategy may no longer perform as well as in historical backtesting. This post and the script don't provide any financial advice.

FUTURA ORB.o3 Stategy (Gap + Dynamic Risk)ORB Strategy
Includes Mini & Micro Futures
Dynamic Risk based position sizing
Adjustable RR Levels
Gap Detection
Default settings are for NQ & MNQ.
Adjust as needed for different futures.

MNQ Hybrid Scalper Pro - Advanced NASDAQ Futures Scalping System🎯 Overview
The MNQ Hybrid Scalper Pro is a comprehensive scalping system engineered specifically for NASDAQ futures traders. This indicator implements a modern hybrid approach that combines institutional-grade VWAP analysis with momentum oscillators optimized for the unique volatility characteristics of the NASDAQ market. Developed through extensive research on MNQ/NQ price action patterns, this indicator provides clear, actionable signals while filtering out market noise during high-volatility periods.
✨ Key Features
1. VWAP Foundation
Session-anchored VWAP with automatic reset
Dynamic standard deviation bands (1σ and 2σ)
Color-coded price bars based on VWAP positioning
VWAP test detection with momentum confirmation
2. Optimized Momentum Suite
Fast RSI (7): Aggressive settings (85/15) for quick scalping signals
Scalping MACD (5,13,6): Optimized parameters with SMA option
Quick Stochastic (9,3,3): Tuned for 1-minute chart responsiveness
Divergence Detection: Automated bullish/bearish divergence alerts
3. Multi-Timeframe Trend Filter
Triple EMA system (9, 21, 50) on current and higher timeframes
Trend strength scoring (-3 to +3) for directional bias
Prevents counter-trend trades in strong trending markets
Visual trend alignment indicators
4. Smart Signal Generation
Long Signals: VWAP pullback + RSI oversold + MACD bullish turn + HTF trend alignment
Short Signals: VWAP rally + RSI overbought + MACD bearish turn + HTF trend alignment
Signal cooldown period to prevent overtrading
Session-based filtering for optimal trading windows
5. Risk Management Visualization
Automatic profit target levels (10 & 20 points)
Dynamic stop loss levels (6 & 8 points)
Risk/reward ratio calculation (minimum 1.5:1)
Breakeven level display after 5 points profit
Visual entry, target, and stop lines on chart
6. Session Intelligence
NY opening range highlight (first 30 minutes)
Optimal scalping window shading (9:30-11:30 AM EST)
Major session markers (Asia, Europe, NY)
Session countdown timer
Contract rollover reminders
7. Real-Time Performance Dashboard
Current trend status across timeframes
Signal statistics and win rate tracking
Position relative to VWAP
Momentum indicator status (OB/OS/Neutral)
Volume analysis (relative to 20-period average)
Volatility monitoring with ATR spike detection
8. Professional Alert System
High-probability entry alerts with specific levels
VWAP test notifications with momentum confirmation
Target and stop loss hit alerts
Trend alignment notifications
Comprehensive alert messages with entry, stop, and target prices
📈 How to Use
Optimal Setup:
Timeframe: Best on 1-minute charts (also works on 3-min and 5-min)
Instrument: Optimized for MNQ (Micro E-mini NASDAQ), works with NQ
Session: Most effective during NY session (9:30-11:30 AM EST)
Chart Type: Standard candlestick or bars
Signal Interpretation:
Green Triangle (▲): Long entry signal - all conditions aligned for upward scalp
Red Triangle (▼): Short entry signal - all conditions aligned for downward scalp
DIV Labels: Momentum divergence detected - potential reversal zones
Colored Bars: Green = above VWAP (bullish bias), Red = below VWAP (bearish bias)
Entry Checklist:
Wait for signal arrow to appear
Confirm trend alignment in dashboard (HTF Trend)
Check momentum status isn't extreme
Verify you're within optimal trading window
Enter at market with predetermined stop and target
⚙️ Customization Options
Display Settings:
Toggle individual components on/off
4 color schemes (Professional, Dark, Light, Classic)
Adjustable transparency and visual elements
Dashboard position selection
Signal Settings:
Adjust momentum indicator parameters
Modify risk/reward levels
Configure session filters
Set signal cooldown periods
Advanced Features:
Multi-timeframe period adjustment
Volatility filter sensitivity
Contract type selection (MNQ/NQ)
Alert configuration options
📊 Best Practices
Start in Simulation: Test the indicator in paper trading first
Respect the Trend: Don't fight the higher timeframe trend
Manage Risk: Use the suggested stop losses consistently
Time Your Trades: Focus on the optimal scalping window
Confirm Signals: Best results when multiple confirmations align
⚠️ Important Notes
Supplementary Tool: This indicator supplements but doesn't replace proper market analysis and order flow reading
No Repainting: All signals are confirmed on bar close
Education Required: Understanding of scalping principles recommended
Risk Management: Always use proper position sizing and risk management
Market Conditions: Performance varies with market volatility and conditions
🎓 Educational Value
This indicator serves as an excellent educational tool for:
Learning VWAP-based trading strategies
Understanding momentum indicator optimization
Practicing multi-timeframe analysis
Developing systematic scalping approaches
Risk management visualization
💻 Technical Specifications
Pine Script Version: v6
Calculation Method: Non-repainting, real-time
Performance: Optimized for minimal lag
Compatibility: All TradingView plan levels
Updates: Regularly maintained and improved
🏆 What Makes This Unique
Unlike generic indicators, the MNQ Hybrid Scalper Pro is specifically engineered for NASDAQ futures volatility patterns. It combines institutional trading concepts (VWAP) with retail-friendly visualization and clear signals, bridging the gap between professional and accessible trading tools.
📬 Support & Feedback
Questions, suggestions, or feedback? Leave a comment below or send a private message. Your input helps improve the indicator for the entire community.
CME_MINI:MNQ1!
Disclaimer: This indicator is for educational and informational purposes only. It does not constitute financial advice. Trading futures involves substantial risk of loss and is not suitable for all investors. Past performance is not indicative of future results. Always conduct your own analysis and consult with a qualified financial advisor.

Futures Day Trading Key Levels by Dhawal Ranka
Hey everyone, thank you for using this script, let me know in the comments how you feel about it!
What this script does:
This indicator renders one consolidated map of intraday reference levels for futures (e.g., ES, NQ, GC, CL). It is session-aware and draws:
- Previous ETH day High/Low/Close
- Previous RTH High/Low/Close (built from your RTH session)
- Today’s developing RTH High/Low and Mid
- Overnight (ON) session High/Low
- Opening Range (first N minutes of RTH): OR High/Low
- VWAP (day-anchored) with optional ±σ bands
- Floor Pivots (PP/R1/S1/R2/S2) from prior ETH daily bar
- ADR projections (Up/Down) using a configurable lookback and anchor
- Settlement: prior official settlement and today’s projected settle (with manual override)
- Weekly/Monthly context: prior W/M High/Low/Close and current W/M Open
- Minimal right-edge text tags (instead of big boxes) that sit on the price scale line and auto-pack when levels coincide
All lines extend across the chart to make confluence obvious without clutter.
How it works (methods & calculations)
Sessions
The script exposes two user sessions and a time zone:
RTH (e.g., 09:30–16:00 America/New_York)
ON (e.g., 18:00–09:29 America/New_York)
Session membership is computed with time(timeframe, session, tz) != 0.
RTH H/L/C (prev) are aggregated intrabar: on RTH start we seed H/L; while inRTH we update; on RTH end we store the close.
Previous Day (ETH) levels
request.security(syminfo.tickerid, "D", high /low /close ) supplies PDH/PDL/PDC on the continuous ETH daily.
Opening Range
On RTH start we mark orStartTime.
While RTH is active and elapsed time < N minutes, we track the running high/low.
When elapsed ≥ N minutes, we freeze OR High/Low.
VWAP & ±σ bands (intraday)
Day-anchored VWAP uses ta.vwap(hlc3).
Bands: standard deviation of (close − vwap) from day start, accumulated inline:
stdev = sqrt( mean(dev^2) − mean(dev)^2 )
Bands = vwap ± k * stdev (user multiplier).
Floor Pivots (classic)
Using prior ETH daily H/L/C:
PP = (H + L + C) / 3
R1 = 2*PP − L, S1 = 2*PP − H
R2 = PP + (H − L), S2 = PP − (H − L).
ADR projections
Daily range series rng = request.security(..., "D", high - low).
ADR = SMA(rng, L) (default L=14).
Anchor is user-selectable: today’s open or yesterday’s close.
Projections: ADR Up = anchor + ADR/2, ADR Down = anchor − ADR/2.
Settlement
Prev Settle defaults to prior ETH daily close but can be overridden manually for markets where official settlement differs from feed close.
Today Projected Settle uses the current ETH daily close value.
Weekly / Monthly context
Prior W/M H/L/C from "W"/"M" with , plus current W/M Open.
Rendering & label logic (originality)
Lines are persistent: each named level owns one line object that is updated, not re-created—keeps resource use low and avoids “too many plots”.
Right-edge labels are text-only (no box) placed at x = bar_index + offset and yloc.price.
When multiple levels share (almost) the same price, labels are packed side-by-side using a small bucketing algorithm:
Prices are bucketed within ±½ tick.
Each label gets a position index inside its bucket; the final x-offset = baseOffset + index*step + priority.
Priorities nudge important tags (e.g., Settle/RTH levels) closer to the price scale so they remain readable.
Why this is published & what’s original
It’s not a simple mashup: the script’s utility is the session-aware aggregation, the OR timing logic, the intraday σ calculation around VWAP, the line-persistence manager, and the label packing with priorities that keeps the right edge readable even when many levels coincide.
The closed-source protection covers the packing/priority scheme and the persistent object management that make it practical on busy futures charts without hitting Pine limits.
How to use
Set your sessions & time zone
Choose RTH/ON session windows (the defaults match CME equity index futures) and the time zone of your charting workflow.
Toggle components
Enable only the layers you need (e.g., VWAP bands off if you want a cleaner chart).
Opening Range length (minutes) is adjustable.
Settlement
If your broker/feed’s daily close isn’t the official settlement, enter a manual settle value for the prior day.
Read the right edge
Labels sit on the price scale line. When two labels share the same price, they appear side-by-side rather than overlapping.
Timeframes & symbols
Designed for intraday futures on 1–30m. Works on other symbols/timeframes but intent is day trading.
Inputs (summary)
Sessions/TZ: RTH window, ON window, time zone
Today: RTH H/L/Mid, ON H/L, OR (minutes)
VWAP: on/off, ±σ bands, multiplier
Pivots: PP/R1/S1/R2/S2 (ETH)
ADR: lookback, anchor (open vs. prev close)
Settlement: show prev/proj, manual override
Weekly/Monthly: prior H/L/C + current open
Style: line transparency; right-edge tag size, base offset, and step; optional inline labels
Limitations & notes
“Prev Settle” equals the prior daily close unless overridden.
Session definitions matter: if your exchange hours differ, set your own RTH/ON windows.
No alerts are included to minimize plot count and keep performance high (you can add alert conditions on any level in a private copy).
Disclaimer
For educational purposes only; not financial advice. Futures trading involves significant risk.
Versioning
This script will be maintained under a single publication using Update (no minor forks). Major changes will be documented in the Change Log section of the script description.

Kz GC1! ORBStrategy that trades breakouts on GC1! futures on the 5min timeframe. It also works on MGC1! for lower drawdown and to manage Apex and Top Step accounts with the lower risk.
Risk Disclaimer:
Past results as well as strategy tester reports do not indicate future performance. Guarantees do not exist in trading. By using this strategy you risk losing all your money.
Important:
It trades all days that markets are open. Set times may be seen on settings. Trades multiple times a day sometimes.
It works on the 5 and 15min timeframe only. Results are better on 5min timeframe.
The settings are optimized already for GC1! on the 5min timeframe.
How it works:
Every trading day it measures the range of the first 15min candle of pre-selected hours. As soon as price closes above or below on the 15min timeframe, it will trade the breakout targeting a set risk to reward ratio. SL on the opposite side of the range.
Settings:
Hourly Trading Hours: These are the times that worked best for this strategy. All boxes should be checked for best results. Excluded times were when it performed bad which is why those times have been left out.
ORB Formation Period: This setting determines on which timeframe candle has to close outside the opening range box in order to take a trade. It's set to 15min by default because this is what worked by far the best
Entry Type: Entries are immediate instead of waiting for a pull back to enter on a limit order.
Limit Orders: If enabled, the strategy will place a pending order x points from the current price, instead of a market order. Immediate orders are enabled by default for a better performance. Important: It doesn't actually place a limit order. The strategy will just wait for a pullback and then enter with a market order. It's more like a hidden limit order.
Limit Order Offset Points: If you have limit orders enabled, this setting determines how many points from the current price the limit order will be placed.
FVG Detection Type: How fast it detects the fair value gaps. Standard detection over immediate had better performance
Risk Type: You can chose either between Fixed USD Amount, Risk per Trade in % or Fixed Contract Size. By default it's set to fixed contract size.
Risk Amount (USD or Contracts): This setting is to set how many USD or how many contracts you want to risk per trade. Make sure to check which risk type you have selected before you choose the risk amount.
Take Profit Multiplier: This is simply the total SL size in points multiplied by x.
Example: If you put 2, you get a 2:1 Risk to Reward Ratio. By Default it's set to 2.5 because this gave the best results in backtests.
Stop Loss Padding: This is simply the buffer in points that is added to the SL for safety reasons. If you have it on 0, the SL will be at the exact price of the opposite side of the range. By default it's set to 5 because this is what delivered the best results in backtests.
Stop Loss Placement: This determines where the stop loss gets placed for the order. It has been set to ORB Range by default as this delivered the best results.
Max Trades Per Hour: This allows the user to decide how many trades are taken an hour. 1 is been set to default for best results
Visual Settings: Check boxes to show orb range, FVG's, Entry points, and trade visualization boxes.
Backtest Settings:
For the backtest the commissions were set to 1.29USD per contract and .35USD for micros which is the highest amount Tradovate charges Margin was not accounted for because typically on prop accounts you can use way more contracts than you need for the extremely low max drawdown. Margin would be important on personal accounts but even there typically it's not an issue at all especially because this strategy runs on the 15min timeframe so it won't use a lot of contracts anyways.
Why the source code is hidden:
The source code is hidden because I invested a lot of time and money into developing this strategy and optimizing it with paid 3rd party software.

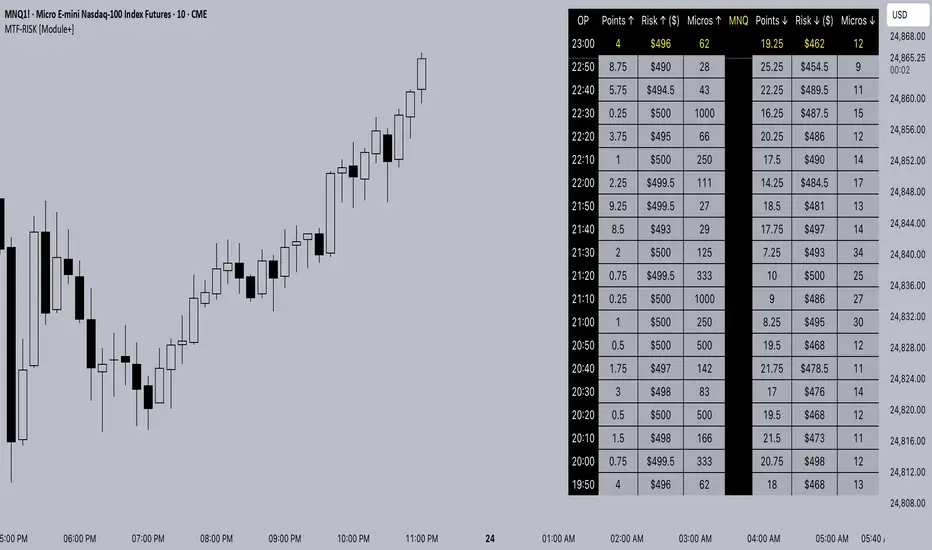
MTF-RISK [Module+]Description
MTF-RISK is a futures risk management tool that calculates standardized position sizing across multiple CME micro contracts, anchored to higher-timeframe structure. By combining multi-timeframe reference levels with a contract-based dollar-per-point model, it allows traders to maintain consistent risk across different futures markets.
Example:
User has selected the 1H timeframe for the risk table. Once an hourly candle closes, the high and low of that completed hour are locked as reference boundaries.
Lower timeframe candles (e.g., 1m, 5m, 15m) reference these established 1H boundaries to calculate:
Distance in points from the current close to the HTF high or low.
Corresponding dollar risk based on the user-defined Max Risk per Trade ($) setting.
The risk table updates in real-time, showing the current stop distance, calculated contract size, and resulting risk in dollars for both upward and downward directions.
Benefit: Traders always maintain a fixed dollar risk, regardless of intraday price movement, while using HTF structure as the anchor for accurate and consistent position sizing.
1. Higher Timeframe Anchor
Always uses the last fully closed candle from the selected higher timeframe (default: 60m).
Captures the prior HTF high and low as reference boundaries.
Lower timeframe closers (e.g., 1m, 5m, 15m bars) reference these established HTF boundaries to measure stop distances and calculate risk.
Use: Ensures all position sizing is tied to completed HTF structure, providing a consistent framework for intraday trades.
2. Risk Model Engine
Traders define maximum dollar risk per trade.
The system calculates allowable micro contracts based on stop distance (current close → HTF high/low).
Supported contracts and their point values:
MNQ (Micro Nasdaq 100): $2.00 per point
MES (Micro S&P 500): $5.00 per point
MYM (Micro Dow Jones): $0.50 per point
MGC (Micro Gold): $10.00 per point
Formula:
Contracts = Max Risk ÷ (Stop Distance × TSE:VALUE per Point)
Risk ↑: Based on distance to HTF high.
Risk ↓: Based on distance to HTF low.
Use: Provides consistent dollar risk sizing across different futures contracts and multiple intraday timeframes.
3. Risk Table Overlay
Compact, real-time on-chart table with customizable styling.
Columns:
OP: Operation time (adjusted by user’s timezone offset).
Points ↑ / ↓: Stop distances in points relative to HTF boundaries.
Risk ↑ / ↓ ($): Dollar exposure at those stops.
Micros ↑ / ↓: Allowable contract count.
Asset: Displays selected futures contract in the header.
Custom features:
Independent text/background colors per column.
Highlighted latest row for clarity.
Adjustable outline, row colors, and text size.
Use: Gives traders immediate insight into position sizing without leaving the chart.
Intended Use:
This is a risk visualization module, not a trade signal generator. Traders can use it to:
Standardize risk sizing across multiple CME micro futures.
Quickly evaluate trade setups relative to HTF structure.
Measure stop distances from lower timeframe closes while referencing HTF boundaries.
Maintain consistency in risk management regardless of the instrument traded.
Limitations & Disclaimers:
Calculations assume standard CME tick values for MNQ, MES, MYM, and MGC.
Other markets may not align with these dollar-per-point values.
This indicator does not predict direction, generate entries, or guarantee outcomes.
For educational and informational purposes only.
Trading involves risk; always use proper risk management.
Closed-source (Protected): Logic is visible on charts, but source code is hidden.
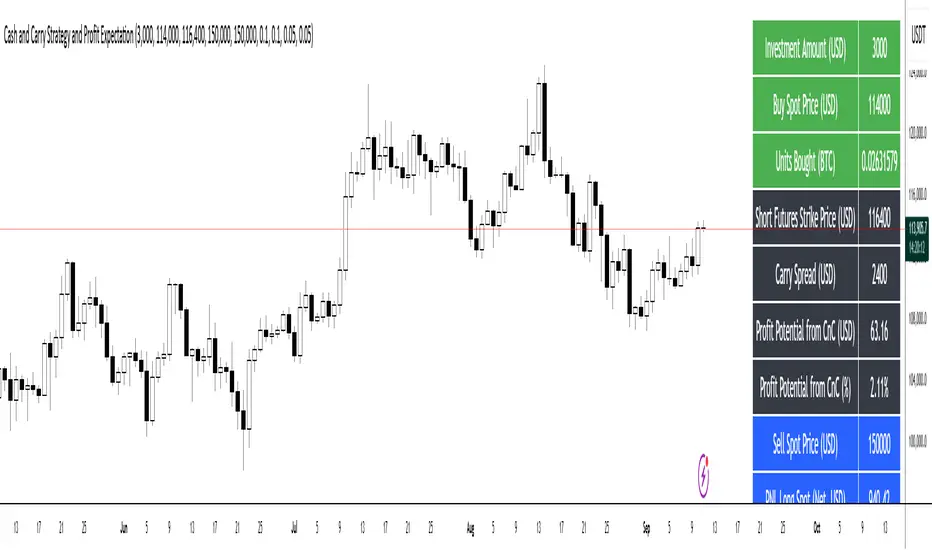
Cash and Carry Strategy and Profit ExpectationCash and Carry Strategy and Profit Expectation
In contemporary finance, price discrepancies between spot markets and futures markets represent a significant source of profit opportunities. One of the most established and widely utilized methods of arbitrage to exploit these discrepancies is the Cash and Carry Strategy. This approach is not speculative in nature, but rather market-neutral, grounded in the principle that the spot price and the futures price of an asset must converge upon the expiration of the futures contract.
The essence of the strategy lies in simultaneously purchasing the underlying asset in the spot market and selling an equivalent position in the futures market. By doing so, the investor holds the physical or underlying asset while securing a predetermined selling price through the futures contract. The difference between the futures price and the spot price at the inception of the trade—referred to as the carry spread—becomes the expected profit of the strategy.
Because the spot position and the futures position are of equal size but opposite direction, the investor is largely insulated from fluctuations in the underlying asset’s price. Any losses incurred in the spot position due to price declines are offset by corresponding gains in the futures position, and vice versa. The net result is a locked-in profit equal to the carry spread, provided that costs are properly accounted for. For this reason, the Cash and Carry is categorized as a market-neutral strategy, attractive to institutional investors and funds seeking stable, predictable returns while minimizing exposure to volatility.
In practice, however, the realized profit depends on more than the raw spread between futures and spot. Transaction costs, exchange commissions, and financing expenses must all be deducted from the gross profit. In many cases, these costs can erode, or even entirely eliminate, the arbitrage margin. Careful calculation and capital management are therefore essential for effective implementation.
Beyond its profit potential, the Cash and Carry strategy also plays a systemic role in maintaining market efficiency. When futures contracts are overpriced relative to their theoretical fair value, arbitrageurs enter into Cash and Carry positions, which exert downward pressure on the futures price and upward pressure on the spot price. This process restores equilibrium, ensuring consistency with the Law of One Price, which states that identical assets should not persistently trade at different prices. Thus, the strategy not only benefits individual investors but also contributes to the overall stability and fairness of financial markets.
In conclusion, the Cash and Carry strategy exemplifies how arbitrage can serve as both a tool for profit generation and a mechanism of systemic balance. It demonstrates that investors need not rely on forecasting the direction of markets to achieve returns; rather, they can profit from temporary inefficiencies in price structures. Ultimately, the strategy’s significance lies not only in its ability to secure predictable profit through the carry spread but also in its broader contribution to the efficiency and stability of global financial systems.
(ES, NQ) Trend Checker SB1(ES, NQ) Trend Checker SB1
Stay ahead of the market by tracking whether the E-mini S&P 500 (ES) and the Nasdaq 100 (NQ) are moving in sync.
📊 How it works:
The script checks whether each index is bullish (close > open) or bearish (close < open).
If both are aligned (all bullish or all bearish), conditions are stable.
If they diverge, the indicator instantly flags a mismatch in trend.
🎯 Features:
Background shading to highlight mismatched conditions.
Real-time alerts when ES and NQ fall out of sync.
Works on any timeframe.
🔥 Why it matters:
When ES and NQ move together, market momentum is usually stronger and cleaner.
But when they disagree, expect choppiness, fakeouts, or caution zones — the perfect heads-up before entering trades.
AM Range Sniper [jmaxxx]AM Range Sniper
Overview
AM Range Sniper is a sophisticated morning session trading strategy designed for Micro E-mini Nasdaq-100 Index Futures (MNQ). This strategy capitalizes on the critical 8:30-9:30 AM EST range formation period, implementing precise entry and exit mechanics with advanced risk management.
Key Features
🕐 Time-Based Range Analysis
Range Definition: Automatically identifies and tracks the 8:30-9:30 AM EST range
Trading Window: Active trading from 9:30 AM to 11:00 AM EST (extended for second chance trades)
Session Management: Daily reset ensures clean state for each trading session
🎯 Multiple Entry Patterns
Breakthrough/Retest: Captures price breakthroughs above range with retest opportunities
Long/Short Opportunities: Comprehensive coverage of both directional moves
Breakdown: Identifies bearish breakdowns below range support
Break Up: Detects bullish breakups above range resistance
Range Sweeps: Monitors for range high/low sweeps with reversal entries
⚡ Advanced Risk Management
Configurable Stop Losses: Tick-based stop losses for each trade type
Take Profit Targets: Automatic target calculations based on range size
Hard Close Protection: Automatic position closure at 4 PM EST
Second Chance Feature: Optional second trade opportunity if first trade loses
🔧 Professional Features
Visual Stop Loss Lines: Real-time stop loss visualization on chart
Debug Information Panel: Comprehensive status monitoring
Alert Integration: Customizable alert messages for entries/exits
Flexible Time Settings: Adjustable for different timezones
Strategy Logic
Range Formation (8:30-9:30 AM)
The strategy monitors the first hour of trading to establish the day's range. This range serves as the foundation for all subsequent trading decisions.
Entry Conditions
Breakthrough: Price breaks above range high with retest rejection
Breakdown: Price breaks below range low with confirmed bearish momentum
Break Up: Price breaks above range high with strong bullish confirmation
Sweep Entries: Range high/low sweeps followed by reversal signals
Risk Management
Stop Loss: Configurable tick-based stops for each trade type
Take Profit: 1.5x range size targets for breakdown/breakup trades
Position Sizing: Percentage-based position sizing
Session Limits: Maximum 2 trades per session (with second chance feature)
Settings & Customization
Core Parameters
Enable/disable individual entry patterns
Configurable stop loss levels (1-500 ticks)
Second chance feature toggle
Previous day level integration
Visual Customization
Customizable stop loss colors and widths
Debug panel visibility
Range line styling
Alert Configuration
Custom entry/exit alert messages
***** Automate With *****
APEX
NinjaTrader
Crosstrade.io ( promo code JMAXXX )
Performance & Reliability
Precision Focused: Waits for high-probability setups
Risk-Aware: Comprehensive stop loss and position management
Session-Based: Clean daily resets prevent carryover issues
Professional Grade: Designed for serious traders
Ideal For
Day Traders: Morning session specialists
Futures Traders: MNQ and similar instruments
Range Traders: Traders who capitalize on range breakouts
Risk-Conscious Traders: Those who prioritize risk management
Disclaimer
This strategy is for educational and informational purposes. Past performance does not guarantee future results. Always test thoroughly on historical data and paper trading before live implementation. Risk management is crucial - never risk more than you can afford to lose.
Created by jmaxxx - Professional trading strategy developer
For questions, feedback, or customization requests, please leave a comment below.

Opening-Range BreakoutNote: Default trading date range looks mediocre. Set date range to "Entire History" to see full effect of the strategy. 50.91% profitable trades, 1.178 profit factor, steady profits and limited drawdown. Total P&L: $154,141.18, Max Drawdown: $18,624.36. High R^2
█ Overview
The Opening-Range Breakout strategy is a mechanical, session‑based day‑trading system designed to capture the initial burst of directional momentum immediately following the market open. It defines a user‑configurable “opening range” window, measures its high and low boundaries, then places breakout stop orders at those levels once the range closes. Built‑in filters on minimum range width, reward‑to‑risk ratios, and optional reversal logic help refine entries and manage risk dynamically.
█ How It Works
Opening‑Range Formation
Between 9:30–10:15 AM ET (configurable), the script tracks the highest high and lowest low to form the day’s opening range box.
On the first bar after the range window closes, the range high (OR_high) and low (OR_low) are “locked in.”
Range‑Width Filter
To avoid false breakouts in low‑volatility mornings, the range must be at least X% of the current price (default 0.35%).
If the measured opening-range width < minimum threshold, no orders are placed that day.
Entry & Order Placement
Long: a stop‑buy order at the opening‑range high.
Short: a stop‑sell order at the opening‑range low.
Only one side can trigger (or both if reverse logic is enabled after a losing trade).
Risk Management
Once triggered, each trade uses an ATR‑style stop-loss defined as a percentage retracement of the range (default 50% of range width).
Profit target is set at a configurable Reward/Risk Ratio (default 1.1×).
Optional: Reverse on Stop‑Loss – if the initial breakout loses, immediately reverse into the opposite side on the same day.
Session Exit
Any open positions are closed at the end of the regular trading day (default 3:45 PM ET window end, with hard flat at session close).
Visual cues are provided via green (range high) and red (range low) step‑line plots directly on the chart, allowing you to see the range box and breakout triggers in real time.
█ Why It Works
Early Momentum Capture: The first 15 – 60 minutes of trading encapsulate overnight news digestion and institutional order flow, creating a well‑defined volatility “range.”
Mechanical Discipline: Clear, rule‑based entries and exits remove emotional guesswork, ensuring consistency.
Volatility Filtering: By requiring a minimum range width, the system avoids choppy, low‑range days where false breakouts are common.
Dynamic Sizing: Stops and targets scale with the opening range, adapting automatically to each day’s volatility environment.
█ How to Use
Set Your Instruments & Timeframe
-Apply to any futures contract on a 1‑ to 5‑minute chart.
-Ensure chart timezone is set to America/New_York.
Configure Inputs
-Opening‑Range Window: e.g. “0930-1015” for a 45‑minute range.
-Min. OR Width (%): e.g. 0.35 for 0.35% of current price.
-Reward/Risk Ratio: e.g. 1.1 for a modest profit target above your stop.
-Max OR Retracement %: e.g. 50 to set stop at 50% of range width.
-One Trade Per Day: toggle to limit to a single breakout.
-Reverse on Stop Loss: toggle to flip direction after a losing breakout.
Monitor the Chart
-Watch the green and red range boundaries form during the session open.
-Orders will automatically submit on the first bar after the range window closes, conditioned on your filters.
Review & Adjust
-Backtest across multiple months to validate performance on your preferred contract.
-Tweak range duration, minimum width, and R/R multiple to fit your risk tolerance and desired win‑rate vs. expectancy balance.
█ Settings Reference
Input Defaults
Opening‑Range Window - Time window to form OR (HHMM-HHMM) - 0930–1015
Regular Trading Day - Full session for EOD flat (HHMM-HHMM) - 0930–1545
Min. OR Width (%) - Minimum OR size as % of close to trigger orders - 0.35
Reward/Risk Ratio - Profit target multiple of stop‑loss distance - 1.1
Max OR Retracement (%) - % of OR width to use as stop‑loss distance - 50
One Trade Per Day - Limit to a single breakout order per day - false
Reverse on Stop Loss - Reverse direction immediately after a losing trade - true
Disclaimer
This strategy description and any accompanying code are provided for educational purposes only and do not constitute financial advice or a solicitation to trade. Futures trading involves substantial risk, including possible loss of capital. Past performance is not indicative of future results. Traders should assess their own risk tolerance and conduct thorough backtesting and forward-testing before committing real capital.

SPX Psych Levels for /ES Futures (Fair Value)Overview
This indicator displays S&P 500 psychological levels adjusted for ES futures fair value premium. These levels act as powerful magnets for price action due to the convergence of technical trading and options market dynamics.
What is Fair Value Premium?
Simply put, its the difference between the SPX price and the ES futures price. This changes dynamically based on interest rate, dividends, and time to expiration.
Why Psych Levels are Increasingly Important
Psychological levels are round numbers where traders naturally place orders. These obvious levels attract stop losses, profit targets, and breakout orders from both retail and institutional traders. Algorithms often target these same levels, creating a self-fulfilling prophecy of support and resistance. Importantly, this effect has been exacerbated by the options market.
Using May 2025 as an example, SPX options averaged 3.46 million contracts a day ≈US $1.8 trillion notional, dwarfing trading in SPY or ES/MES futures. 0-day-to-expiry (0DTE) trades hit a record-high 61% share of all SPX volume, making the options complex the primary arena for intraday price discovery.
Strikes at psychological numbers (ending in 00 and 50) captured 66% of total open interest and 58% of 0DTE volume for the entire month. This massive concentration at round number strikes creates powerful hedging flows:
Dealer Gamma Hedging: As price approaches these levels, market makers must dynamically hedge their options exposure, creating reflexive buying/selling pressure
Pin Risk: Options dealers face maximum uncertainty at these levels near expiration, leading to increased hedging activity
Charm Flows: Time decay accelerates near these levels, forcing position adjustments
How It Works
The indicator automatically:
Calculates the fair value premium between ES futures and SPX using real-time interest rate data, dividends, and time to expiration
Adjusts SPX round numbers by this premium to show where they appear on ES charts
Updates once daily at futures session open (5PM CT) to maintain stable reference points throughout the trading session
Key Features
All TradingView Native: All calculations performed automatically using data available within TradingView - no external data feeds or manual updates required
Multiple Level Increments: Display major (100-point), intermediate (50-point), and minor (25-point) psychological levels
Margin of Error Zones: Optional ±2.5 point zones accounting for fair value calculation variance
Full Customization: Colors, line styles, and widths for each level type
Fair Value Info Table: Displays current contract, fair value calculation, interest rate, and days to expiration
Automatic Contract Detection: Works on ES1!/MES1! continuous contracts and automatically detects the current front month contract
Important Notes
This indicator does not access any options data. It identifies levels where options activity naturally concentrates based on market structure. The power comes from understanding that these obvious levels create predictable dealer hedging flows, making them high-probability reaction zones.
Trading Applications
These levels can be used as dynamic areas of interest to be incorporated into a complete trading strategy.