Friday-Monday Pattern Backtest (Market Rebellion)Tests the "Friday-Monday Pattern" popularized by Tom Hougaard / Market Rebellion.
PATTERN LOGIC:
• When Friday's high is LOWER than Thursday's high (setup condition)
• Then Friday's low is often revisited on the following Monday
WHAT THIS INDICATOR SHOWS:
• Orange background highlights valid setup bars (Thu-Fri-Mon)
• Red horizontal line marks Friday's low (the target level)
• Green "SUCCESS" label = Monday hit Friday's low
• Red "FAIL" label = Monday did not reach Friday's low
• Stats table (top-right) shows total setups, successes, and success rate
USE THIS TO:
• Backtest the pattern on any daily chart (works best on indices, forex, futures)
• Verify the claimed "overwhelming" tendency statistically
• Identify which markets/timeframes show the highest success rate
CREDITS:
Pattern idea from Tom Hougaard / Market Rebellion: x.com
Indicator by BacktestBay for transparent pattern verification.
USAGE NOTES:
• Must be applied to DAILY charts
• Uses time_close("D") for accurate day-of-week detection on forex pairs
• No trading signals - purely for statistical backtesting
H-pattern

Direction via Zone Break [by rukich]🟠 OVERVIEW
The indicator shows the direction of movement and zones: SSL, BSL, FVG.
Zones serve as support/resistance and as validation/invalidation of a movement reversal.
🟠 COMPONENTS
The direction of movement is built based on a three-candle swing high (BSL) and swing low (SSL) pattern. If swing high (BSL) and swing low (SSL) are formed, and then an internal swing high/low is formed (depending on the direction of movement), then in case the initial movement continues — for example, in an upward movement — the new swing low (SSL) will be the minimum before the update, i.e., the internal low, while the swing high (BSL) will be formed according to the three-candle pattern.
A change of direction is considered when a candle closes beyond the key swing high/low (BSL/SSL), depending on the direction of movement. For example, in an upward movement, a break occurs when a candle closes beyond the swing low (SSL). After that, the swing high (BSL) will be the nearest fractal (swing high), and the swing low (SSL) will be formed according to the three-candle pattern.
All the above logic also applies to downward movements.
Within each movement, there can be FVG zones, which can act as support/resistance or indicate weakness in the movement direction.
Note: if the movement is upward, only bullish FVG+ will be displayed; if the movement is downward, only bearish FVG- will be displayed.
Weakness of movement direction.
For example, consider an upward impulse with the nearest FVG+ zone. If the price closes beyond the lower boundary of the zone, it will be considered invalidated (inv. FVG-), which in turn indicates weakness in the movement direction and a possible local short, which may subsequently lead to a break of the entire movement.
🟠 HOW TO USE
There are only two visual settings in the configuration:
Show previous SSL/BSL – enables/disables the display of all previous SSL/BSL zones
Show Bullish/Bearish trend – enables/disables background shading between SSL and BSL for visual understanding of the movement direction
On the chart, the following are displayed:
Labels with current SSL/BSL
FVG+- / inv. FVG+- zones, for trading in the movement direction
In case the nearest FVG is invalidated, a label will appear with the text: Weak bullish/bearish & local short/long (this is not a signal, but only indicates the probability of a potential move based on the weakness of the nearest zone)
🟠 CONCLUSION
The indicator helps determine the current movement with zones for trading in the direction, and also indicates movement weakness through invalidation of the nearest zones.

Viprasol Elite Advanced Pattern Scanner# 🚀 Viprasol Elite Advanced Pattern Scanner
## Overview
The **Viprasol Elite Advanced Pattern Scanner** is a sophisticated technical analysis tool designed to identify high-probability double bottom (DISCOUNT) and double top (PREMIUM) patterns with unprecedented accuracy. Unlike basic pattern detectors, this elite scanner employs an AI-powered quality scoring system to filter out false signals and highlight only the most reliable trading opportunities.
## 🎯 Key Features
### Advanced Pattern Detection
- **DISCOUNT Patterns** (Double Bottoms): Identifies bullish reversal zones where price may bounce
- **PREMIUM Patterns** (Double Tops): Detects bearish reversal zones where price may decline
- Multi-point validation system (5-point structure)
- Symmetry analysis with customizable tolerance
### 🤖 AI Quality Scoring System
Each pattern receives a quality score (0-100) based on:
- **Symmetry Analysis** (32% weight): How closely the two bottoms/tops match
- **Trend Context** (22% weight): Strength of the preceding trend using ADX
- **Volume Profile** (22% weight): Volume confirmation at key points
- **Pattern Depth** (16% weight): Significance of the pattern's price range
- **Structure Quality** (16% weight): Overall pattern formation quality
Quality Grades:
- ⭐ **ELITE** (88-100): Highest probability setups
- ✨ **VERY STRONG** (77-87): Strong trade opportunities
- ✓ **STRONG** (67-76): Valid patterns with good potential
- ○ **VALID** (65-66): Acceptable patterns meeting minimum criteria
### 🎯 Intelligent Target System
Three target modes per pattern direction:
- **Conservative**: 0.618 Fibonacci extension (safer, closer targets)
- **Balanced**: 1.0 extension (moderate risk/reward)
- **Aggressive**: 1.618 extension (higher risk/reward)
Targets automatically adjust based on pattern quality score.
### 🔧 Advanced Filtering Options
- **Volatility Filter (ATR)**: Excludes patterns during extreme volatility
- **Momentum Filter (ADX)**: Ensures sufficient trend strength
- **Liquidity Filter (Volume)**: Confirms adequate trading volume
### 📊 Pattern Lifecycle Management
- Real-time neckline tracking with extension multiplier
- Pattern invalidation after extended wait period
- Breakout/breakdown confirmation
- Reversal detection (pattern failure scenarios)
- Target achievement tracking
### 🌈 Premium Visual System
- Color-coded quality levels
- Cyber-themed color scheme (Neon Green/Hot Pink/Purple/Cyan)
- Transparent fills for pattern zones
- Dynamic labels with pattern information
- Elite dashboard showing live pattern stats
## 📈 How To Use
### Basic Setup
1. Add indicator to your chart
2. Enable desired patterns (DISCOUNT and/or PREMIUM)
3. Adjust quality threshold (default: 65) - higher = fewer but better signals
4. Set your preferred target mode
### Trading DISCOUNT Patterns (Bullish)
1. Wait for pattern detection (labeled points 1-4)
2. Check quality score on dashboard
3. Entry on breakout above neckline (point 5)
4. Stop loss below the lowest bottom
5. Target shown automatically based on your mode
6. ⚠️ Watch for pattern failure (break below bottoms = SHORT signal)
### Trading PREMIUM Patterns (Bearish)
1. Wait for pattern detection (labeled points 1-4)
2. Check quality score on dashboard
3. Entry on breakdown below neckline (point 5)
4. Stop loss above the highest top
5. Target shown automatically based on your mode
6. ⚠️ Watch for pattern failure (break above tops = LONG signal)
## ⚙️ Input Settings Guide
### 🔍 Detection Engine
- **Left/Right Pivots**: Higher = fewer but cleaner patterns (default: 6/4)
- **Min Pattern Width**: Minimum bars between bottoms/tops (default: 12)
- **Symmetry Tolerance**: Max % difference allowed between levels (default: 1.8%)
- **Extension Multiplier**: How long to wait for breakout (default: 2.2x pattern width)
### ⭐ Quality AI
- **Min Quality Score**: Only show patterns above this score (default: 65)
- **Weight Distribution**: Customize what matters most (symmetry/trend/volume/depth/structure)
### 🔧 Filters
- **Volatility Filter**: Avoid choppy markets (recommended: ON)
- **Momentum Filter**: Ensure trend strength (recommended: ON)
- **Liquidity Filter**: Volume confirmation (recommended: ON)
### 💎 Target System
- Choose target aggression for each pattern type and direction
- Higher quality patterns get adjusted targets automatically
## 🎨 Visual Customization
- Adjust colors for DISCOUNT/PREMIUM patterns
- Set quality-based color coding
- Customize label sizes
- Toggle dashboard visibility and position
- Show/hide historical patterns
## 🚨 Alert System
Set up TradingView alerts for:
- 🚀 **LONG Signals**: DISCOUNT breakout, PREMIUM failure
- 📉 **SHORT Signals**: PREMIUM breakdown, DISCOUNT failure
- ✅ **Target Achievement**: When price hits your target
## 💡 Pro Tips
1. **Higher Timeframes = Better Signals**: Patterns on 4H, Daily, Weekly are more reliable
2. **Quality Over Quantity**: Focus on ELITE and VERY STRONG grades
3. **Combine with Trend**: DISCOUNT in uptrend, PREMIUM in downtrend = best results
4. **Watch Pattern Failures**: Failed patterns often provide strong counter-trend signals
5. **Adjust for Your Style**: Intraday traders use Conservative, swing traders use Aggressive
## 🔒 Pattern Invalidation
Patterns become invalid if:
- No breakout/breakdown within extension period
- Support/resistance levels are broken prematurely
- Pattern shown in faded colors = no longer active
## ⚠️ Risk Disclaimer
This indicator is a tool for technical analysis and does not guarantee profitable trades. Always:
- Use proper risk management
- Combine with other analysis methods
- Never risk more than you can afford to lose
- Past performance does not indicate future results

Simple Line📌 Understanding the Basic Concept
The trend reverses only when the price moves up or down by a fixed filter size.
It ignores normal volatility and noise, recognizing a trend change only when price moves beyond a specified threshold.
Trend direction is visually intuitive through line colors (green: uptrend, red: downtrend).
⚙️ Explanation of Settings
Auto Brick Size: Automatically determines the brick/filter size.
Fixed Brick Size: Manually set the size (e.g., 15, 30, 50, 100, etc.).
Volatility Length: The lookback period used for calculations (default: 14).
📈 Example of Identifying Buy Timing
When the line changes from gray or red to green, it signals the start of an uptrend.
This indicates that the price has moved upward by more than the required threshold.
📉 Example of Identifying Sell Timing
When the line changes from green to red, it suggests a possible downtrend reversal.
At this point, consider closing long positions or evaluating short entries.
🧪 Recommended Use Cases
Use as a trend filter to enhance the accuracy of existing strategies.
Can be used alone as a clean directional indicator without complex oscillators.
Works synergistically with trend-following strategies, breakout strategies, and more.
🔒 Notes & Cautions
More suitable for medium- to long-term trend trading than for fast scalping.
If the brick size is too small, the indicator may react to noise.
Sensitivity varies greatly depending on the selected brick size, so backtesting is essential to determine optimal values.
❗ The Trend Simple Line focuses solely on direction—remove the noise and focus purely on the trend.
초대 전용 스크립트
이 스크립트에 대한 접근이 제한되어 있습니다. 사용자는 즐겨찾기에 추가할 수 있지만 사용하려면 사용자의 권한이 필요합니다. 연락처 정보를 포함하여 액세스 요청에 대한 명확한 지침을 제공해 주세요.
이 비공개 초대 전용 스크립트는 스크립트 모더레이터의 검토를 거치지 않았으며, 하우스 룰 준수 여부는 확인되지 않았습니다. 트레이딩뷰는 스크립트의 작동 방식을 충분히 이해하고 작성자를 완전히 신뢰하지 않는 이상, 해당 스크립트에 비용을 지불하거나 사용하는 것을 권장하지 않습니다. 커뮤니티 스크립트에서 무료 오픈소스 대안을 찾아보실 수도 있습니다.
작성자 지시 사항
.
c9indicator
면책사항
해당 정보와 게시물은 금융, 투자, 트레이딩 또는 기타 유형의 조언이나 권장 사항으로 간주되지 않으며, 트레이딩뷰에서 제공하거나 보증하는 것이 아닙니

Analog Flow [KedArc Quant]Overview
AnalogFlow is an advanced analogue based market projection engine that reconstructs future price tendencies by matching current price behavior to historical analogues in the same instrument. Instead of using traditional indicators such as moving averages, RSI, or regression, AnalogFlow applies pattern vector similarity analysis - a data driven technique that identifies historically similar sequences and aggregates their subsequent movements into a smooth, forward looking curve.
Think of it as a market memory system:
If the current pattern looks like one we have seen before, how did price move afterward?
Why AnalogFlow Is Unique
1. Pattern centric - it does not rely on any standard indicator formula; it directly analyzes price movement vectors.
2. Adaptive - it learns from the same instrument's past behavior, making it self calibrating to volatility and regime shifts.
3. Non repainting - the projection is generated on the latest completed bar and remains fixed until new data is available.
4. Noise resistant - the EMA Blend engine smooths the projected trajectory, reducing random variance between analogues.
Inputs and Configuration
Pattern Bars
Number of bars in the reference pattern window: 40
Projection Bars
Number of bars forward to project: 30
Search Depth
Number of bars back to look for matching analogues: 600
Distance Metric
Comparison method: Euclidean, Manhattan, or Cosine (default Euclidean)
Matches
Number of top analogues to blend (1-5): Top 3
Build Mode
Projection type: Cumulative, MeanStep, or EMA Blend (default EMA Blend)
EMA Blend Length
Smoothness of the projected path: 15
Normalize Pattern
Enable Z score normalization for shape matching: true
Dissimilarity Mode
If true, finds inverse analogues for mean reversion analysis: false
Line Color and Width
Style settings for projection curve: Blue, width 2
How It Works with Past Data
1. The system builds a memory bank of patterns from the last N bars based on the scanDepth value.
2. It compares the latest Pattern Bars segment to each historical segment.
3. It selects the Top K most similar or dissimilar analogues.
4. For each analogue, it retrieves what happened after that pattern historically.
5. It averages or smooths those forward moves into a single composite forecast curve.
6. The forecast (blue line) is drawn ahead of the current candle using line.new with no repainting.
Output Explained
Blue Path
The weighted mean future trajectory based on historical analogues.
Smoother when EMA Blend mode is enabled.
Flat Section
Indicates low directional consensus or equilibrium across analogues.
Upward or Downward Slope
Represents historical tendency toward continuation or reversal following similar conditions.
Recommended Timeframes
Scalping / Short Term
1m - 5m : Short winLen (20-30), small ahead (10-15)
Swing Trading
15m - 1h : Balanced settings (winLen 40-60, ahead 20-30)
Positional / Multi Day
4h - 1D : Large windows (winLen 80-120, ahead 30-50)
Instrument Compatibility
Works seamlessly on:
Stocks and ETFs
Indices
Cryptocurrency
Commodities (Gold, Crude, etc.)
Futures and F&O (both intraday and positional)
Forex
No symbol specific calibration needed. It self adapts to volatility.
How Traders Can Use It
Forecast Context
Identify likely short term price path or drift direction.
Reversal Detection
Flip seekOpp to true for mean reversion pattern analysis.
Scenario Comparison
Observe whether the current regime tends to continue or stall.
Momentum Confirmation
Combine with trend tools such as EMA or MACD for directional bias.
Backtesting Support
Compare projected path versus realized price to evaluate reliability.
FAQ
Q1. Does AnalogFlow repaint?
No. It calculates only once per completed bar and projects forward. The future path remains static until a new bar closes.
Q2. Is it a neural network or AI model?
Not in the machine learning sense. It is a deterministic analogue matching engine using statistical distance metrics.
Q3. Why does the projection sometimes flatten?
That means similar historical setups had no clear consensus in direction (neutral expectation).
Q4. Can I use it for live trading signals?
AnalogFlow is not a signal generator. It provides probabilistic context for upcoming movement.
Q5. Does higher scanDepth improve accuracy?
Up to a point. More depth gives more analogues, but too much can dilute recency. Try 400 to 800.
Glossary
Analogue
A past pattern similar to the current price behavior.
Distance Metric
Mathematical formula for pattern similarity.
Step Vector
Difference between consecutive closing prices.
EMA Blend
Exponential smoothing of the projected path.
Cumulative Mode
Adds sequential historical deltas directly.
Z Score Normalization
Rescaling to mean 0 and variance 1 for shape comparison.
Summary
AnalogFlow converts the market's historical echoes into a structured, statistically weighted forward projection. It gives traders a contextual roadmap, not a signal, showing how similar past setups evolved and allowing better informed entries, exits, and scenario planning across all asset classes.
Disclaimer
This script is provided for educational purposes only.
Past performance does not guarantee future results.
Trading involves risk, and users should exercise caution and proper risk management when applying this strategy.

Auto Chart PatternsAuto Chart Patterns automatically scans the chart for major technical patterns and marks them directly on price action. It detects:
• Head & Shoulders (bearish reversal)
• Inverse Head & Shoulders (bullish reversal)
• Rising and Falling Wedges
• Double / Triple Tops and Bottoms
• Cup & Handle (bullish continuation)
For each pattern, the script draws the structure (trendlines / neckline), shades the pattern zone, and places a label with the pattern name.
It also generates optional trade signals:
• “BUY” when a bullish pattern breaks out with confirmation
• “SELL” when a bearish pattern breaks down with confirmation
Confirmations can include:
• Follow-through candle in the breakout direction
• Volume spike vs recent average
• RSI momentum agreement
Inputs let you control:
• Pivot sensitivity (left/right bars)
• Pattern types to display
• Cup & Handle depth rules
• Confirmation rules for entry/exit signals
This tool is designed to help you visually spot reversal and continuation setups, highlight potential breakout levels (necklines / wedge boundaries), and time trades with clearer confirmation instead of guessing.
Disclaimer: This script is for educational/technical analysis purposes only. It does not guarantee future performance, does not execute trades, and is not financial advice. Always confirm signals with your own analysis and risk management before entering any position.

Wolfe Waves [BigBeluga]🔵 OVERVIEW
The Wolfe Waves pattern was first introduced by Bill Wolfe , a trader and analyst in the 1980s–1990s who specialized in market geometry and natural rhythm cycles. Wolfe observed that price often forms symmetrical wave structures that anticipate equilibrium points where supply and demand meet. These formations, called Wolfe Waves , gained popularity as a reliable pattern for forecasting both short- and long-term reversals.
The Wolfe Waves indicator automatically detects these patterns in real time. It tracks sequences of five pivots (points 1 through 5) and connects them with wave lines. Users can select either Bullish or Bearish Wolfe Waves depending on their trading bias. When the pattern fails, the lines automatically turn red to highlight invalidation.
🔵 CONCEPTS
Five-Point Structure – Wolfe Waves are defined by five pivots (1–5), which together form the basis of the wave pattern.
Bullish Pattern – Occurs when price compresses downward into point 5, signaling a potential upside reversal.
Bearish Pattern – Occurs when price extends upward into point 5, forecasting a downside reversal.
Validation & Failure – The pattern is considered valid once all five pivots form; if price fails to respect the expected breakout, the indicator marks the structure as broken with red lines.
🔵 FEATURES
Automatic detection of Bullish and Bearish Wolfe Waves.
Labels each pivot (1–5) on the chart for clarity.
Draws connecting lines between pivots to visualize the wave structure.
Projects target/dashed lines (EPA/ETA) based on Wolfe Wave geometry.
Lines automatically turn red when the pattern is broken, giving immediate feedback.
Customizable color scheme for bullish (lime) and bearish (orange) waves.
Adjustable sensitivity for pivot detection.
🔵 HOW TO USE
Choose between Bullish or Bearish mode depending on your analysis.
Watch for the formation of all five pivots; the indicator labels them clearly.
Look for potential entries near point 5, with the expectation that price will travel toward the projected EPA line.
Use invalidation (lines turning red) as a risk management warning to exit failed setups.
Combine with momentum, volume, or higher-timeframe analysis to increase reliability.
🔵 CONCLUSION
The Wolfe Waves brings the classic Wolfe Wave theory into an automated TradingView tool. Inspired by Bill Wolfe’s original concept of natural market cycles, this indicator detects, labels, and validates Wolfe Waves in real time. With automatic invalidation marking and customizable settings, it offers traders a structured way to harness one of the most well-known geometric reversal patterns.

Internal Pivot Pattern [LuxAlgo]The Internal Pivot Pattern indicator is a novel method allowing traders to detect pivots without excessive delay on the chart timeframe, by using the lower timeframe data from a candle.
It features custom colors for candles and zigzag lines to help identify trends. A dashboard showing the accuracy of the pattern is also included.
🔶 USAGE
We define a pivot as the occurrence where the middle candle over a specific interval (for example, the most recent 21 bars) is the highest (pivot high) or the lowest (pivot low). This method commonly allows for identifying swing highs/lows on a trader's chart; however, this pattern can only be identified after a specific number of bars has been formed, rendering this pattern useless for real-time detection of swing highs/lows.
This indicator uses a different approach, removing the need to wait for candles to form on the user chart; instead, we check the lower timeframe data of the current candle and evaluate for the presence of a pivot given the internal data, effectively providing pivot confirmation at the candle close.
An internal pivot low pattern is indicative of a potential uptrend, while an internal pivot high is indicative of a potential downtrend.
Candles are colored based on the last internal pivot detected, with blue candle colors indicating that the most recent internal pivot is a pivot low, indicating an uptrend, while an orange candle color indicates that the most recent internal pivot is a pivot high, indicating a downtrend.
🔹 Timeframes
The timeframe setting allows controlling the amount of lower timeframe data to consider for the internal pivot detection. This setting must be lower than the user's chart timeframe.
Using a timeframe significantly lower than the user chart timeframe will evaluate a larger amount of data for the pivot detection, making it less frequent, while using a timeframe closer to the chart timeframe can make the internal pivot detection more frequent, and more prone to false positives.
🔹 Accuracy Dashboard
The Accuracy Dashboard allows evaluating how accurate the detected patterns are as a percentage, with a pattern being judged accurate if subsequent patterns are detected higher or lower than a previous one.
For example, an internal pivot low is judged accurate if the following internal pivot is higher than it, indicating that higher highs have been made.
This dashboard can be useful to determine the timeframe setting to maximize the respective internal pivot accuracy.
🔶 SETTINGS
Timeframe: Timeframe for detecting internal swings
Accuracy Dashboard: Enable or disable the Accuracy Dashboard.
🔹 Style
Internal Pivot High: Color of the dot displayed upon the detection of an internal pivot high
Internal Pivot Low: Color of the dot displayed upon the detection of an internal pivot low
Zig-Zag: Color of the zig-zag segments connecting each internal pivot
Candles: Enable candle coloring, with control over the color of the candles highlighting the detected trend

Momentum Reversal StrategyBEST USE IN 15MIN TIME FRAME EURUSD / XAUSUD
1. Strategy Overview
This strategy hunts short-term momentum reversals at key levels during high-liquidity sessions.
Timeframes: 5-minute for entries; 15-minute for trend context
Sessions: London for EUR/USD & GBP/USD; New York for XAU/USD
Pairs: EUR/USD, GBP/USD, XAU/USD
Indicators (3 max):
EMA(20) and EMA(50) (close)
MACD (12, 26, 9) histogram
Optional: RSI(14) (for divergence filter)
2. Entry Rules
Trend Filter (15 min):
Long only if EMA20 > EMA50; short only if EMA20 < EMA50.
Price-Action Zone (5 min):
Identify recent swing high/low within past 20 bars.
Draw horizontal support (for longs) or resistance (for shorts).
Indicator Alignment (5 min):
MACD histogram crossing from negative to positive for longs, positive to negative for shorts.
Candle close beyond EMA20 in direction of trade.
Candle Confirmation:
Bullish engulfing or hammer at support for longs; bearish engulfing or shooting star at resistance for shorts.
Entry Execution:
Place market order on candle close that meets all above.
3. Exit Rules
Stop-Loss (SL):
Long: 1.5× ATR(14) below entry candle low.
Short: 1.5× ATR(14) above entry candle high.
Take-Profit (TP):
Set at 2× SL distance (RR 1:2).
Trailing SL:
After price moves 1× SL in profit, trail SL to breakeven.
Partial Booking:
Close 50% at 1× SL (50% of TP), move SL to entry.
Close remaining at full TP.
4. Trade Management
False Signal Filter: Skip trades when RSI(14) > 70 for longs or < 30 for shorts (avoids overbought/oversold extremes).
One Trade at a Time: No multiple positions on same pair.
Session Cutoff: Close any open trade 15 minutes before session end.
5. Risk Parameters
Risk per Trade: 1% of account equity.
Reward Target: ≥2% (1:2 RR) per trade.
Win-Rate Expectancy: ≥75% based on indicator confluence and price-action confirmation.

PRO Investing - LevelPRO Investing - Level
📊 Dynamic Support/Resistance
This indicator plots the PRO Investing Level, defined as the midpoint between the highest high and lowest low over the past 252 trading days (default lookback period, equivalent to ~1 year). It acts as a key mean-reversion reference level, useful for identifying potential support/resistance zones or market equilibrium levels.
Features:
🕰️ Option to display only today’s level or historical levels.
⚙️ Customizable lookback period for flexibility across timeframes and strategies.
📉 Teal line plotted directly on the chart, highlighting this institutional-grade level.
Ideal for traders looking to anchor price action to significant historical ranges—particularly useful in mean-reversion, breakout, or volatility compression strategies.

FVG Trailing Stop [LuxAlgo]The FVG Trailing Stop indicator tracks unmitigated Fair Value Gaps (FVG) data to produce a Trailing Stop indicator able to determine if the market is uptrending or downtrending easily.
🔶 USAGE
The FVG Trailing Stop is intended to identify trend directions through its position relative to the closing price:
Bullish: Price is located above the Trailing Stop, indicating that all Bearish FVGs have been mitigated and the trend is anticipated to continue upwards.
Bearish State: Price is located below the Trailing Stop, indicating that all Bullish FVGs have been mitigated and the trend is anticipated to continue downwards.
The Trailing Stop originates from two extremities obtained from the average of respective unmitigated FVGs. The specific directional average is also displayed as a more transparent secondary line, however, the trailing stop is derived from this value and a new trend will not be detected until the opposite directional average is crossed.
Price reaching the Trailing Stop is caused by retracements and can lead to the following scenarios:
Outcome 1: The directional average is crossed next, indicating a new trend direction.
Outcome 2: The directional average is held as support or resistance, leading to a new impulse and a continuation of the trend.
🔹 Reset on Cross
While price crossing the Trailing Stop should be considered as a sign of an upcoming trend change; it is possible for the price to still evolve outside it.
As a solution, we have included the "Reset on Cross" feature, which (as the name suggests) hides and resets the Trailing Stop each time it is crossed, leading to a "Neutral" state.
This opens the opportunity for the Trailing Stop to be displayed again once the price moves again in the direction of the pre-established trend. A trader might use this to accumulate positions within a specific trend.
🔶 DETAILS
The script uses a typical identification method for FVGs. Once identified, the script collects the point of the FVG farthest from the current price when formed.
For Upwards FVGs this is the bottom of the FVG.
For Downwards FVGs this is the top of the FVG.
The data is managed only to use the last input lookback of FVGs. If an FVG is mitigated, it frees up a spot in the memory for a new FVG, however, if the lookback is full, the oldest will be deleted.
From there, it uses a "trailing" logic only to move the Trailing Stop in one direction until the trailing stop resets or the direction flips.
The extremities used to calculate the Trailing Stop are created from 2 calculation steps, the first step involves taking the raw average of the FVG mitigation levels, and the second step applies a simple moving average (SMA) smoothing of the precedent-obtained averages.
🔶 SETTINGS
Unmitigated FVG Lookback: Sets the maximum number of Unmitigated FVGs that the script will use.
Smoothing Length: Sets the smoothing length for the Trailing Stop to reduce erratic results.
Reset on Cross: When enabled, hide and reset the Trailing Stop until the price starts moving in the pre-established trend direction again.

Market Sessions & Viewer Panel [By MUQWISHI]▋ INTRODUCTION :
The “Market Sessions & Viewer Panel” is a clean and intuitive visual indicator tool that highlights up to four trading sessions directly on the chart. Each session is fully customizable with its name, session time, and color. It also generates a panel that provides a quick-glance summary of each session’s candle/bar shape, helping traders gain insight into the volatility across all trading sessions.
_______________________
▋ OVERVIEW:
_______________________
▋ CREDIT:
This indicator utilizes the “ Timezone — Library ”. A huge thanks to @n00btraders for effort and well-organized work.
_______________________
▋ SESSION PANEL:
The Session Panel allows traders to visually compare session volatility using a candlestick/bar pattern.
Each bar represents the price action during a session and includes the session status, session name, closing price, change(%) from open, and a tooltip that reveals detailed OHLC and volume when hovered over.
Chart Type:
It offers two styles Bar or Candle to display based on traders’ preference
Sorting:
Allowing to arrange session candles/bars based on…
—Left to Right: The most recently opened on the left, moving backward in time to the right.
—Right to Left: The most recently opened on the right, moving backward in time to the left.
—Default: Arrange sessions in the user-defined input order.
_______________________
▋ CHART VISUALIZATION:
The chart visualization highlights each trading session using color-coded backgrounds in two selectable drawing styles that span their respective active timeframes. Each session block provides session’s name, close price, and change from open.
Chart Type: Candle
Chart Type: Box
Extra Drawing Feature:
This feature may not exist in other indicators within the same category, it extends the session block drawing to the projected end of the session. This's done through estimation based on historical data; however, it doesn’t function fully on seconds-based timeframes due to drawing limitations.
_______________________
▋ INDICATOR SETTINGS:
Section(1): Sessions
(1) Universal Timezone.
(2) Each Session: Enable/Disable, Name, Color, and Time.
Section(2): Session Panel
(1) Show/Hide Session Panel.
(2) Chart Type: Candle/Bar.
(3) Bar’s Up/Down color.
(4) Width and Height of the bar.
(5) Location of Session Panel on chat.
(6) Sort: Left to Right (most recent session is placed on the left), Right to Left (most recent session is placed on the right), and Default (as input arrangement).
Section(3): Chart Visualization
(1) Show/Hide Chart Block Visualization.
(2) Draw Shape: Box/Candle.
(3) Border Style and Size.
(4) Label Styling includes location, size, and some essential selectable infos.
Please let me know if you have any questions

Rally Base Drop SND Pivots [LuxAlgo]The Rally Base Drop SND Pivots indicator uses "Rally", "Base", and "Drop" Candles to determine pivot points at which supply and demand (SND) levels are drawn.
🔶 USAGE
Rally, Base, and Drop (RBD) candles create a formula for seeing market structure through a fixed methodology. We are able to use this concept to point out pivot areas where Rallies and Drops directly meet.
The RBD SND Pivots are similar to traditionally identified "fractal" pivot points, with one key difference.
RBD SND Pivots detect a specific number of Rally and Drop candles directly back-to-back, requiring one side of the pivot to contain entirely green candles and the other to be entirely red candles or vice versa.
Since these pivot levels are based on Rally, Base, and Drop candles, the method directly implements rigid logic to further structure a trading system when utilizing these pivot levels with traditional SND concepts.
Furthermore, by implementing this logic when looking for pivots, a significant portion of potential noise is naturally filtered out.
🔶 DETAILS
In typical SND systems, the term "Base" is used for multiple meanings.
In this indicator, the base is a product of a pivot being formed. Once a Pivot is identified, the "Base" is marked as the first Rally or Drop of the second half of the pivot formation.
Once the pivot is identified, the high or low of the base candle is used to measure the pivot level.
🔶 SETTINGS
Length: Sets the number of Rally and Drop Candles that the script will require to identify pivots.
Ex. "3" = 3 Rally followed by 3 Drop
Historical Lookback: Hides historic levels based on a bar # Lookback from the current bar.
When set to 0, all Levels will display. (0 by default)

Bollinger Bounce Reversal Strategy – Visual EditionOverview:
The Bollinger Bounce Reversal Strategy – Visual Edition is designed to capture potential reversal moves at price extremes—often termed “bounce points”—by using a combination of technical indicators. The strategy integrates Bollinger Bands, MACD, and volume analysis, and it provides rich on‑chart visual cues to help traders understand its signals and conditions. Additionally, the strategy enforces a maximum of 5 trades per day and uses fixed risk management parameters. This publication is intended for educational purposes and offers a systematic, transparent approach that you can further adjust to fit your market or risk profile.
How It Works:
Bollinger Bands:
A 20‑period simple moving average (SMA) and a user‑defined standard deviation multiplier (default 2.0) are used to calculate the Bollinger Bands.
When the price reaches or crosses these bands (i.e. falls below the lower band or rises above the upper band), it suggests that the price is in an extreme, potentially oversold or overbought, state.
MACD Filter:
The MACD (calculated with standard lengths, e.g. 12, 26, 9) provides momentum information.
For a bullish (long) signal, the MACD line should be above its signal line; for a bearish (short) signal, the MACD line should be below.
Volume Confirmation:
The strategy uses a 20‑period volume moving average to determine if current volume is strong enough to validate a signal.
A signal is confirmed only if the current volume is at or above a specified multiple (by default, 1.0×) of this moving average, ensuring that the move is supported by increased market participation.
Visual Cues:
Bollinger Bands and Fill: The basis (SMA), upper, and lower Bollinger Bands are plotted, and the area between the upper and lower bands is filled with a semi‑transparent color.
Signal Markers: When a long or short signal is generated, corresponding markers (labels) appear on the chart.
Background Coloring: The chart’s background changes color (green for long signals and red for short signals) on the bars where signals occur.
Information Table: An on‑chart table displays key indicator values (MACD, signal line, volume, average volume) and the number of trades executed that day.
Entry Conditions:
Long Entry:
A long trade is triggered when the previous bar’s close is below the lower Bollinger Band and the current bar’s close crosses above it, combined with a bullish MACD condition and strong volume.
Short Entry:
A short trade is triggered when the previous bar’s close is above the upper Bollinger Band and the current bar’s close crosses below it, with a bearish MACD condition and high volume.
Risk Management:
Daily Trade Limit: The strategy restricts trading to no more than 5 trades per day.
Stop-Loss and Take-Profit:
For each position, a stop loss is set at a fixed percentage away from the entry price (typically 2%), and a take profit is set to target a 1:2 risk-reward ratio (typically 4% from the entry price).
Backtesting Setup:
Initial Capital: $10,000
Commission: 0.1% per trade
Slippage: 1 tick per bar
These realistic parameters help ensure that backtesting results reflect the conditions of an average trader.
Disclaimer:
Past performance is not indicative of future results. This strategy is experimental and provided solely for educational purposes. It is essential to backtest extensively and paper trade before any live deployment. All risk management practices are advisory, and you should adjust parameters to suit your own trading style and risk tolerance.
Conclusion:
By combining Bollinger Bands, MACD, and volume analysis, the Bollinger Bounce Reversal Strategy – Visual Edition provides a clear, systematic method to identify potential reversal opportunities at price extremes. The added visual cues help traders quickly interpret signals and assess market conditions, while strict risk management and a daily trade cap help keep trading disciplined. Adjust and refine the settings as needed to better suit your specific market and risk profile.

Volatility Momentum Breakout StrategyDescription:
Overview:
The Volatility Momentum Breakout Strategy is designed to capture significant price moves by combining a volatility breakout approach with trend and momentum filters. This strategy dynamically calculates breakout levels based on market volatility and uses these levels along with trend and momentum conditions to identify trade opportunities.
How It Works:
1. Volatility Breakout:
• Methodology:
The strategy computes the highest high and lowest low over a defined lookback period (excluding the current bar to avoid look-ahead bias). A multiple of the Average True Range (ATR) is then added to (or subtracted from) these levels to form dynamic breakout thresholds.
• Purpose:
This method helps capture significant price movements (breakouts) while ensuring that only past data is used, thereby maintaining realistic signal generation.
2. Trend Filtering:
• Methodology:
A short-term Exponential Moving Average (EMA) is applied to determine the prevailing trend.
• Purpose:
Long trades are considered only when the current price is above the EMA, indicating an uptrend, while short trades are taken only when the price is below the EMA, indicating a downtrend.
3. Momentum Confirmation:
• Methodology:
The Relative Strength Index (RSI) is used to gauge market momentum.
• Purpose:
For long entries, the RSI must be above a mid-level (e.g., above 50) to confirm upward momentum, and for short entries, it must be below a similar threshold. This helps filter out signals during overextended conditions.
Entry Conditions:
• Long Entry:
A long position is triggered when the current closing price exceeds the calculated long breakout level, the price is above the short-term EMA, and the RSI confirms momentum (e.g., above 50).
• Short Entry:
A short position is triggered when the closing price falls below the calculated short breakout level, the price is below the EMA, and the RSI confirms momentum (e.g., below 50).
Risk Management:
• Position Sizing:
Trades are sized to risk a fixed percentage of account equity (set here to 5% per trade in the code, with each trade’s stop loss defined so that risk is limited to approximately 2% of the entry price).
• Stop Loss & Take Profit:
A stop loss is placed a fixed ATR multiple away from the entry price, and a take profit target is set to achieve a 1:2 risk-reward ratio.
• Realistic Backtesting:
The strategy is backtested using an initial capital of $10,000, with a commission of 0.1% per trade and slippage of 1 tick per bar—parameters chosen to reflect conditions faced by the average trader.
Important Disclaimers:
• No Look-Ahead Bias:
All breakout levels are calculated using only past data (excluding the current bar) to ensure that the strategy does not “peek” into future data.
• Educational Purpose:
This strategy is experimental and provided solely for educational purposes. Past performance is not indicative of future results.
• User Responsibility:
Traders should thoroughly backtest and paper trade the strategy under various market conditions and adjust parameters to fit their own risk tolerance and trading style before live deployment.
Conclusion:
By integrating volatility-based breakout signals with trend and momentum filters, the Volatility Momentum Breakout Strategy offers a unique method to capture significant price moves in a disciplined manner. This publication provides a transparent explanation of the strategy’s components and realistic backtesting parameters, making it a useful tool for educational purposes and further customization by the TradingView community.

Center of Candle Trendline### **Center of Candle Trendline**
This script dynamically plots a trendline through the center of each candlestick's body. The "center" is calculated as the average of the open and close prices for each candle. The trendline updates in real-time as new candles form, providing a clean and straightforward way to track the market's midline movement.
#### **Features:**
1. **Dynamic Trendline:** The trendline connects the center points of consecutive candlestick bodies, giving a clear visual representation of price movements.
2. **Accurate Center Calculation:** The center is determined as `(open + close) / 2`, ensuring the trendline reflects the true midpoint of each candlestick body.
3. **Real-Time Updates:** The trendline updates automatically as new bars form, keeping your chart up to date with the latest price action.
4. **Customization-Ready:** Adjust the line’s color, width, or style easily to fit your chart preferences.
#### **How to Use:**
- Add this script to your chart to monitor the price movement relative to the center of candlestick bodies.
- Use the trendline to identify trends, reversals, or price consolidation zones.
#### **Applications:**
- **Trend Analysis:** Visualize how the market trends around the center of candlesticks.
- **Reversal Identification:** Detect potential reversal zones when the price deviates significantly from the trendline.
- **Support and Resistance Zones:** Use the trendline as a dynamic support or resistance reference.
This tool is perfect for traders who want a clean and minimalistic approach to tracking price action. Whether you're a beginner or an experienced trader, this script provides valuable insights without overwhelming your chart.
#### **Note:**
This is not a standalone trading strategy but a visual aid to complement your analysis. Always combine it with other tools and techniques for better trading decisions.
---
Feel free to tweak this description based on your preferences or style!
Nen Star Harmonic Pattern [TradingFinder] NenStar Reversal Auto🔵 Introduction
The Nen-Star Harmonic Pattern is an advanced reversal pattern in technical analysis, designed to identify market trend changes and predict key price reversal points. This pattern is defined by a combination of Fibonacci ratios and critical concepts such as Potential Reversal Zones (PRZ), market structure, and corrective waves.
The key points of this pattern include X, A, B, C, and D, and it appears in both bullish and bearish forms. In its bullish form, the pattern resembles the letter M, while in its bearish form, it takes the shape of W. The critical Fibonacci ratios for this pattern are 0.382 to 0.786 for the XA wave, 1.13 to 1.414 for the AB wave, and 1.272 to 2.618 for the BC wave.
The Nen-Star Harmonic Pattern is one of the most precise tools for identifying market reversals and executing reversal trades. Traders can use it to pinpoint optimal entry and exit points and benefit from high risk-to-reward ratios.
By emphasizing Fibonacci retracement levels, XABCD waves, the formation of bullish and bearish patterns, and precise trade entry points, this pattern has become a practical tool in advanced technical analysis.
Bullish Nen-Star Pattern :
Bearish Nen-Star Pattern :
🔵 How to Use
The Nen-Star Harmonic Pattern indicator allows traders to automatically identify the bullish and bearish structures of this pattern and locate optimal entry and exit points. By accurately analyzing Fibonacci ratios and determining points X, A, B, C, and D, the indicator highlights Potential Reversal Zones (PRZ) on the chart. Traders can rely on the generated signals to manage their trades with greater precision.
🟣 Bullish Nen-Star Pattern
The bullish Nen-Star pattern begins with a price increase from point X to point A, followed by a retracement to point B, which lies between 0.382 and 0.786 of the XA wave.
After this retracement, the price moves to point C, located between 1.13 and 1.414 of the AB wave. The final movement is a price decline to point D, which is between 1.272 and 2.618 of the BC wave and 1.13 to 1.272 of the XA wave.
Point D : Serves as the key Potential Reversal Zone (PRZ).
Entry : A buy trade is initiated at point D, signaling the end of the corrective movement and the beginning of a price increase.
Price Targets :
61.8% retracement of the CD wave
Point A
Point C
1.272 and 1.618 extensions of the CD wave if resistance at point C is broken
Stop Loss : Placed slightly below point D.
🟣 Bearish Nen-Star Pattern
The bearish Nen-Star pattern starts with a price decrease from point X to point A, followed by a retracement to point B, which lies between 0.382 and 0.786 of the XA wave.
After this retracement, the price moves to point C, located between 1.13 and 1.414 of the AB wave. The final movement is a price increase to point D, which is between 1.272 and 2.618 of the BC wave and 1.13 to 1.272 of the XA wave.
Point D : Serves as the key Potential Reversal Zone (PRZ).
Entry : A sell trade is initiated at point D, signaling the end of the corrective movement and the beginning of a price decline.
Price Targets :
61.8% retracement of the CD wave
Point A
Point C
1.272 and 1.618 extensions of the CD wave if support at point C is broken
Stop Loss : Placed slightly above point D.
🔵 Setting
🟣 Logical Setting
ZigZag Pivot Period : You can adjust the period so that the harmonic patterns are adjusted according to the pivot period you want. This factor is the most important parameter in pattern recognition.
Show Valid Forma t: If this parameter is on "On" mode, only patterns will be displayed that they have exact format and no noise can be seen in them. If "Off" is, the patterns displayed that maybe are noisy and do not exactly correspond to the original pattern.
Show Formation Last Pivot Confirm : if Turned on, you can see this ability of patterns when their last pivot is formed. If this feature is off, it will see the patterns as soon as they are formed. The advantage of this option being clear is less formation of fielded patterns, and it is accompanied by the latest pattern seeing and a sharp reduction in reward to risk.
Period of Formation Last Pivot : Using this parameter you can determine that the last pivot is based on Pivot period.
🟣 Genaral Setting
Show : Enter "On" to display the template and "Off" to not display the template.
Color : Enter the desired color to draw the pattern in this parameter.
LineWidth : You can enter the number 1 or numbers higher than one to adjust the thickness of the drawing lines. This number must be an integer and increases with increasing thickness.
LabelSize : You can adjust the size of the labels by using the "size.auto", "size.tiny", "size.smal", "size.normal", "size.large" or "size.huge" entries.
🟣 Alert Setting
Alert : On / Off
Message Frequency : This string parameter defines the announcement frequency. Choices include: "All" (activates the alert every time the function is called), "Once Per Bar" (activates the alert only on the first call within the bar), and "Once Per Bar Close" (the alert is activated only by a call at the last script execution of the real-time bar upon closing). The default setting is "Once per Bar".
Show Alert Time by Time Zone : The date, hour, and minute you receive in alert messages can be based on any time zone you choose. For example, if you want New York time, you should enter "UTC-4". This input is set to the time zone "UTC" by default.
🔵 Conclusion
The Nen-Star Harmonic Pattern is a highly effective analytical tool in global financial markets, playing a crucial role in identifying reversal points and market trend changes. By leveraging Fibonacci principles and price structure, this pattern enables precise analysis across various assets, including stocks, cryptocurrencies, forex, and commodities.
Traders operating in global markets can use this pattern to identify high risk-to-reward trading opportunities. Its clear entry and exit points, defined Potential Reversal Zones (PRZ), and accurate price targets make it an excellent tool for risk management and profitability enhancement.
In the global context, the Nen-Star pattern is widely used by professional analysts in both advanced and emerging markets due to its versatility in analyzing long-term and short-term charts. Beyond trend prediction, it enhances trading strategies and optimizes investment decisions.
Combining this pattern with complementary tools such as volume analysis, technical indicators, and macroeconomic conditions can provide traders with deeper market insights, helping them capitalize on global opportunities.

Alternate Bat Harmonic Pattern [TradingFinder] ALT Bat Indicator🔵 Introduction
The Alternate Bat harmonic pattern is one of the most precise and practical tools in technical analysis, introduced by Scott Carney in 2003. This pattern focuses on specific Fibonacci ratios, such as 0.382 at point B and 1.13XA at point D, to identify Potential Reversal Zones (PRZ) where price is likely to reverse.
The Alternative Bat pattern emerged as a result of repeated failures observed in the standard Bat pattern. Traders entering trades near the 0.886XA level of the standard Bat often encountered losses. In the Alternate Bat, point D extends beyond 0.886XA, typically reversing at 1.13XA, offering a more accurate identification of the reversal zone.
A key characteristic of this pattern is its M- or W-shaped structure, where the midpoint B retraces 0.382XA or less. Additionally, the CD leg requires an extension of 2.0 to 3.618 to complete the pattern. Due to its accuracy and the predictable behavior of price near the PRZ, the Alternate Bat pattern is recognized as a powerful tool for forecasting price reversals.
In the bullish Alternative Bat pattern, an M-shaped structure forms. After an initial upward movement (XA), price undergoes a short correction at point B (0.382XA) and then declines toward point D (1.13XA and an extension of 2.0 to 3.618BC), where a potential upward reversal is expected.
In the bearish Alternate Bat pattern, a W-shaped structure forms. After an initial downward movement (XA), price retraces slightly at point B (0.382XA) and then rises toward point D (1.13XA and an extension of 2.0 to 3.618BC), where a potential downward reversal is anticipated.
🔵 How to Use
The Alternate Bat harmonic pattern is a key tool for identifying potential reversal zones (PRZ) in the market. By leveraging the 0.382 retracement at point B and the 1.13XA extension at point D, along with symmetrical price structures, this pattern offers precise reversal opportunities in both bullish and bearish market conditions.
🟣 Bullish Alternate Bat Pattern
The bullish Alternate Bat pattern forms during a downtrend, signaling a potential reversal to the upside. This pattern consists of three downward movements with two corrective waves, ultimately reaching point D, which marks the PRZ.
At the PRZ, the convergence of Fibonacci levels—1.13XA and extensions ranging from 2.0 to 3.618BC—creates a strong support zone where price is likely to reverse upward.
🟣 Bearish Alternative Bat Pattern
The bearish Alternate Bat pattern develops during an uptrend, indicating a potential reversal to the downside. This pattern features three upward price movements with two retracements, ending at point D, where the PRZ forms.
Point D is defined by the 1.13XA extension and the 2.0 to 3.618BC projection, creating a strong resistance zone where price is expected to reverse downward.
🔵 Setting
🟣 Logical Setting
ZigZag Pivot Period : You can adjust the period so that the harmonic patterns are adjusted according to the pivot period you want. This factor is the most important parameter in pattern recognition.
Show Valid Format : If this parameter is on "On" mode, only patterns will be displayed that they have exact format and no noise can be seen in them. If "Off" is, the patterns displayed that maybe are noisy and do not exactly correspond to the original pattern.
Show Formation Last Pivot Confirm : if Turned on, you can see this ability of patterns when their last pivot is formed. If this feature is off, it will see the patterns as soon as they are formed. The advantage of this option being clear is less formation of fielded patterns, and it is accompanied by the latest pattern seeing and a sharp reduction in reward to risk.
Period of Formation Last Pivot : Using this parameter you can determine that the last pivot is based on Pivot period.
🟣 Genaral Setting
Show : Enter "On" to display the template and "Off" to not display the template.
Color : Enter the desired color to draw the pattern in this parameter.
LineWidth : You can enter the number 1 or numbers higher than one to adjust the thickness of the drawing lines. This number must be an integer and increases with increasing thickness.
LabelSize : You can adjust the size of the labels by using the "size.auto", "size.tiny", "size.smal", "size.normal", "size.large" or "size.huge" entries.
🟣 Alert Setting
Alert : On / Off
Message Frequency : This string parameter defines the announcement frequency. Choices include: "All" (activates the alert every time the function is called), "Once Per Bar" (activates the alert only on the first call within the bar), and "Once Per Bar Close" (the alert is activated only by a call at the last script execution of the real-time bar upon closing). The default setting is "Once per Bar".
Show Alert Time by Time Zone : The date, hour, and minute you receive in alert messages can be based on any time zone you choose. For example, if you want New York time, you should enter "UTC-4". This input is set to the time zone "UTC" by default.
🔵 Conclusion
The Alternate Bat harmonic pattern, with its precise Fibonacci ratios like 0.382 and 1.13XA, is a reliable tool for identifying Potential Reversal Zones (PRZ) in financial markets. By recognizing symmetrical price structures and focusing on both bullish and bearish scenarios, traders can identify optimal entry and exit points with high accuracy.
The key strength of this pattern lies in its ability to define strong support and resistance zones near the PRZ, increasing the probability of price reversals. Combining the pattern with candlestick confirmations and volume analysis enhances its effectiveness.
Ultimately, incorporating the Alternative Bat pattern with proper risk management and Fibonacci-based targets allows traders to enter the market confidently and capitalize on potential price reversals.

AiTrend Pattern Matrix for kNN Forecasting (AiBitcoinTrend)The AiTrend Pattern Matrix for kNN Forecasting (AiBitcoinTrend) is a cutting-edge indicator that combines advanced mathematical modeling, AI-driven analytics, and segment-based pattern recognition to forecast price movements with precision. This tool is designed to provide traders with deep insights into market dynamics by leveraging multivariate pattern detection and sophisticated predictive algorithms.
👽 Core Features
Segment-Based Pattern Recognition
At its heart, the indicator divides price data into discrete segments, capturing key elements like candle bodies, high-low ranges, and wicks. These segments are normalized using ATR-based volatility adjustments to ensure robustness across varying market conditions.
AI-Powered k-Nearest Neighbors (kNN) Prediction
The predictive engine uses the kNN algorithm to identify the closest historical patterns in a multivariate dictionary. By calculating the distance between current and historical segments, the algorithm determines the most likely outcomes, weighting predictions based on either proximity (distance) or averages.
Dynamic Dictionary of Historical Patterns
The indicator maintains a rolling dictionary of historical patterns, storing multivariate data for:
Candle body ranges, High-low ranges, Wick highs and lows.
This dynamic approach ensures the model adapts continuously to evolving market conditions.
Volatility-Normalized Forecasting
Using ATR bands, the indicator normalizes patterns, reducing noise and enhancing the reliability of predictions in high-volatility environments.
AI-Driven Trend Detection
The indicator not only predicts price levels but also identifies market regimes by comparing current conditions to historically significant highs, lows, and midpoints. This allows for clear visualizations of trend shifts and momentum changes.
👽 Deep Dive into the Core Mathematics
👾 Segment-Based Multivariate Pattern Analysis
The indicator analyzes price data by dividing each bar into distinct segments, isolating key components such as:
Body Ranges: Differences between the open and close prices.
High-Low Ranges: Capturing the full volatility of a bar.
Wick Extremes: Quantifying deviations beyond the body, both above and below.
Each segment contributes uniquely to the predictive model, ensuring a rich, multidimensional understanding of price action. These segments are stored in a rolling dictionary of patterns, enabling the indicator to reference historical behavior dynamically.
👾 Volatility Normalization Using ATR
To ensure robustness across varying market conditions, the indicator normalizes patterns using Average True Range (ATR). This process scales each component to account for the prevailing market volatility, allowing the algorithm to compare patterns on a level playing field regardless of differing price scales or fluctuations.
👾 k-Nearest Neighbors (kNN) Algorithm
The AI core employs the kNN algorithm, a machine-learning technique that evaluates the similarity between the current pattern and a library of historical patterns.
Euclidean Distance Calculation:
The indicator computes the multivariate distance across four distinct dimensions: body range, high-low range, wick low, and wick high. This ensures a comprehensive and precise comparison between patterns.
Weighting Schemes: The contribution of each pattern to the forecast is either weighted by its proximity (distance) or averaged, based on user settings.
👾 Prediction Horizon and Refinement
The indicator forecasts future price movements (Y_hat) by predicting logarithmic changes in the price and projecting them forward using exponential scaling. This forecast is smoothed using a user-defined EMA filter to reduce noise and enhance actionable clarity.
👽 AI-Driven Pattern Recognition
Dynamic Dictionary of Patterns: The indicator maintains a rolling dictionary of N multivariate patterns, continuously updated to reflect the latest market data. This ensures it adapts seamlessly to changing market conditions.
Nearest Neighbor Matching: At each bar, the algorithm identifies the most similar historical pattern. The prediction is based on the aggregated outcomes of the closest neighbors, providing confidence levels and directional bias.
Multivariate Synthesis: By combining multiple dimensions of price action into a unified prediction, the indicator achieves a level of depth and accuracy unattainable by single-variable models.
Visual Outputs
Forecast Line (Y_hat_line):
A smoothed projection of the expected price trend, based on the weighted contribution of similar historical patterns.
Trend Regime Bands:
Dynamic high, low, and midlines highlight the current market regime, providing actionable insights into momentum and range.
Historical Pattern Matching:
The nearest historical pattern is displayed, allowing traders to visualize similarities
👽 Applications
Trend Identification:
Detect and follow emerging trends early using dynamic trend regime analysis.
Reversal Signals:
Anticipate market reversals with high-confidence predictions based on historically similar scenarios.
Range and Momentum Trading:
Leverage multivariate analysis to understand price ranges and momentum, making it suitable for both breakout and mean-reversion strategies.
Disclaimer: This information is for entertainment purposes only and does not constitute financial advice. Please consult with a qualified financial advisor before making any investment decisions.

Harmonic Pattern Detector (75 patterns)Harmonic Pattern Detector offers a record amount of "Harmonic Patterns" in one script, with 75 different patterns detected, together with up to 99 different swing lengths.
🔶 USAGE
Harmonic Patterns are detected from several different ZigZag lines, derived from Swings with different lengths (shorter - longer term)
Depending on the settings ' Minimum/Maximum Swing Length ', the user will see more or less patterns from shorter and/or longer-term swing points.
🔹 Fibonacci Ratio
Certain patterns have only one ratio for a specific retrace/extension instead of one upper and one lower limit. In this case, we add a ' Tolerance ', which adds a percentage tolerance below/above the ratio, creating two limits.
A higher number may show more patterns but may become less valid.
Hoovering over points B, C, and D will show a tooltip with the concerning limits; adjusted limits will be seen if applicable.
Tooltips in settings will also show which patterns the Fibonacci Ratio applies to.
🔹 Triangle Area Ratio
Using Heron's formula , the triangle area is calculated after the X-Y axis is normalized.
Users can filter patterns based on the ratio of the smallest triangle to the largest triangle.
A lower Triangle Area Ratio number leads to more symmetrical patterns but may appear less frequently.
🔶 DETAILS
Harmonic patterns are based on geometric patterns, where the retracement/extension of a swing point must be located between specific Fibonacci ratios of the previous swing/leg. Different Harmonic Patterns require unique ratios to become valid patterns.
In the above example there is a valid 'Max Butterfly' pattern where:
Point B is located between 0.618 - 0.886 retracement level of the X-A leg
Point C is located between 0.382 - 0.886 retracement level of the A-B leg
Point D is located between 1.272 - 2.618 extension level of the B-C leg
Point D is located between 1.272 - 1.618 extension level of the X-A leg
Harmonic Pattern Detector uses ZigZag lines, where swing highs and swing lows alternate. Each ZigZag line is checked for valid Harmonic Patterns . When multiple types of Harmonic Patterns are valid for the same sequence, the pattern will be named after the first one found.
Different swing lengths form different ZigZag lines.
By evaluating different ZigZag lines (up to 99!), shorter—and longer-term patterns can be drawn on the same chart.
🔹 Blocks
The patterns are organized into blocks that can be toggled on or off with a single click.
When a block is enabled, the user can still select which specific patterns within that block are enabled or disabled.
🔹 Visuals
Besides color settings, labels can show pattern names or arrows at point D of the pattern.
Note this will happen 1 bar after validation because one extra bar is needed for confirmation.
An option is included to show only arrows without the patterns.
🔹 Updated Patterns
When a Swing Low is followed by a lower low or a Swing High followed by a higher high , triggering a pattern identical to a previous one except with a different point D, the pattern will be updated. The previous C-D line will be visible as a dashed line to highlight the event. Only the last dashed line is shown when this happens more than once.
🔹 Optimization
The script only verifies the last leg in the initial phase, significantly reducing the time spent on pattern validation. If this leg doesn't align with a potential Harmonic Pattern , the pattern is immediately disregarded. In the subsequent phase, the remaining patterns are quickly scrutinized to ensure the next leg is valid. This efficient process continues, with only valid patterns progressing to the next phase until all sequences have been thoroughly examined.
This process can check up to 99 ZigZag lines for 75 different Harmonic Patterns , showcasing its high capacity and versatility.
🔹 Ratios
The following table shows the different ratios used for each Harmonic Pattern .
' min ' and ' max ' are used when only one limit is provided instead of 2. This limit is given a percentage tolerance above and below, customizable by the setting ' Tolerance - Fibonacci Ratio '.
For example a ratio of 0.618 with a tolerance of 1% would result in:
an upper limit of 0.624
a lower limit of 0.612
|-------------------|------------------------|------------------------|-----------------------|-----------------------|
| NAME PATTERN | BCD (BD) | ABC (AC) | XAB (XB) | XAD (XD) |
| | min max | min max | min max | min max |
|-------------------|------------------------|------------------------|-----------------------|-----------------------|
| 'ABCD' | 1.272 - 1.618 | 0.618 - 0.786 | | |
| '5-0' | 0.5 *min - 0.5 *max | 1.618 - 2.24 | 1.13 - 1.618 | |
| 'Max Gartley' | 1.128 - 2.236 | 0.382 - 0.886 | 0.382 - 0.618 | 0.618 - 0.786 |
| 'Gartley' | 1.272 - 1.618 | 0.382 - 0.886 | 0.618*min - 0.618*max | 0.786*min - 0.786*max |
| 'A Gartley' | 1.618*min - 1.618*max | 1.128 - 2.618 | 0.618 - 0.786 | 1.272*min - 1.272*max |
| 'NN Gartley' | 1.128 - 1.618 | 0.382 - 0.886 | 0.618*min - 0.618*max | 0.786*min - 0.786*max |
| 'NN A Gartley' | 1.618*min - 1.618*max | 1.128 - 2.618 | 0.618 - 0.786 | 1.272*min - 1.272*max |
| 'Bat' | 1.618 - 2.618 | 0.382 - 0.886 | 0.382 - 0.5 | 0.886*min - 0.886*max |
| 'Alt Bat' | 2.0 - 3.618 | 0.382 - 0.886 | 0.382*min - 0.382*max | 1.128*min - 1.128*max |
| 'A Bat' | 2.0 - 2.618 | 1.128 - 2.618 | 0.382 - 0.618 | 1.128*min - 1.128*max |
| 'Max Bat' | 1.272 - 2.618 | 0.382 - 0.886 | 0.382 - 0.618 | 0.886*min - 0.886*max |
| 'NN Bat' | 1.618 - 2.618 | 0.382 - 0.886 | 0.382 - 0.5 | 0.886*min - 0.886*max |
| 'NN Alt Bat' | 2.0 - 4.236 | 0.382 - 0.886 | 0.382*min - 0.382*max | 1.128*min - 1.128*max |
| 'NN A Bat' | 2.0 - 2.618 | 1.128 - 2.618 | 0.382 - 0.618 | 1.128*min - 1.128*max |
| 'NN A Alt Bat' | 2.618*min - 2.618*max | 1.128 - 2.618 | 0.236 - 0.5 | 0.886*min - 0.886*max |
| 'Butterfly' | 1.618 - 2.618 | 0.382 - 0.886 | 0.786*min - 0.786*max | 1.272 - 1.618 |
| 'Max Butterfly' | 1.272 - 2.618 | 0.382 - 0.886 | 0.618 - 0.886 | 1.272 - 1.618 |
| 'Butterfly 113' | 1.128 - 1.618 | 0.618 - 1.0 | 0.786 - 1.0 | 1.128*min - 1.128*max |
| 'A Butterfly' | 1.272*min - 1.272*max | 1.128 - 2.618 | 0.382 - 0.618 | 0.618 - 0.786 |
| 'Crab' | 2.24 - 3.618 | 0.382 - 0.886 | 0.382 - 0.618 | 1.618*min - 1.618*max |
| 'Deep Crab' | 2.618 - 3.618 | 0.382 - 0.886 | 0.886*min - 0.886*max | 1.618*min - 1.618*max |
| 'A Crab' | 1.618 - 2.618 | 1.128 - 2.618 | 0.276 - 0.446 | 0.618*min - 0.618*max |
| 'NN Crab' | 2.236 - 4.236 | 0.382 - 0.886 | 0.382 - 0.618 | 1.618*min - 1.618*max |
| 'NN Deep Crab' | 2.618 - 4.236 | 0.382 - 0.886 | 0.886*min - 0.886*max | 1.618*min - 1.618*max |
| 'NN A Crab' | 1.128 - 2.618 | 1.128 - 2.618 | 0.236 - 0.447 | 0.618*min - 0.618*max |
| 'NN A Deep Crab' | 1.128*min - 1.128*max | 1.128 - 2.618 | 0.236 - 0.382 | 0.618*min - 0.618*max |
| 'Cypher' | 1.272 - 2.00 | 1.13 - 1.414 | 0.382 - 0.618 | 0.786*min - 0.786*max |
| 'New Cypher' | 1.272 - 2.00 | 1.414 - 2.14 | 0.382 - 0.618 | 0.786*min - 0.786*max |
| 'Anti New Cypher' | 1.618 - 2.618 | 0.467 - 0.707 | 0.5 - 0.786 | 1.272*min - 1.272*max |
| 'Shark 1' | 1.618 - 2.236 | 1.128 - 1.618 | 0.382 - 0.618 | 0.886*min - 0.886*max |
| 'Shark 1 Alt' | 1.618 - 2.618 | 0.618 - 0.886 | 0.446 - 0.618 | 1.128*min - 1.128*max |
| 'Shark 2' | 1.618 - 2.236 | 1.128 - 1.618 | 0.382 - 0.618 | 1.128*min - 1.128*max |
| 'Shark 2 Alt' | 1.618 - 2.618 | 0.618 - 0.886 | 0.446 - 0.618 | 0.886*min - 0.886*max |
| 'Leonardo' | 1.128 - 2.618 | 0.382 - 0.886 | 0.5*min - 0.5*max | 0.786*min - 0.786*max |
| 'NN A Leonardo' | 2.0*min - 2.0*max | 1.128 - 2.618 | 0.382 - 0.886 | 1.272*min - 1.272*max |
| 'Nen Star' | 1.272 - 2.0 | 1.414 - 2.14 | 0.382 - 0.618 | 1.272*min - 1.272*max |
| 'Anti Nen Star' | 1.618 - 2.618 | 0.467 - 0.707 | 0.5 - 0.786 | 0.786*min - 0.786*max |
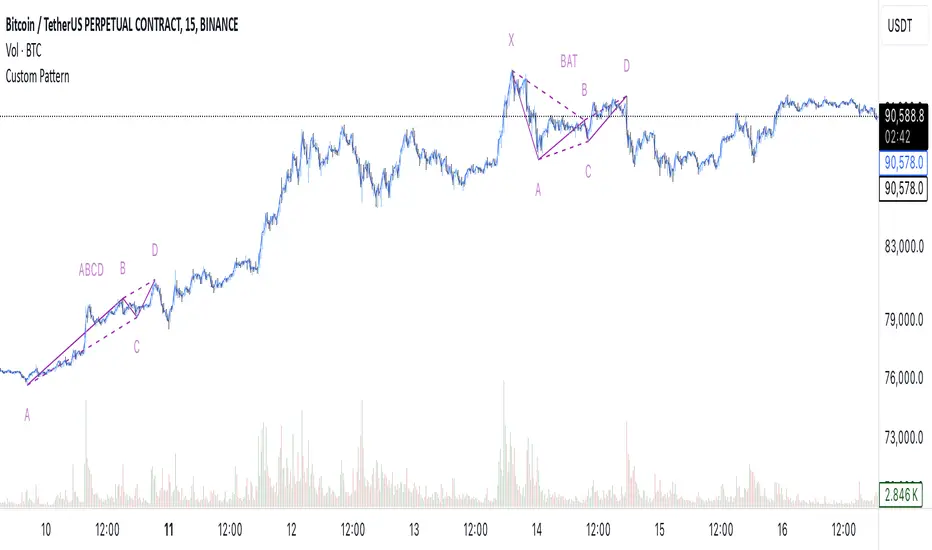
| '3 Drives' | 1.272 - 1.618 | 0.618 - 0.786 | 1.272 - 1.618 | 1.618 - 2.618 |
| 'A 3 Drives' | 0.618 - 0.786 | 1.272 - 1.618 | 0.618 - 0.786 | 0.13 - 0.886 |
| '121' | 0.382 - 0.786 | 1.128 - 3.618 | 0.5 - 0.786 | 0.382 - 0.786 |
| 'A 121' | 1.272 - 2.0 | 0.5 - 0.786 | 1.272 - 2.0 | 1.272 - 2.618 |
| '121 BG' | 0.618 - 0.707 | 1.128 - 1.733 | 0.5 - 0.577 | 0.447 - 0.786 |
| 'Black Swan' | 1.128 - 2.0 | 0.236 - 0.5 | 1.382 - 2.618 | 1.128 - 2.618 |
| 'White Swan' | 0.5 - 0.886 | 2.0 - 4.237 | 0.382 - 0.786 | 0.238 - 0.886 |
| 'NN White Swan' | 0.5 - 0.886 | 2.0 - 4.236 | 0.382 - 0.724 | 0.382 - 0.886 |
| 'Sea Pony' | 1.618 - 2.618 | 0.382 - 0.5 | 0.128 - 3.618 | 0.618 - 3.618 |
| 'Navarro 200' | 0.886 - 3.618 | 0.886 - 1.128 | 0.382 - 0.786 | 0.886 - 1.128 |
| 'May-00' | 0.5 - 0.618 | 1.618 - 2.236 | 1.128 - 1.618 | 0.5 - 0.618 |
| 'SNORM' | 0.9 - 1.1 | 0.9 - 1.1 | 0.9 - 1.1 | 0.618 - 1.618 |
| 'COL Poruchik' | 1.0 *min - 1.0 *max | 0.382 - 2.618 | 0.128 - 3.618 | 0.618 - 3.618 |
| 'Henry – David' | 0.618 - 0.886 | 0.44 - 0.618 | 0.128 - 2.0 | 0.618 - 1.618 |
| 'DAVID VM 1' | 1.618 - 1.618 | 0.382*min - 0.382*max | 0.128 - 1.618 | 0.618 - 3.618 |
| 'DAVID VM 2' | 1.618 - 1.618 | 0.382*min - 0.382*max | 1.618 - 3.618 | 0.618 - 7.618 |
| 'Partizan' | 1.618*min - 1.618*max | 0.382*min - 0.382*max | 0.128 - 3.618 | 0.618 - 3.618 |
| 'Partizan 2' | 1.618 - 2.236 | 1.128 - 1.618 | 0.128 - 3.618 | 1.618 - 3.618 |
| 'Partizan 2.1' | 1.618*min - 1.618*max | 1.128*min - 1.128*max | 0.128 - 3.618 | 0.618 - 3.618 |
| 'Partizan 2.2' | 2.236*min - 2.236*max | 1.128*min - 1.128*max | 0.128 - 3.618 | 0.618 - 3.618 |
| 'Partizan 2.3' | 1.618*min - 1.618*max | 0.618 - 1.618 | 0.128 - 3.618 | 0.618 - 3.618 |
| 'Partizan 2.4' | 2.236*min - 2.236*max | 1.618*min - 1.618*max | 0.128 - 3.618 | 0.618 - 3.618 |
| 'TOTAL' | 1.272 - 3.618 | 0.382 - 2.618 | 0.276 - 0.786 | 0.618 - 1.618 |
| 'TOTAL NN' | 1.272 - 4.236 | 0.382 - 2.618 | 0.236 - 0.786 | 0.618 - 1.618 |
| 'TOTAL 1' | 1.272 - 2.618 | 0.382 - 0.886 | 0.382 - 0.786 | 0.786 - 0.886 |
| 'TOTAL 2' | 1.618 - 3.618 | 0.382 - 0.886 | 0.382 - 0.786 | 1.128 - 1.618 |
| 'TOTNN 2NN' | 1.618 - 4.236 | 0.382 - 0.886 | 0.382 - 0.786 | 1.128 - 1.618 |
| 'TOTAL 3' | 1.272 - 2.618 | 1.128 - 2.618 | 0.276 - 0.618 | 0.618 - 0.886 |
| 'TOTNN 3NN' | 1.272 - 2.618 | 1.128 - 2.618 | 0.236 - 0.618 | 0.618 - 0.886 |
| 'TOTAL 4' | 1.618 - 2.618 | 1.128 - 2.618 | 0.382 - 0.786 | 1.128 - 1.272 |
| 'BG 1' | 2.618*min - 2.618*max | 0.382*min - 0.382*max | 0.128 - 0.886 | 1.0 *min - 1.0 *max |
| 'BG 2' | 2.237*min - 2.237*max | 0.447*min - 0.447*max | 0.128 - 0.886 | 1.0 *min - 1.0 *max |
| 'BG 3' | 2.0 *min - 2.0 *max | 0.5 *min - 0.5 *max | 0.128 - 0.886 | 1.0 *min - 1.0 *max |
| 'BG 4' | 1.618*min - 1.618*max | 0.618*min - 0.618*max | 0.128 - 0.886 | 1.0 *min - 1.0 *max |
| 'BG 5' | 1.414*min - 1.414*max | 0.707*min - 0.707*max | 0.128 - 0.886 | 1.0 *min - 1.0 *max |
| 'BG 6' | 1.272*min - 1.272*max | 0.786*min - 0.786*max | 0.128 - 0.886 | 1.0 *min - 1.0 *max |
| 'BG 7' | 1.171*min - 1.171*max | 0.854*min - 0.854*max | 0.128 - 0.886 | 1.0 *min - 1.0 *max |
| 'BG 8' | 1.128*min - 1.128*max | 0.886*min - 0.886*max | 0.128 - 0.886 | 1.0 *min - 1.0 *max |
|-------------------|------------------------|------------------------|-----------------------|-----------------------|
🔶 SETTINGS
🔹 Swings
Minimum Swing Length: Minimum length used for the swing detection.
Maximum Swing Length: Maximum length used for the swing detection.
🔹 Patterns
Toggle Pattern Block
Toggle separate pattern in each Pattern Block
🔹 Tolerance
Fibonacci Ratio: Adds a percentage tolerance below/above the ratio when only one ratio applies, creating two limits.
Triangle Area Ratio: Filters patterns based on the ratio of the smallest triangle to the largest triangle.
🔹 Display
Labels: Display Pattern Names, Arrows or nothing
Patterns: Display or not
Last Line: Display previous C-D line when updated
🔹 Style
Colors: Pattern Lines/Names/Arrows - background color of patterns
Text Size: Text Size of Pattern Names/Arrows
🔹 Calculation
Calculated Bars: Allows the usage of fewer bars for performance/speed improvement
3 Drive Harmonic Pattern [TradingFinder] Three Drive Reversal🔵 Introduction
The Three Drive harmonic pattern closely resembles other price structures such as Wedge Pattern and Three Push Pattern, yet it stands out due to its precise use of Fibonacci ratios and symmetrical price movements.
This pattern comprises three consecutive and symmetrical price drives, each validated by key Fibonacci ratios (1.27 and 1.618), which help identify critical Potential Reversal Zones (PRZ).
Unlike the Wedge, which relies on converging trend lines and can indicate either continuation or reversal, and the Three Push, which lacks defined Fibonacci ratios and symmetry, the Three Drive pattern defines PRZ with greater accuracy, providing traders with high-probability trading opportunities.
This pattern appears in both bullish and bearish trends. After the completion of the third drive (Drive 3), it signals the market's readiness to reverse direction. The PRZ in this pattern serves as a crucial zone where price is highly likely to reverse, offering a strategic point for entering or exiting trades. Professional traders utilize the Three Drive pattern and PRZ as essential tools for analyzing and capitalizing on potential market reversals.
Bullish Pattern :
Bearish Pattern :
🔵 How to Use
The Three Drive harmonic pattern is an effective tool for identifying potential reversal points in the market. By utilizing Fibonacci extension levels (1.27 and 1.618) and focusing on the pattern’s symmetry, traders can pinpoint Potential Reversal Zones (PRZ) where the price is likely to change direction. This pattern works in both bearish and bullish scenarios, each with distinct characteristics and trading opportunities.
🟣 Bullish Three Drive Pattern
The bullish Three Drive pattern develops during a downtrend, indicating a potential reversal to the upside. Similar to its bearish counterpart, this pattern features three consecutive downward price movements (drives) with retracements in between. The third drive concludes within the PRZ, which serves as a strong support zone where the price is expected to reverse upwards.
The first drive begins with a downward movement, followed by a retracement to the 0.618 Fibonacci level. The second drive continues downward to reach a 1.27 or 1.618 Fibonacci extension of the retracement. Finally, the third drive aligns with the PRZ, where a confluence of Fibonacci levels creates a high-probability support zone.
In the PRZ, traders look for bullish confirmation signals such as bullish candlestick patterns (e.g., bullish engulfing or pin bars) or increasing trading volume. Once confirmation is observed, the PRZ becomes an ideal entry point for a buy position. Stop-loss orders are placed slightly below the PRZ to minimize risk, while take-profit targets are set at key resistance levels or Fibonacci retracement levels.
🟣 Bearish Three Drive Pattern
The bearish Three Drive pattern forms during an uptrend, signaling a potential reversal to the downside. This pattern consists of three consecutive upward price movements (drives) and intermediate retracements. Each drive aligns with Fibonacci extension levels, and the third drive ends within the PRZ, indicating a high probability of a bearish reversal.
In the first drive, the price moves upward and then retraces to approximately the 0.618 Fibonacci retracement level, forming the base for the second drive. The second drive then extends upward to the 1.27 or 1.618 Fibonacci extension of the preceding retracement. This process repeats for the third drive, which reaches the PRZ, typically defined by the convergence of Fibonacci levels from previous drives.
Once the PRZ is identified, traders look for confirmation signals such as bearish candlestick patterns (e.g., bearish engulfing or pin bars) or declining trading volume. If confirmation is present, the PRZ becomes an optimal zone for entering a sell position. Stop-loss levels are typically placed slightly above the PRZ to protect against pattern failure, and take-profit targets are set at key support levels or Fibonacci retracement levels of the overall structure.
🟣 Three Drive Vs Wedge Pattern Vs 3 Push pattern
The Three Drive, Wedge, and Three Push patterns are all used to identify potential price reversal points, but they differ significantly in structure and application. The Three Drive pattern is based on three consecutive and symmetrical price movements, validated by precise Fibonacci ratios (1.27 and 1.618), to define Potential Reversal Zones (PRZ).
In contrast, the Wedge pattern relies on converging trend lines and does not require Fibonacci ratios; it can act as either a reversal or continuation pattern. Meanwhile, the Three Push pattern shares similarities with Three Drive but lacks precise symmetry and Fibonacci-based validation.
Instead of a PRZ, Three Push focuses on identifying areas of support and resistance, often signaling weakening momentum in the current trend. Among these, the Three Drive pattern is more reliable for pinpointing high-probability reversal zones due to its strict Fibonacci-based and symmetrical structure.
🔵 Setting
🟣 Logical Setting
ZigZag Pivot Period : You can adjust the period so that the harmonic patterns are adjusted according to the pivot period you want. This factor is the most important parameter in pattern recognition.
Show Valid Format : If this parameter is on "On" mode, only patterns will be displayed that they have exact format and no noise can be seen in them. If "Off" is, the patterns displayed that maybe are noisy and do not exactly correspond to the original pattern.
Show Formation Last Pivot Confirm : if Turned on, you can see this ability of patterns when their last pivot is formed. If this feature is off, it will see the patterns as soon as they are formed. The advantage of this option being clear is less formation of fielded patterns, and it is accompanied by the latest pattern seeing and a sharp reduction in reward to risk.
Period of Formation Last Pivot : Using this parameter you can determine that the last pivot is based on Pivot period.
🟣 Genaral Setting
Show : Enter "On" to display the template and "Off" to not display the template.
Color : Enter the desired color to draw the pattern in this parameter.
LineWidth : You can enter the number 1 or numbers higher than one to adjust the thickness of the drawing lines. This number must be an integer and increases with increasing thickness.
LabelSize : You can adjust the size of the labels by using the "size.auto", "size.tiny", "size.smal", "size.normal", "size.large" or "size.huge" entries.
🟣 Alert Setting
Alert : On / Off
Message Frequency : This string parameter defines the announcement frequency. Choices include: "All" (activates the alert every time the function is called), "Once Per Bar" (activates the alert only on the first call within the bar), and "Once Per Bar Close" (the alert is activated only by a call at the last script execution of the real-time bar upon closing). The default setting is "Once per Bar".
Show Alert Time by Time Zone : The date, hour, and minute you receive in alert messages can be based on any time zone you choose. For example, if you want New York time, you should enter "UTC-4". This input is set to the time zone "UTC" by default.
🔵 Conclusion
The Three Drive pattern is a highly effective harmonic tool for identifying potential reversal points in the market. By leveraging its symmetrical structure and precise Fibonacci ratios (1.27 and 1.618), this pattern provides traders with clear entry and exit signals, enhancing the accuracy of their trades.
Whether in bullish or bearish scenarios, the identification of the Potential Reversal Zone (PRZ) serves as a critical aspect of this pattern, enabling traders to anticipate price movements with greater confidence.
Compared to similar patterns like Wedge and Three Push, the Three Drive pattern stands out for its stringent reliance on Fibonacci levels and symmetrical price movements, making it a more robust choice for forecasting reversals. However, as with any technical analysis tool, its effectiveness increases when combined with confirmation signals, such as candlestick patterns, volume analysis, and broader market context.
Mastering the Three Drive pattern requires practice and attention to detail, especially in accurately defining the PRZ and ensuring the pattern adheres to its criteria. Traders who consistently apply this pattern as part of a comprehensive trading strategy can capitalize on high-probability opportunities and improve their overall performance in the market.

Day Pattern IndicatorDay Pattern Indicator
The Day Pattern Indicator is designed to help traders analyze daily trends and patterns in their selected markets. This tool highlights specific days of the week on the chart with unique, semi-transparent colored bars. Each day is customizable, allowing users to toggle the visibility of Monday through Sunday to focus on days most relevant to their trading strategy. Ideal for identifying potential patterns in cryptocurrency, forex, or stock markets, the indicator is perfect for traders seeking insights into weekday or weekend market behavior. Simple, effective, and visually intuitive!

[EmreKb] Custom PatternCustom Pattern
With this indicator, you can create and display as many patterns as you want on the chart. The indicator works by taking two inputs. We can start the explanation by describing these inputs.
Inputs
Zigzag Length: Length for zigzag legs.
Patternscript Code: Patternscript code. (But what is patternscript?)
Explanation Of Patternscript
Patternscript (it's a completely fictional script language) is a scripting language that allows you to write your own patterns, and it operates within Pinescript). Let's take a look at the syntax of this language.
{
(, )
}
...
This means that the Fibonacci levels drawn from the from_point to the to_point must have the target_point between the min_fib_level and max_fib_level .
Let's see a few practical examples.
Patternscript Code For ABCD Pattern
ABCD{
ABC(0.618, 0.886)
BCD(1.272, 1.618)
}
ABC(0.618, 0.886): Fibonacci drawn from the A to B, must have the C between the 0.618 and 0.886
BCD(1.272, 1.618): Fibonacci drawn from the B to C, must have the D between the 1.272 and 1.618
Patternscript Code For Multiple Pattern
BAT{
XAB(0.382, 0.5)
ABC(0.382, 0.886)
BCD(1.618, 2.618)
XAD(0.382, 0.886)
}
ABCD{
ABC(0.618, 0.886)
BCD(1.272, 1.618)
}
Notes:
You can set the pattern name as you like, this is not related to the pattern rules.
There is no limit for pattern count, but remember pine limits.