eBacktesting - Learning: Head & ShoulderseBacktesting - Learning: Head & Shoulders
Head & Shoulders is one of the most recognizable reversal patterns in day trading. It helps you spot moments when a trend may be losing strength and a turn becomes more likely—often around a “neckline” level where the market either breaks and continues the reversal, or holds and keeps trending.
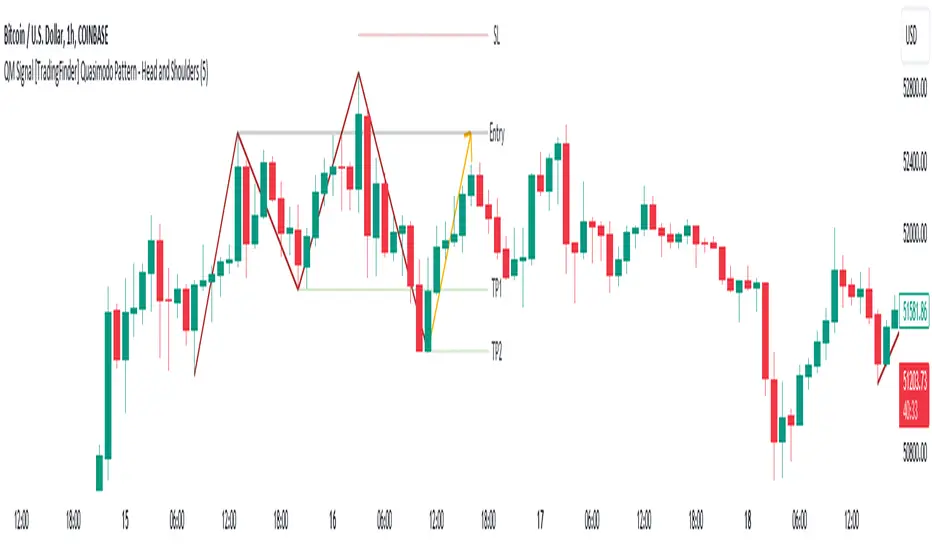
This indicator highlights both:
- Head & Shoulders (bearish): potential shift from bullish strength to bearish reversal
- Inverse Head & Shoulders (bullish): potential shift from bearish strength to bullish reversal
It marks the structure on the chart (left shoulder, head, right shoulder) and flags the moment the pattern is confirmed, so you can practice reading the story behind price action instead of guessing.
These indicators are built to pair perfectly with the eBacktesting extension, where traders can practice these concepts step-by-step. Backtesting concepts visually like this is one of the fastest ways to learn, build confidence, and improve trading performance.
Educational use only. Not financial advice.
Pine Script® indicator