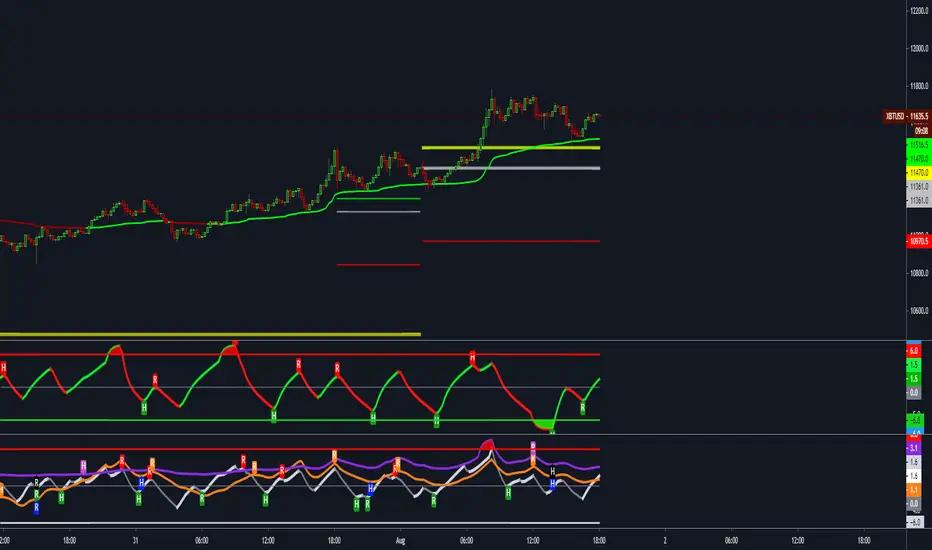
QED All-In-One(COM)-The yellow diamond and blue star are strong "Long" signals when the LF indicator's pink line crosses below 10.
-The pink star and yellow star are strong "short" signals when the LF indicator(NOT STUPID RSI) is above 90.
-The oversold (exclamation mark) signal indicates that a strong upward or downward trend could be imminent.
SUBSCRIPTION IS NEEDEED.
----------------------------------------------------------------------------------------------------------------
when pink line hits the bottom (close to 0). go for long. same as the short (opposite way)
DO NOT ENTER WHEN PINK LINE IS IN THE MIDDLE (close to YELLOW LINE). That's not the bottom or top you are looking for.
imgur.com
**************************
-노란색 다이아몬드와 파란색 별은 "Long" 시그널로 LF지표 핑크색 라인이 하단 10을 통과할때 강력합니다.
-핑크색과 노란색 별은 "short"시그널로 LF지표가 90이상일때 강력합니다.
-과매도(느낌표) 시그널은 곧 상승/하락의 추세가 될 수 있음을 의미합니다.
Hidden

Hidden BreakerHidden Breaker
DESCRIPTION
The Hidden Breaker identifies Order Blocks and tracks their transformation when they interact with Fair Value Gaps. It displays both standard Order Blocks and those modified by FVG (Breaker Blocks) across multiple timeframes within a single chart view.
METHODOLOGY ORIGIN
This indicator is based on concepts from the MoneyTaur trading methodology, which focuses on identifying Order Blocks hidden behind Fair Value Gaps from the multi-timeframe perspective.
WHAT MAKES THIS UNIQUE
- Box Management System: User-controlled box allocation through dynamic filters, ensuring all detected blocks remain visible within Pine Script's 500 box limit. Users can manage which blocks to display through price range and filter adjustments.
- Creates unified columnar visualization
- Processes 70+ timeframes (incl custom)
- Tracks each block's complete lifecycle
KEY FEATURES
Order Blocks (OB): Detects engulfing candle patterns between candle bodies with customizable deviation tolerance.
Breaker Blocks (BB): Order Blocks (candle body) that crossed Fair Value Gaps by 100% without being touched by wicks.
Partial Breaker Blocks (PBB): Candle bodies that didn't fit 100% within an FVG or were partially mitigated by wicks. Min BB size in % after passing FVG is adjustable within filter.
Multi-Timeframe Analysis: Processes 70+ timeframes without repainting
Visual Organization: Displays blocks in columns by timeframe for easy comparison. Spacing is adjustable within menu.
FVG Counter: Shows interaction count (1-5) for each block
Statistics Table: Real-time monitoring of detected blocks
Price Range Filter: Manages Pine Script's 500 box limit effectively
HOW IT WORKS
The indicator uses a three-stage detection process:
Stage 1 - Order Block Detection:
Identifies engulfing patterns where one candle body fully engulfs the body of the previous opposite candle. The system allows for small price deviations. The detected zone spans from the open to close of the engulfed candle.
Stage 2 - FVG Interaction:
Monitors for Fair Value Gaps that occur when the candle's low is above the high from two candles ago (bullish gap) or when the high is below the low from two candles ago (bearish gap). When such a gap overlaps an existing Order Block, the system evaluates:
Checks whether the OB’s body is fully contained within the FVG range (passed 100% through it without wick contact) — shown as 1H | 1, where 1H is the timeframe and 1 the FVG count.
The percentage of the OB body retained within the FVG after zone adjustment is filter-controlled.
Directional bias is inherited from the FVG.
Blocks with multiple FVG interactions (counted 1–5+) allow filtering of BBs based on their FVG overlap frequency.
Stage 3 - Single or Multi-Timeframe Processing:
Collects data from multiple timeframes simultaneously, processes it without repainting, and displays horizontal boxes with timeframe labels arranged in vertical columns, where each timeframe occupies its own designated horizontal space for clear visual separation.
DETECTION CRITERIA
Order Block: Engulfing with body-to-body alignment within adjustable deviation tolerance
Breaker Block: OB that intersects with subsequent FVG. When filter is set to 100%, shows only BBs where the body fully passed through FVG without wick touches.
Partial Breaker Block (PBB): An Order Block partially intersected by an FVG or partially mitigated by a subsequent candle, narrowing the original Breaker Block range.
FVG validation: Gap between candles 1 and 3
VISUAL GUIDE
Green: Bullish Order Blocks
Red: Bearish Order Blocks
Blue: Bullish Breaker Blocks
Orange: Bearish Breaker Blocks
Teal: Bullish Partial Breaker Blocks
Purple: Bearish Partial Breaker Blocks
Numbers: FVG interaction count (1-5)
Percentages: Remaining unmitigated area
SETTINGS
Block Type Selection: Choose to display OB only, BB/PBB only
Deviation (%): Tolerance for engulfing pattern detection
Min Engulfing Impulse (%): Minimum required price movement for valid engulfing
FVG Filter: Set minimum FVG count required (1-5)
Min BB Size after FVG (%): Minimum remaining size of an BB after passing an FVG
Hide if Mitigated More Than (%): Visibility threshold for partially mitigated blocks
Price Range Filter (%): Limit Block detection to specific price ranges from current price
Price Range Axis (%): Offset reference point for price range
Timeframe Groups: Select from 6 predefined groups or custom timeframes
Max Bars to Scan: Historical lookback period (100-10000)
Replay Mode: used for historical backtesting and visual analysis for higher TF data.
TIMEFRAME GROUPS
Group 1: Minutes & Short Hours (5m-4H)
Group 2: Extended Hours (5H-23H)
Group 3: Days (1D-19D)
Group 4: Weeks (1W-12W)
Group 5: Months (1M-12M)
Group 6: 19 Custom timeframes
USAGE NOTES
Select appropriate timeframe groups for your analysis style
Adjust deviation and impulse settings based on market volatility
Use FVG filter to focus on blocks with multiple gap interactions
Monitor the statistics table to ensure box count stays under 500. If approaching limit, narrow the price range filter
Each box shows its description aligned vertically by timeframe
TECHNICAL SPECIFICATIONS
Pine Script Version 6
Default scan range: 5000 historical bars
Maximum 500 boxes per chart (Pine Script limitation)
Non-repainting calculations
Compatible with all markets and timeframes
Optimized memory management for multi-timeframe processing
TERMS AND CONDITIONS
This indicator and its documentation do not constitute financial or investment advice.
Users should make independent trading decisions and accept full responsibility for their outcomes.
Use of this tool implies that you understand the risks of financial markets and agree that the author is not liable for any loss or damage arising from its use.
This indicator is designed solely as a visualisation tool to assist with chart analysis.
It does not teach, promote, or automate any specific trading strategy, concept, or methodology.
All visual elements — such as OBs, BBs, PBBs, FVGs, and related interactions — are intended to support manual study and backtesting, not to generate trading signals.
Past performance does not guarantee future results. By using this tool, users agree to these terms.
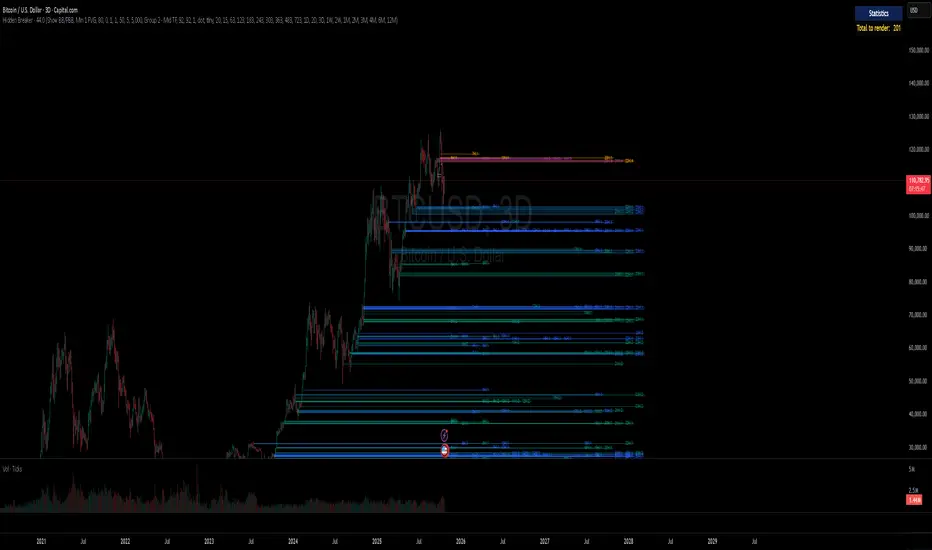
Order + Breaker Blocks - Custom TimeframesThis indicator is a Hidden Liquidity Script, being a much more refined and precise version of "Order Blocks" also known as "Supply and Demand" zones.
This script is more refined and precise as this script is the only script that displays the exact body part of blocks on multiple timeframes, showing potentially powerful price reversal zones for taking a long or short.
This is a PRICE ACTION indicator, demonstrating price action that can result in potential good support/resistance levels for taking a long or short trade.
This indicator only displays the body part of order blocks, instead of including wicks that all other indicators do. That makes this script a much more refined version of all other scripts out there.
Not only that, this script can collate multiple timeframes into one indicator, again something other scripts cannot do.
This script is also unique compared to other Hidden Liquidity style scripts in that you have full control over each Order Block so you can see each individual block on a chart, whilst other charts combine them into a zone instead. This refined version gives you precise potential entries and much further refinement as well as more thorough backtesting capabilities.
This script also can highlight order blocks that pass THROUGH a Fair Value Gap. These are known as 'Breaker Blocks'. These powerful blocks can be places of interest as support or resistance for a long or short trade. Note: This script shows the body part of a block only and not the wick.
Breaker Blocks, where significant displacement has occurred in price past a block can be more powerful. This script does not highlight Fair Value Gaps themselves, only order blocks (supply and demand) and breaker blocks through displacement in price (through an FVG). FVGs on their own can be weaker without order blocks behind them hence they are not highlighted.
The BODY of the order block, and the 0.5 of the order block are key regions for considering a trade, treating that level as either resistance or support.
Important: PLEASE NOTE: This indicator will only show timeframes that are higher than or the same as the current chart timeframe.
For Example, only blocks 3 Days or higher will show on a 3D chart. It will not show 12h blocks on a 3D chart. You would need to go to a 12 hour chart with the 12h blocks showing to see all Blocks that are 12h or higher drawn.
This Script differs from others in that you can DEFINE your OWN TIMEFRAMES.
It caters for 4 timeframes. If it is slow loading, deselect the 3 others and show only one.
LTF can take a looong time to load and may not be possible at all on subscriptions with only 20s compute time on their plan.
However if you have a timeframe in mind you have wanted to check out that is not standard, you can do it with this Indicator.
For seconds, use the digit and add an “S” to it. Eg 45 seconds use “45S”
For Mintues and Hours, you must do them in minute format with no letter added. Eg 145 minutes is “145”. 30 minutes is “30”. 6 hours is “360” minutes. Trading View allows up to 24 hours in minute format.
For Days, eg 3 Days use “3D”
For Weeks, eg 5 Weeks, use ‘5W”
For Months, eg 6 Months, use “6M”.
If you don’t use the correct format as specified above it will not work or display anything.
SETTINGS:
There is options to change the colours of the boxes and to differentiate between Order Blocks and stronger Breaker Blocks if desired.
If this is NOT desired, make all color options the same color,.
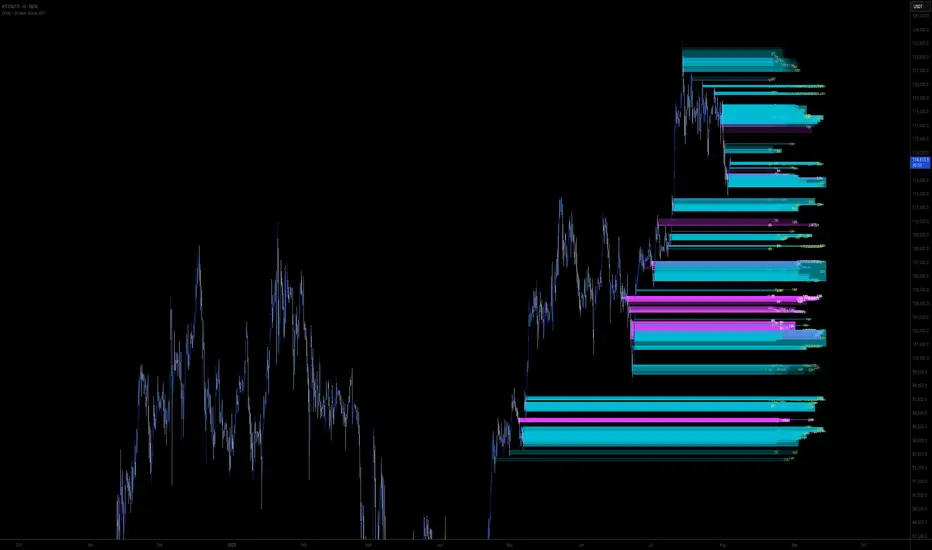
Shown below is blue Order Blocks (Supply and Demand
Shown below there is Pink Breaker Blocks.
There is options to weaken the colour of blocks that have been tapped by a wick and thus partially used up, also called partially "mitigated".These blocks can be considered weaker support/resistance.
Once a block has had a wick or body close over it entirely, the block can be considered fully "mitigated" and will disappear from the indicator once that candle has closed. This block level can now be considered too weak. You can also choose to not show these partially mitigated blocks at all.
The charts above shows pale Violet blocks as partially mitigated or "tapped" blocks.
The blocks in HOT BRIGHT Violet are untapped and potentially stronger levels for a Long or Short trade. See below the 7h.
Additional SETTINGS:
Further options include, if selected: Counting the number of fair value gaps an order block may pass through. More FVGs an order block (now a breaker block) passes through can strengthen the support of that block level, making a reversal more likely.
There is an option of showing old mitigated order blocks and changing the color of these on the chart. This can aid in backtesting of levels.
Further Settings include:
- an option to remove very thin blocks that may not be strong points.
- an option to denote with a character such as a * blocks that have their EQ 0.5 region wicked - these can be considered weaker.
- an option to denote with an additional * or another character blocks that are barely tapped by a small percent so you know they are still considered quite strong.
- an option to show how many candles form the order block.
Additional Options include:
- an option to show blocks only within a specific price range or percent range of the current price.
- an option to only look X number of bars back.
There is Options regarding labelling, and Border widths on boxes.
It is ESSENTIAL to do your own research and backtesting!
It is recommended to combine these levels with other concepts for added confluence.
Other indicators are NOT included in this script. This is purely a refined order block script for the BODY of a block only.
You can combine Order Blocks and stronger versions known as Breaker Blocks in this script with other indicators or concepts to form a Full Trading Strategy.
Other potential concepts to combine, not shown in this script can include Smart Money Concepts, Market Structure, Fibonnaccis, SMAs, EMAs or any other concept to give added confluence to the support / resistance levels identified in this script that may indicate that the level is stronger.
This indicator is not a trading strategy on its own. It is best used in combination with other concepts to improve the success.
Backtesting this indicator is highly recommended and incorporated into a full trading system of your own design. This only identifies possible key regions based on Price Action Strategies.
This indicator simply makes the identification of these hot levels easier and simpler to find, especially across multiple timeframes.
A strong bright zone on the indicator can be a stronger level than a weak partial block that is in light colours.
Again -Please do your own research and backtesting.
These indicators make finding these levels much much simpler and easier when combined with a full trading strategy.
Any feedback is welcome.

Order + Breaker Blocks MTF - Vees Hidden LiquidityThis indicator is a Hidden Liquidity Script, being a much more refined and precise version of "Order Blocks" also known as "Supply and Demand" zones.
This script is more refined and precise as this script is the only script that displays the exact body part of blocks on multiple timeframes, showing potentially powerful price reversal zones for taking a long or short.
This is a PRICE ACTION indicator, demonstrating price action that can result in potential good support/resistance levels for taking a long or short trade.
This indicator only displays the body part of order blocks, instead of including wicks that all other indicators do. That makes this script a much more refined version of all other scripts out there.
Not only that, this script can collate multiple timeframes into one indicator, again something other scripts cannot do.
This script is also unique compared to other Hidden Liquidity style scripts in that you have full control over each Order Block so you can see each individual block on a chart, whilst other charts combine them into a zone instead. This refined version gives you precise potential entries and much further refinement as well as more thorough backtesting capabilities.
This script also can highlight order blocks that pass THROUGH a Fair Value Gap. These are known as 'Breaker Blocks'. These powerful blocks can be places of interest as support or resistance for a long or short trade. Note: This script shows the body part of a block only and not the wick.
Breaker Blocks, where significant displacement has occurred in price past a block can be more powerful. This script does not highlight Fair Value Gaps themselves, only order blocks (supply and demand) and breaker blocks through displacement in price (through an FVG). FVGs on their own can be weaker without order blocks behind them hence they are not highlighted.
The BODY of the order block, and the 0.5 of the order block are key regions for considering a trade, treating that level as either resistance or support.
Important: PLEASE NOTE: This indicator will only show timeframes that are higher than or the same as the current chart timeframe.
For Example, only blocks 3 Days or higher will show on a 3D chart. It will not show 12h blocks on a 3D chart. You would need to go to a 12 hour chart with the 12h blocks showing to see all Blocks that are 12h or higher drawn.
SETTINGS:
There is options to change the colours of the boxes and to differentiate between Order Blocks and stronger Breaker Blocks if desired.
If this is NOT desired, make all color options the same color,.
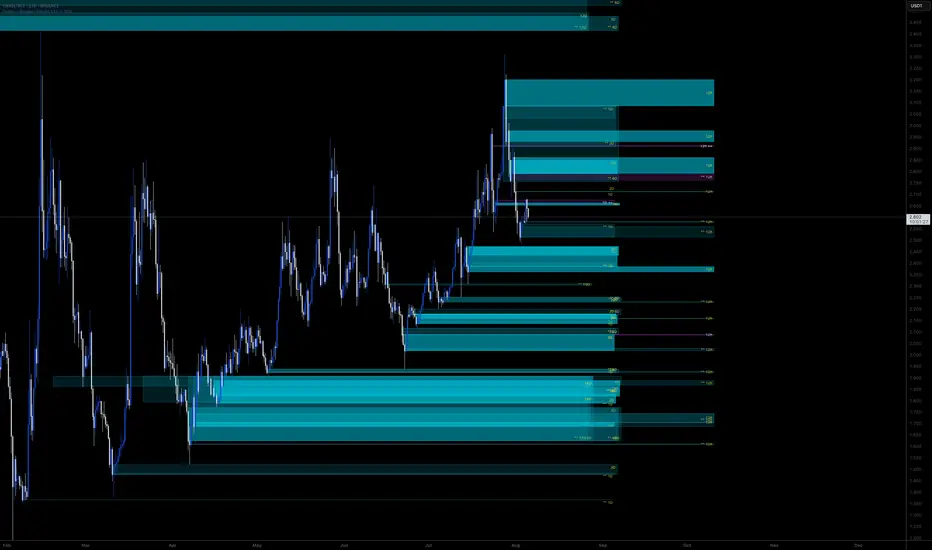
Shown below is blue Order Blocks (Supply and Demand
Shown below there is Pink Breaker Blocks.
There is options to weaken the colour of blocks that have been tapped by a wick and thus partially used up, also called partially "mitigated".These blocks can be considered weaker support/resistance.
Once a block has had a wick or body close over it entirely, the block can be considered fully "mitigated" and will disappear from the indicator once that candle has closed. This block level can now be considered too weak. You can also choose to not show these partially mitigated blocks at all.
The charts above shows pale Violet blocks as partially mitigated or "tapped" blocks.
The blocks in HOT BRIGHT Violet are untapped and potentially stronger levels for a Long or Short trade. See below the 7h.
Additional SETTINGS:
Further options include, if selected: Counting the number of fair value gaps an order block may pass through. More FVGs an order block (now a breaker block) passes through can strengthen the support of that block level, making a reversal more likely.
There is an option of showing old mitigated order blocks and changing the color of these on the chart. This can aid in backtesting of levels.
Further Settings include:
- an option to remove very thin blocks that may not be strong points.
- an option to denote with a character such as a * blocks that have their EQ 0.5 region wicked - these can be considered weaker.
- an option to denote with an additional * or another character blocks that are barely tapped by a small percent so you know they are still considered quite strong.
- an option to show how many candles form the order block.
Additional Options include:
- an option to show blocks only within a specific price range or percent range of the current price.
- an option to only look X number of bars back.
There is Options regarding labelling, and Border widths on boxes.
It is ESSENTIAL to do your own research and backtesting!
It is recommended to combine these levels with other concepts for added confluence.
Other indicators are NOT included in this script. This is purely a refined order block script for the BODY of a block only.
You can combine Order Blocks and stronger versions known as Breaker Blocks in this script with other indicators or concepts to form a Full Trading Strategy.
Other potential concepts to combine, not shown in this script can include Smart Money Concepts, Market Structure, Fibonnaccis, SMAs, EMAs or any other concept to give added confluence to the support / resistance levels identified in this script that may indicate that the level is stronger.
This indicator is not a trading strategy on its own. It is best used in combination with other concepts to improve the success.
Backtesting this indicator is highly recommended and incorporated into a full trading system of your own design. This only identifies possible key regions based on Price Action Strategies.
This indicator simply makes the identification of these hot levels easier and simpler to find, especially across multiple timeframes.
A strong bright zone on the indicator can be a stronger level than a weak partial block that is in light colours.
Again -Please do your own research and backtesting.
These indicators make finding these levels much much simpler and easier when combined with a full trading strategy.
Any feedback is welcome.
Order + Breaker Blocks HTFThis indicator is a Hidden Liquidity Script, being a much more refined and precise version of "Order Blocks" also known as "Supply and Demand" zones.
This script is more refined and precise as this script is the only script that displays the exact body part of blocks on multiple timeframes, showing potentially powerful price reversal zones for taking a long or short.
This is a PRICE ACTION indicator, demonstrating price action that can result in potential good support/resistance levels for taking a long or short trade.
This indicator only displays the body part of order blocks, instead of including wicks that all other indicators do. That makes this script a much more refined version of all other scripts out there.
Not only that, this script can collate multiple timeframes into one indicator, again something other scripts cannot do.
This script is also unique compared to other Hidden Liquidity style scripts in that you have full control over each Order Block so you can see each individual block on a chart, whilst other charts combine them into a zone instead. This refined version gives you precise potential entries and much further refinement as well as more thorough backtesting capabilities.
This script also can highlight order blocks that pass THROUGH a Fair Value Gap. These are known as 'Breaker Blocks'. These powerful blocks can be places of interest as support or resistance for a long or short trade. Note: This script shows the body part of a block only and not the wick.
Breaker Blocks, where significant displacement has occurred in price past a block can be more powerful. This script does not highlight Fair Value Gaps themselves, only order blocks (supply and demand) and breaker blocks through displacement in price (through an FVG). FVGs on their own can be weaker without order blocks behind them hence they are not highlighted.
The BODY of the order block, and the 0.5 of the order block are key regions for considering a trade, treating that level as either resistance or support.
Important: PLEASE NOTE: This indicator will only show timeframes that are higher than or the same as the current chart timeframe.
For Example, only blocks 3 Days or higher will show on a 3D chart. It will not show 12h blocks on a 3D chart. You would need to go to a 12 hour chart with the 12h blocks showing to see all Blocks that are 12h or higher drawn.
SETTINGS:
There is options to change the colours of the boxes and to differentiate between Order Blocks and stronger Breaker Blocks if desired.
If this is NOT desired, make all color options the same color,.
Shown below is blue Order Blocks (Supply and Demand)
Shown below there is Pink Breaker Blocks.
There is options to weaken the colour of blocks that have been tapped by a wick and thus partially used up, also called partially "mitigated".These blocks can be considered weaker support/resistance.
Once a block has had a wick or body close over it entirely, the block can be considered fully "mitigated" and will disappear from the indicator once that candle has closed. This block level can now be considered too weak. You can also choose to not show these partially mitigated blocks at all.
The chart above shows pale Violet blocks as partially mitigated or "tapped" blocks.
The blocks in HOT BRIGHT Violet are untapped and potentially stronger levels for a Long or Short trade.
See below and example of a HOT PINK stronger level with a 1,2,3,4,5 Days of blocks in the one area.
See below an example of a weaker pink level. Still valid, but potentially riskier. There is a weaker 5D Block in pale pink and no other days in that same zone.
Additional SETTINGS:
Further options include, if selected: Counting the number of fair value gaps an order block may pass through. More FVGs an order block (now a breaker block) passes through can strengthen the support of that block level, making a reversal more likely.
There is an option of showing old mitigated order blocks and changing the color of these on the chart. This can aid in backtesting of levels.
Further Settings include:
- an option to remove very thin blocks that may not be strong points.
- an option to denote with a character such as a * blocks that have their EQ 0.5 region wicked - these can be considered weaker.
- an option to denote with an additional * or another character blocks that are barely tapped by a small percent so you know they are still considered quite strong.
- an option to show how many candles form the order block.
Additional Options include:
- an option to show blocks only within a specific price range or percent range of the current price.
- an option to only look X number of bars back.
There is Options regarding labelling, and Border widths on boxes.
It is ESSENTIAL to do your own research and backtesting!
It is recommended to combine these levels with other concepts for added confluence.
Other indicators are NOT included in this script. This is purely a refined order block script for the BODY of a block only.
You can combine Order Blocks and stronger versions known as Breaker Blocks in this script with other indicators or concepts to form a Full Trading Strategy.
Other potential concepts to combine, not shown in this script can include Smart Money Concepts, Market Structure, Fibonnaccis, SMAs, EMAs or any other concept to give added confluence to the support / resistance levels identified in this script that may indicate that the level is stronger.
This indicator is not a trading strategy on its own. It is best used in combination with other concepts to improve the success.
Backtesting this indicator is highly recommended and incorporated into a full trading system of your own design. This only identifies possible key regions based on Price Action Strategies.
This indicator simply makes the identification of these hot levels easier and simpler to find, especially across multiple timeframes.
A strong bright zone on the indicator can be a stronger level than a weak partial block that is in light colours.
Again -Please do your own research and backtesting.
These indicators make finding these levels much much simpler and easier when combined with a full trading strategy.
Any feedback is welcome.
RSI Overbought/Oversold + Divergence IndicatorDESCRIPTION:
This script combines the Relative Strength Index ( RSI ), Moving Average and Divergence indicator to make a better decision when to enter or exit a trade.
- The Moving Average line (MA) has been made hidden by default but enhanced with an RSIMA cloud.
- When the RSI is above the selected MA it turns into green and when the RSI is below the select MA it turns into red.
- When the RSI is moving into the Overbought or Oversold area, some highlighted areas will appear.
- When some divergences or hidden divergences are detected an extra indication will be highlighted.
- When the divergence appear in the Overbought or Oversold area the more weight it give to make a decision.
- The same color pallet has been used as the default candlestick colors so it looks familiar.
HOW TO USE:
The prerequisite is that we have some knowledge about the Elliot Wave Theory, the Fibonacci Retracement and the Fibonacci Extension tools.
Wave 1
(1) When we receive some buy signals we wait until we receive some extra indications.
(2) On the RSI Overbought/Oversold + Divergence Indicator we can see a Bullish Divergence and our RSI is changing from red to green ( RSI is higher then the MA).
(3) If we are getting here into the trade then we need to use a stop loss. We put our stop loss 1 a 2 pips just below the lowest wick. We also invest maximum 50% of the total amount we want to invest.
Wave 2
(4) Now we wait until we see a clear reversal and here we starting to use the Fibonacci Retracement tool. We draw a line from the lowest point of wave(1) till the highest point of wave (1). When we are retraced till the 0.618 fib also called the golden ratio we check again the RSI Overbought/Oversold + Divergence Indicator. When we see a reversal we do our second buy. We set again a stop loss just below the lowest wick (this is the yellow line on the chart). We also move the stop loss we have set in step (3) to this level.
Wave 3
(5) To identify how far the uptrend can go we need to use the Fibonacci Extension tool. We draw a line from the lowest point of wave(1) till the highest point of wave (1) and draw it back to the lowest point of wave (2). Wave (3) is most of the time the longest wave and can go till it has reached the 1.618 or 2.618 fib. On the 1.618 we can take some profit. If we don't want to sell we move our stop loss to the 1 fib line (yellow line on the chart).
(6) We wait until we see a clear reversal on the Overbought/Oversold + Divergence Indicator and sell 33% to 50% of our investment.
Wave 4
(7) Now we wait again until we see a clear reversal and here we starting to use the Fibonacci Retracement tool. We draw a line from the lowest point of wave(2) till the highest point of wave (3). When we are retraced till the 0.618 fib also called the golden ratio we check again the RSI Overbought/Oversold + Divergence Indicator. When we see a reversal we buy again. We set again a stop loss just below the lowest wick (this is the yellow line on the chart).
(8) If we bought at the first reversal ours stop los was triggered (9) and we got out of the trade.
(9) If we did not bought at step (7) because our candle did not hit the 0.618 fib or we got stopped out of the trade we buy again at the reversal.
Wave 5
(10) To identify how far the uptrend can go we need to use the Fibonacci Extension tool. We draw a line from the lowest point of wave(2) till the highest point of wave (3) and draw it back to the lowest point of wave (4). Most of the time wave 5 goes up till it has reached the 1 fib. And that is the point where we got out of the trade with all of our investment. In this trade we got out of the trade a bit earlier. We received the sell signals and got a reversal on the Overbought/Oversold + Divergence Indicator.
We are hoping you learned something so you can make better decisions when to get into or out of a trade.
If you have any question just drop it into the comments below.
FEATURES:
• You can show/hide the RSI .
• You can show/hide the MA.
• You can show/hide the lRSIMA cloud.
• You can show/hide the Stoch RSI cloud.
• You can show/hide and adjust the Overbought and Oversold zones.
• You can show/hide and adjust the Overbought Extended and Oversold Extended zones.
• You can show/hide the Overbought and Oversold highlighted zones.
• Etc...
HOW TO GET ACCESS TO THE SCRIPT:
• Favorite the script and add it to your chart.
REMARKS:
• This advice is NOT financial advice.
• We do not provide personal investment advice and we are not a qualified licensed investment advisor.
• All information found here, including any ideas, opinions, views, predictions, forecasts, commentaries, suggestions, or stock picks, expressed or implied herein, are for informational, entertainment or educational purposes only and should not be construed as personal investment advice.
• We will not and cannot be held liable for any actions you take as a result of anything you read here.
• We only provide this information to help you make a better decision.
• While the information provided is believed to be accurate, it may include errors or inaccuracies.
Good Luck and have fun,
The CryptoSignalScanner Team

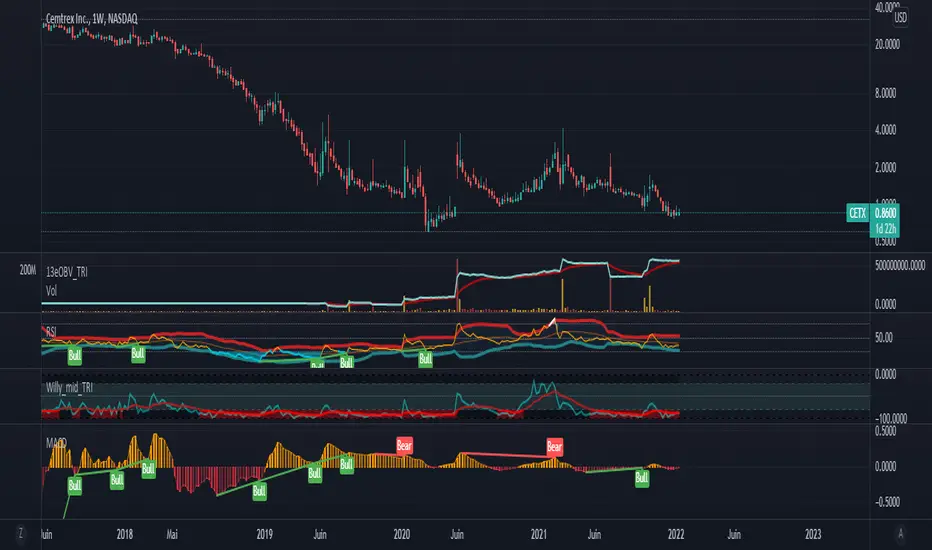
Jurik Smoothed Stochastic - TraderHalaiJurik Smoothed Stochastic
The stochastic indicator has been long used by traders to identify inflection points in the price and to give a direction on Bullish and Bearish bias.
This indicator aims to improve on the plots the %K value smoothed using a Jurik Filter instead of a simple moving average. This allows for a more adaptive K value average price, whilst also providing superior smoothing to traditional moving averages.
As the Jurik Filter is a proprietary and non-open-source implementation, this script uses a common filters library implementation of Jurik MA which is a suitable proxy to the actual Jurik MA filter.
Big thanks to LastGuru for making his version freely available. You can find his version of the Jurik Filters in the credits section below.
%K is the Jurik Smoothed Version of the original Stochastic Formula
%D is calculated using the following formula. This idea was borrowed from John Ehler’s stochastic implementation and can be seen below:
%D = 0.05 + 0.95 * K
Features
%K line, Overbought and Oversold level and Mid Line Level
Oversold / Overbought reversal indicators and signals - Shown in Red and Green
Bullish / Bearish Divergences – Including Hidden divergences to spot reversals and continuations of trend (Big thanks to the developers of the built-in RSI Divergence indicator) - Shown as below:
Bullish / Bearish crossover of %K with %D - Shown in Cyan and Fuschia
Alerts for all of the above conditions
Double Jurik smoothing mode - similar to slow Stochastic
Credits :
Massive shoutout to the following scripts:
LastGuru JurikMA implementation (Common Filters Library)
Divergence Indicator – Built into TradingView and coded by TradingView Developers
This script is published as open source to allow for criticism, further development of this strategy and use by the community. Feel free to use this indicator/source code as you see fit.
Enjoy! :)

No Active BarThis is probably the only script on TradingView that's clinically proven to lower your blood pressure!***
This script in conjunction with some chart settings changes can completely hide the active candle, only showing historic candles, thus, reducing risk of cardiac arrest and or panic attack.
What to do:
0. Make sure you are using a candlestick chart or this script won't work properly
1. Right click the chart and select "Settings..."
2. Select "Symbol" under the "Chart Settings" menu
3. Disable every item EXCEPT for the "Body"
4. Click on the boxes next to "Body" to access the color picker then change both box's transparency settings down to 0
(the script only colors closed bars, so the active bar will be present just transparent)
5. Right click on the price scale on the far left or far right side of the screen and hover the mouse over "Labels". If any selections have a check mark next to them click them to disable them (especially the "Ask & Bid" price setting since it tracks current price)
That's it! Instead of wicks the High & Low prices are plotted above and below the candles using a step line. It looks a bit strange at first but you'll get used to it. Check out the indicator settings to change the color and style of the High & Low lines.
***The statement could prove true for some but is mostly complete bullshit

MACD + Divergence + Line █ OVERVIEW
Here's the classic MACD with some simples features in plus.
█ CONCEPTS
4 features
1 — Classic MACD histogram, with 4 different colors such as above or below 0, and above or below the previous bar
2 — Display option to disable EMA
3 — A signal line that show the exact point, because the histogram view might be hard to be precise
4 — Looking for previous Divergences, Bullish, Bearish and Hidden Bullish and Bearish but I don't like Hidden divergences
█ OTHER SECTIONS
An oscillator is good to know where we are in the trends, but it's not enough to run a small business of trading, you need to learn how to use it.
What is a divergence ?
Thanks to The rational investor for teaching me how to use this indicator.
Buyer-seller strengthThis is my first attempt to convert my price action trading principles into pine script.
As price action trader, we attempt the see the hidden strength of buyer in sellers candle and vice versa. I use simple calculation of candle wick to body -proportion to assess the strength. This script identifies the proportion of buyers and sellers in any given candle in form of %. Sellers are given in positive % and buyers are given as negative %. By moving the cursor to the interested candle the values can be seen.
While this will not be useful for decision as sole trading system, I use it as adjunct, whenever I analyze the data.
Happy trading

[TrustedSignals] Oscillator DivergencesDivergences are powerful tools that assess the price momentum and the likelihood of a price reversal. A positive divergence occurs when the price of an asset makes a new low while an oscillator, starts to climb. Conversely, a negative divergence is when the price makes a new high but the oscillator analyzed makes a lower high.
Once again, with the idea of providing an All-in-One indicator, this script can display the Divergences in up to 9 most used oscillators (RSI, Stochastic RSI, Stochastic, Williams%, MFI, ChangeMO, CCI, BB %B) including our own branded no-lag ‘ TS Oscillator ’
We have also included an optional custom no-lag smoothing function, that allows the user to smooth out the noise on all the oscillators and increase their accuracy, without delaying the actual data. This feature can be turned off if necessary and the smoothing length can be manually adjusted.
After the user selects from the first input the desired oscillator, the indicator can display Regular and Hidden Divergences on the chart.
The lookback period of the divergences is also fully configurable, as the settings for each of our individual oscillators.

Efficient Support & Resistance LevelsThis script is a mixture of my two previous scripts "True Strong Classical Support/Resistance Levels" and "Hidden Supports & Resistances + Round Levels". This combination brings on better identification of the most efficient support/resistance levels.
Note that "Hidden SnR Levels" part of the code is only expected to work on Forex charts, but apart from that, the other parts could be applied to any chart.
The script may:
- Draw classical support/resistance levels which retraced the price previously, aided by multi-timeframe analysis
- Draw hidden support/resistance levels based on psychological patterns of the price
- Adjust to wicks better than Pine Script built-in pivot functions
- Differ the levels color based on chart reactions
- Merge nearby classical levels to avoid congestion on the chart
Feel free to use it and send me your thoughts.

Hidden Supports & Resistances + Round LevelsIf you search the internet, you won't find much about these types of resistance and support levels. Hidden levels are SnR levels calculated based on some psychological patterns and sometimes it's unbelievable that the chart responds to these levels.
So use the indicator and check the idea.

Fisher Transform DivergenceEhler's Fisher transform with instant confirmation divergences.
Scheduled update is adding hidden divergences, currently under construction
OccultVolume mathematical calculation between buyers and sellers from a large point of view
this indicator shows you what its really happening behind the table of the market
gives your the occult or hidden information from the volume of the market this way you won't be fullish on your decision


BOSS Smooth Stochastic-RSI And RSI Oscillators With Alerts THE BEST FOREX, BINARY OPTIONS, STOCK AND CRYPTO INDICATORS FOR TRADINGVIEW.COM
Our Smooth Stochastic RSI indicator and our RSI indicator all combined in one!
BACKGROUND AND BAR COLOR
Green=BULLISH
Yellow= NEUTRAL/TRANSITIONAL
Red= BEARISH
ALERTS
GET ALERTS FOR BULLISH AND BEARISH CROSSOVERS ON STOCHASTIC RSI
GET ALERTS WHEN RSI LINE IS GREEN AND RED

DMIBBDirectional movement indicator for assessing price direction and strength. DMI tells you when to be long or short, differentiatING between strong &weak trends. DMI works on all time frames and applicable to any asset.
DMI is a moving average of range expansion over an input period. The positive directional movement indicator (+DMI) measures how strongly price moves upward; the negative directional movement indicator (-DMI) measures how strongly price moves downward. The two lines reflect the respective strength of the bulls versus the bears. Which DMI lines is on top is the dominant DMI. The dominant DMI is stronger and more likely to predict the direction of price. For the buyers and sellers to change dominance, the lines must cross over.
Added feature is Bollinger Bands to moderate signals.
AbsorptionThis script is designed to alert one to the possible presence of hidden walls, or visible, that are absorbing a lot of volume without letting price change. Therefore acting as Support and Resistance.
