Hull Suite StrategyConverted the hull suite into a strategy script for easy backtesting and added ability to specify a time periods to backtest over.
Hullmovingaverage

HEMA - A Fast And Efficient Estimate Of The Hull Moving AverageIntroduction
The Hull moving average (HMA) developed by Alan Hull is one of the many moving averages that aim to reduce lag while providing effective smoothing. The HMA make use of 3 linearly weighted (WMA) moving averages, with respective periods p/2 , p and √p , this involve three convolutions, which affect computation time, a more efficient version exist under the name of exponential Hull moving average (EHMA), this version make use of exponential moving averages instead of linearly weighted ones, which dramatically decrease the computation time, however the difference with the original version is clearly noticeable.
In this post an efficient and simple estimate is proposed, the estimation process will be fully described and some comparison with the original HMA will be presented.
This post and indicator is dedicated to LucF
Estimation Process
Estimating a moving average is easier when we look at its weights (represented by the impulse response), we basically want to find a similar set of weights via more efficient calculations, the estimation process is therefore based on fully understanding the weighting architecture of the moving average we want to estimate.
The impulse response of an HMA of period 20 is as follows :
We can see that the first weights increases a bit before decaying, the weights then decay, cross under 0 and increase again. More recent closing price values benefits of the highest weights, while the oldest values have negatives ones, negative weighting is what allow to drastically reduce the lag of the HMA. Based on this information we know that our estimate will be a linear combination of two moving averages with unknown coefficients :
a × MA1 + b × MA2
With a > 0 and b < 0 , the lag of MA1 is lower than the lag of MA2 . We first need to capture the general envelope of the weights, which has an overall non-linearly decaying shape, therefore the use of an exponential moving average might seem appropriate.
In orange the impulse response of an exponential moving average of period p/2 , that is 10. We can see that such impulse response is not a bad estimate of the overall shape of the HMA impulse response, based on this information we might perform our linear combination with a simple moving average :
2EMA(p/2) + -1SMA(p)
this gives the following impulse response :
As we can see there is a clear lack of accuracy, but because the impulse response of a simple moving is a constant we can't have the short increasing weights of the HMA, we therefore need a non-constant impulse response for our linear combination, a WMA might be appropriate. Therefore we will use :
2WMA(p/2) + -1EMA(p/2)
Note that the lag a WMA is inferior to the lag of an EMA of same period, this is why the period of the WMA is p/2 . We obtain :
The shape has improved, but the fit is poor, which mean we should change our coefficients, more precisely increasing the coefficient of the WMA (thus decreasing the one of the EMA). We will try :
3WMA(p/2) + -2EMA(p/2)
We then obtain :
This estimate seems to have a decent fit, and this linear combination is therefore used.
Comparison
HMA in blue and the estimate in fuchsia with both period 50, the difference can be noted, however the estimate is relatively accurate.
In the image above the period has been set to 200.
Conclusion
In this post an efficient estimate of the HMA has been proposed, we have seen that the HMA can be estimated via the linear combinations of a WMA and an EMA of each period p/2 , this isn't important for the EMA who is based on recursion but is however a big deal for the WMA who use recursion, and therefore p indicate the number of data points to be used in the convolution, knowing that we use only convolution and that this convolution use twice less data points then one of the WMA used in the HMA is a pretty great thing.
Subtle tweaking of the coefficients/moving averages length's might help have an even more accurate estimate, the fact that the WMA make use of a period of √p is certainly the most disturbing aspect when it comes to estimating the HMA. I also described more in depth the process of estimating a moving average.
I hope you learned something in this post, it took me quite a lot of time to prepare, maybe 2 hours, some pinescripters pass an enormous amount of time providing content and helping the community, one of them being LucF, without him i don't think you'll be seeing this indicator as well as many ones i previously posted, I encourage you to thank him and check his work for Pinecoders as well as following him.
Thanks for reading !

CryptoBandsGuru MultiColor Bollinger BandsHere are my Bollinger Bands that come with 2 std dev bands and a variety of moving averages. The bands can have shading between the bands and the middle section can be shaded.
Moving Averages include:
SMA
EMA
Weighted
Hull
Symmetrical
Volume Weighted
Wilder
Right now my 2 favorites are the Hull with a std dev of .5 and the Wilder with a std dev of 1.7 and 2.0.
You can get some really good signals buy putting both on the same chart. The faster Hull will move above and below the slower Wilder and show good price action.

(12) Pass Band Muti VS-97PBM transforms volatile and conflicting candles into obvious and easy trading decisions. It’s this simple; stocks trending in an upward direction will be above the zero line (1) in the chart below. Stock trending downward will be below the zero line (2). Zero line crossovers are indicating turning points and trading opportunities (3). This gives you advanced warning of when your trades are approaching the next turning point, as the indicator will migrate back toward the zero line. Momentum, Volatility and Rate-of-Change are each unique and distinctive attributes of stocks in strong trends. The Pass Band Multi indicator provides the trader with a collective or merged indication of these attributes, all reflected by this indicator as the height or distance the Pass Band, sin-wave, signal line is from the zero line (4).
When a stock’s PBM indicator advances rapidly, moving far above or far below the zero line you are seeing stocks in a strong trend with strong momentum. This strength and correspondingly the momentum will diminish over time in the absence of new market motivating factors such as rumors, news or earnings. As this occurs, the signal line will again drift down and approach the zero line even if the price has not moved against this most recent trend(5). This is a function of most oscillators and is referred to as detrending.
The closer your trade comes to the zero line the more likely you are to see a reversal in the stock's price in the near future. The PBM signal moving inside the center band (gold lines/blue fill)(6) indicates to you that this upward momentum has neutralized and an exit may be required as the stock’s price approaches the zero line. If you have a strong convection of this stock’s long term potential, then you can hold the stock as long as the Pass Band signal does not move below the zero line.
Stocks approaching the zero line, moving inside of the blue center band with gold boarders or tracking very near to the zero line indicate to traders that some action may be required by them to preserve capital in the near future. Short signals are exactly the opposite of the above description.
Over extended prices are signaled by green or red background flags and periods of consolidation are flagged with gold a background color.
Pass Band Multi is an excellent indicator for any class of equity, but as you can see from the example chart, it is also an excellent crypto trading indicator.
Access this Genie indicator for your Tradingview account, through our web site. (Links Below) This will provide you with additional educational information and reference articles, videos, input and setting options and trading strategies this indicator excels in.

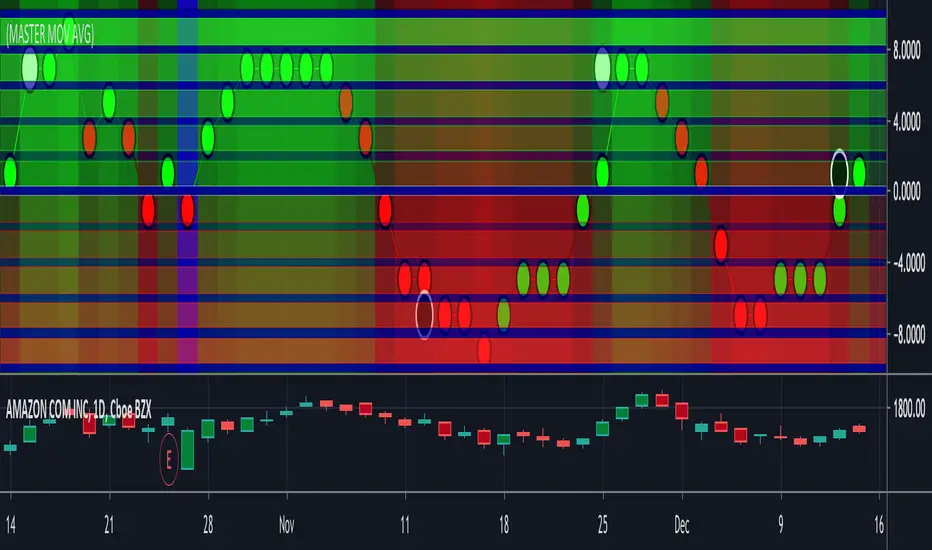
(11) Master Moving Average VS-168Moving Averages have been a staple of technical traders for a lot longer than computers have been available to accomplish the calculations. Luckily today we are able to easily produce very sophisticated, reactive moving averages using multiple algorithms designed by individuals with different backgrounds, talents and skill sets. The Master Moving Average Envelope calculates 9 distinct moving averages and then utilizes a knockout scoring system to produce a single combined score between -10 and +10. When we refer to a knockout scoring system, it simply means that if one of these indicators is positive and one is negative they cancel each other out. The majority of the survivors wins and that calculated total produces the MMAE dot's score and determines the dots location on the MMAE indicator chart.
The envelope refers to the area produced by multiple moving averages of different lengths. When you have a short time frame and a long time frame the two lines will contain between them, the majority of the candles. The area between these two lines is the, "envelope" and it allows us to stay in a trade during a pre-determined amount of volatility. This keeps us in trades when the stock might be experiencing short term counter trend trading action. As these two lines converge as the stocks price changes direction the envelope become smaller and smaller until it disappears briefly as the stock price changes direction. The center line of this indicator indicates a turning point in the price action where the envelope has become very small or nonexistence. Moving average are not reliable indicators as the envelop disappears and a crossover point nears. This indicator is most reliable when the stock price is not near the center demarcation line.
Access this Genie indicator for your Tradingview account, through our web site. (Links Below) This will provide you with additional educational information and reference articles, videos, input and setting options and trading strategies this indicator excels in.
GODMODE Hull MASimple hull ma trading script
B = buy / long
S = sell / short
Confirm on barclose
Band colors indicates the trend
Aqua = bullish channel
Red =bearish channel

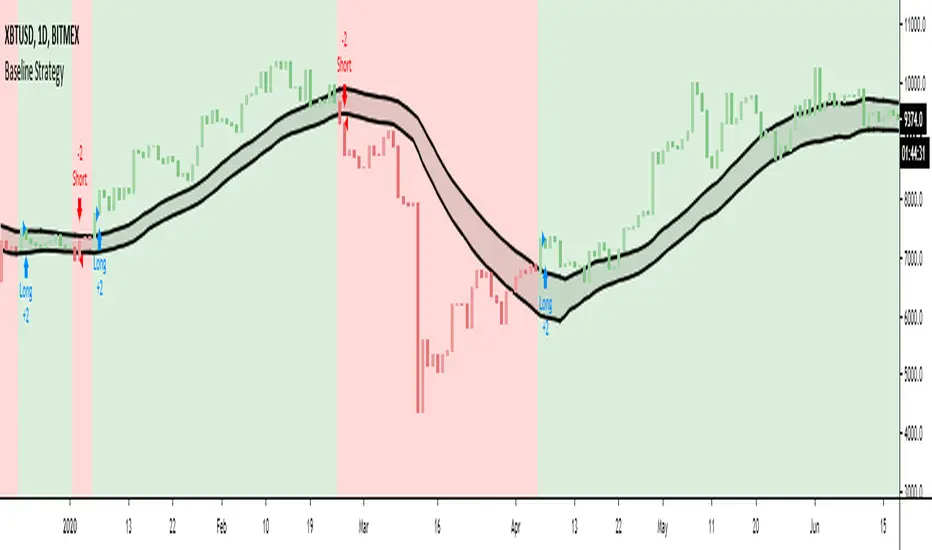
Hull SuiteHull is its extremely responsive and smooth moving average created by Alan Hull in 2005.
Minimal lag and smooth curves made HMA extremely popular TA tool.
alanhull.com
Script was made to regroup multiple hull variants in one indicator,maintaining flexible customization and intuitive visualization
Option to chose between 3 Hull variations
Option to chose between 2 visualization modes ( Bands or single line)
Option to Paint hull and/or candlesticks according to hulls trend
Shortcut for personalizing Line/band thickness,instead of changing every object manually ,there is global option in inputs
HMA
THMA ( 3HMA)
EHMA
HMA:
Alan Hull
EHMA:
Slower than hull by default.
Raudys, Aistis & Lenčiauskas, Vaidotas & Malčius, Edmundas. (2013). Moving Averages for Financial Data Smoothing ( 403. 34-45. 10.1007/978-3-642-41947-8_4.) Vilnius University, Faculty of Mathematics and Informatics
3HMA (THMA) :
Documentation on link below
alexgrover


CBG Rainbow Moving AveragesHere's my Rainbow Moving Average indicator. There are 41 MAs. I also have cross over signals based on 2 separate MAs. I like to use 20 ahd 50 Hull MAs for the signals but you can set those up independently.

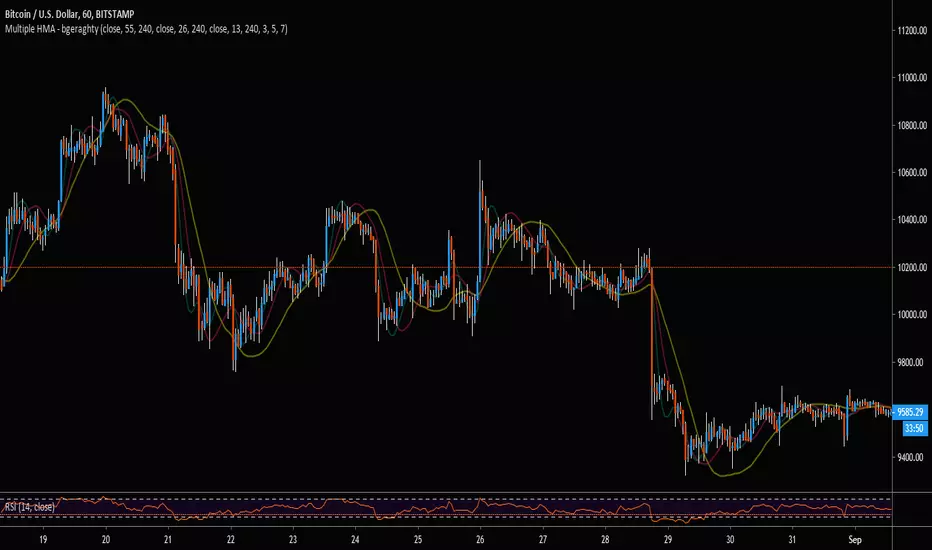
Multiple HMA - bgeraghtyTo save space on a chart's maximum indicator count, this single indicator includes:
- Three Hull Moving Averages, Defaulted to 13, 26, and 55 Periods.
- Customizable Time-Frame for Each HMA.
- Customizable Triple Weighted MA Smoothing for Jagged Lines from Higher Time-Frame
- Alert Conditions for Price Cross Over/Under the HMAs.
Double RSI StudyHere is the study version of our recent Double RSI strategy based on a Hull RSI and ALMA RSI.
The study version includes alerts for signals generated by both RSI's. It also includes an option to allow repeat signals, as well as tons of plotting options, etc.
If interested in a 3 day trial, feel free to send a message and check out our website ProfitProgrammers.com !

HMA ColoredThis is a typical hull moving average that is colored based on if the average is increasing or decreasing.
Exponential Hull MA Oscillator PrototypeClamped EHMA Oscillator Prototype with 21/200 EHMA with additional JMA smoothing (Credit: @everget)
Note: This is an experiment - this is not a polished indicator

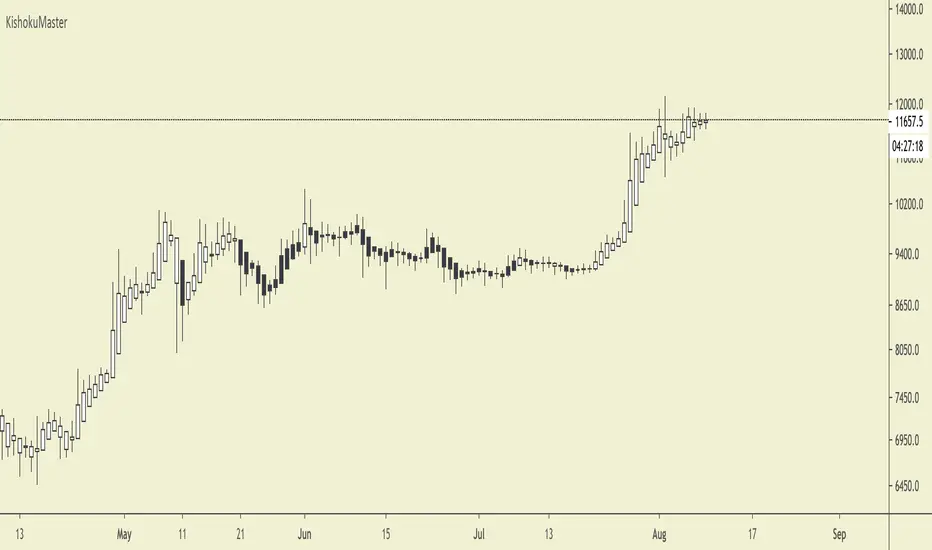
KishokuMasterKishokuMaster
KishokuMaster is a very simple indicator designed to provide an immediate representation of the ‘mood’ of the market. It provides an optimal balance of lag and smoothing to help traders establish a Bullish or Bearish bias. The underlying logic is based on Alan Hull's weighting techniques.
The indicator is optimised for weekly, daily and 4-hour candlesticks and can be used for all trending markets such as crypto, forex or stocks. It can be used as a standalone indicator, or to provide confluence when assessing TrendMaster entry opportunities.
Setting Up The Indicator
KishokuMaster can be used with either regular Japanese candlesticks or Heikin-Ashi candlesticks. Using Heikin-Ashi decreases the likelihood of whipsaw losses and provides a more stable visual representation of the trend. You can customise to any theme of your choice provided the candle borders and wicks are set to a uniform colour that contrasts the chart background.
Candle Colours
By default, KishokuMaster will colour your candles in black and white. White candles indicate an uptrend in an asset and the candles will not change colour until the trend has reversed. Black candles indicate a downtrend, they will remain black until a trend reversal occurs.
Our Story
Founded in 2018 by IchimokuScholar and C00kie, TrendMaster is a team that produces technical analysis indicators with an emphasis on simplicity and noise reduction. We support a large community with educational content, automated market scanners and mentoring in our private chat rooms. We produce technical analysis indicators geared primarily towards the emerging Cryptocurrency asset class. We provide educational material to assist trader development and host a large online trend following community. All of our products are designed to help traders distinguish relevant information from background noise. Our indicators encourage disciplined trade management to maximise the opportunity captured while minimising losses.
IchimokuScholar
IchimokuScholar – In 2017 I retired from a career in higher education to focus on Trading. I like to trade long term trends, focusing primarily on continuation setups. I am dedicated to sharing my knowledge of trading and take great pleasure in simplifying technical analysis for newer traders.
C00kie
I started trading crypto in 2017 and immediately started coding a bunch of tools to improve my quality of life. Some definitely worked out better than others. Like to trade the higher timeframes and drawing horizontal lines on charts. I am also pretty much obligated to like cookies.
Hull MAThis Hull MA uses the default settings of the built-in MA. The basic idea is that we are in a buy setup when hull is below price, and a sell setup when hull is above price. The indicator is extended with slightly change in contrast when moving average is declining and it plot the ma/price crossovers: green dot when a buy setup is appearing, and red dot when a sell setup is forming. It is possible to hide crossovers in the option panel.
Three alert conditions is added "Hull MA cross", "Hull MA sell" and "Hull MA buy". I use "Hull MA cross" on slow frames (2w, M) and "Hull MA buy/sell" on faster frames.

Multi SMA EMA WMA HMA BB (5x8 MAs Bollinger Bands) MAX MTF - RRBMulti SMA EMA WMA HMA 4x7 Moving Averages with Bollinger Bands MAX MTF by RagingRocketBull 2019
Version 1.0
All available MAX MTF versions are listed below (They are very similar and I don't want to publish them as separate indicators):
ver 1.0: 4x7 = 28 MTF MAs + 28 Levels + 3 BB = 59 < 64
ver 2.0: 5x6 = 30 MTF MAs + 30 Levels + 3 BB = 63 < 64
ver 3.0: 3x10 = 30 MTF MAs + 30 Levels + 3 BB = 63 < 64
ver 4.0: 5(4+1)x8 = 8 CurTF MAs + 32 MTF MAs + 20 Levels + 3 BB = 63 < 64
ver 5.0: 6(5+1)x6 = 6 CurTF MAs + 30 MTF MAs + 24 Levels + 3 BB = 63 < 64
ver 6.0: 4(3+1)x10 = 10 CurTF MAs + 30 MTF MAs + 20 Levels + 3 BB = 63 < 64
Fib numbers: 8, 13, 21, 34, 55, 89, 144, 233, 377
This indicator shows multiple MAs of any type SMA EMA WMA HMA etc with BB and MTF support, can show MAs as dynamically moving levels.
There are 4 MA groups + 1 BB group, a total of 4 TFs * 7 MAs = 28 MAs. You can assign any type/timeframe combo to a group, for example:
- EMAs 9,12,26,50,100,200,400 x H1, H4, D1, W1 (4 TFs x 7 MAs x 1 type)
- EMAs 8,13,21,30,34,50,55,89,100,144,200,233,377,400 x M15, H1 (2 TFs x 14 MAs x 1 type)
- D1 EMAs and SMAs 8,13,21,30,34,50,55,89,100,144,200,233,377,400 (1 TF x 14 MAs x 2 types)
- H1 WMAs 13,21,34,55,89,144,233; H4 HMAs 9,12,26,50,100,200,400; D1 EMAs 12,26,89,144,169,233,377; W1 SMAs 9,12,26,50,100,200,400 (4 TFs x 7 MAs x 4 types)
- +1 extra MA type/timeframe for BB
There are several versions: Simple, MTF, Pro MTF, Advanced MTF, MAX MTF and Ultimate MTF. This is the MAX MTF version. The Differences are listed below. All versions have BB
- Simple: you have 2 groups of MAs that can be assigned any type (5+5)
- MTF: +2 custom Timeframes for each group (2x5 MTF) +1 TF for BB, TF XY smoothing
- Pro MTF: 4 custom Timeframes for each group (4x3 MTF), 1 TF for BB, MA levels and show max bars back options
- Advanced MTF: +4 extra MAs/group (4x7 MTF), custom Ticker/Symbols, Timeframe <>= filter, Remove Duplicates Option
- MAX MTF: +2 subtypes/group, packed to the limit with max possible MAs/TFs: 4x7, 5x6, 3x10, 4(3+1)x10, 5(4+1)x8, 6(5+1)x6
- Ultimate MTF: +individual settings for each MA, custom Ticker/Symbols
MAX MTF version tests the limits of Pinescript trying to squeeze as many MAs/TFs as possible into a single indicator.
It's basically a maxed out Advanced version with subtypes allowing for mixed types within a group (i.e. both emas and smas in a single group/TF)
Pinescript has the following limits:
- max 40 security calls (6 calls are reserved for dupe checks and smoothing, 2 are used for BB, so only 32 calls are available)
- max 64 plot outputs (BB uses 3 outputs, so only 61 plot outputs are available)
- max 50000 (50kb) size of the compiled code
Based on those limits, you can only have the following MAs/TFs combos in a single script:
1. 4x7, 5x6, 3x10 - total number of MTF MAs must always be <= 32, and you can still have BB and Num Levels = total MAs, without any compromises
2. 5(4+1)x8, 6(5+1)x6, 4(3+1)x10 - you can use the Current Symbol/Timeframe as an extra (+1) fixed TF with the same number of MTF MAs
- you don't need to call security to display MAs on the Current Symbol/Timeframe, so the total number of MTF MAs remains the same and is still <= 32
- to fit that many MAs into the max 64 plot outputs limit you need to reduce the number of levels (not every MA Group will have corresponding levels)
Features:
- 4x7 = 28 MAs of any type
- 4x MTF groups with XY step line smoothing
- +1 extra TF/type for BB MAs
- 2 MA subtypes within each group/TF
- 4x7 = 28 MA levels with adjustable group offsets, indents and shift
- supports any existing type of MA: SMA, EMA, WMA, Hull Moving Average (HMA)
- custom tickers/symbols for each group
- show max bars back option
- show/hide both groups of MAs/levels/BB and individual MAs
- timeframe filter: show only MAs/Levels with TFs <>= Current TF
- hide MAs/Levels with duplicate TFs
- support for custom TFs that are not available in free accounts: 2D, 3D etc
- support for timeframes in H: H, 2H, 4H etc
Notes:
- Uses timeframe textbox instead of input resolution dropdown to allow for 240 120 and other custom TFs
- Uses symbol textbox instead of input symbol to avoid establishing multiple dummy security connections to the current ticker - otherwise empty symbols will prevent script from running
- Possible reasons for missing MAs on a chart:
- there may not be enough bars in history to start plotting it. For example, W1 EMA200 needs at least 200 bars on a weekly chart.
- for charts with low/fractional prices i.e. 0.00002 << 0.001 (default Y smoothing step) decrease Y smoothing as needed (set Y = 0.0000001) or disable it completely (set X,Y to 0,0)
- for charts with high price values i.e. 20000 >> 0.001 increase Y smoothing as needed (set Y = 10-20). Higher values exceeding MAs point density will cause it to disappear as there will be no points to plot. Different TFs may require diff adjustments
- TradingView Replay Mode UI and Pinescript security calls are limited to TFs >= D (D,2D,W,MN...) for free accounts
- attempting to plot any TF < D1 in Replay Mode will only result in straight lines, but all TFs will work properly in history and real-time modes. This is not a bug.
- Max Bars Back (num_bars) is limited to 5000 for free accounts (10000 for paid), will show error when exceeded. To plot on all available history set to 0 (default)
- Slow load/redraw times. This indicator becomes slower, its UI less responsive when:
- Pinescript Node.js graphics library is too slow and inefficient at plotting bars/objects in a browser window. Code optimization doesn't help much - the graphics engine is the main reason for general slowness.
- the chart has a long history (10000+ bars) in a browser's cache (you have scrolled back a couple of screens in a max zoom mode).
- Reload the page/Load a fresh chart and then apply the indicator or
- Switch to another Timeframe (old TF history will still remain in cache and that TF will be slow)
- in max possible zoom mode around 4500 bars can fit on 1 screen - this also slows down responsiveness. Reset Zoom level
- initial load and redraw times after a param change in UI also depend on TF. For example: D1/W1 - 2 sec, H1/H4 - 5-6 sec, M30 - 10 sec, M15/M5 - 4 sec, M1 - 5 sec. M30 usually has the longest history (up to 16000 bars) and W1 - the shortest (1000 bars).
- when indicator uses more MAs (plots) and timeframes it will redraw slower. Seems that up to 5 Timeframes is acceptable, but 6+ Timeframes can become very slow.
- show_last=last_bars plot limit doesn't affect load/redraw times, so it was removed from MA plot
- Max Bars Back (num_bars) default/custom set UI value doesn't seem to affect load/redraw times
- In max zoom mode all dynamic levels disappear (they behave like text)
- Dupe check includes symbol: symbol, tf, both subtypes - all must match for a duplicate group
- For the dupe check to work correctly a custom symbol must always include an exchange prefix. BB is not checked for dupes
Good Luck! Feel free to learn from/reuse the code to build your own indicators.

Exponential Hull Moving Average (EHMA)Source for Exponential Hull Moving Average (EHMA) formula:
Raudys, Aistis & Lenčiauskas, Vaidotas & Malčius, Edmundas. (2013). Moving Averages for Financial Data Smoothing. Communications in Computer and Information Science. 403. 34-45. 10.1007/978-3-642-41947-8_4.
The Exponential Hull Moving Average is nearly identical to the Hull MA, but EMA used instead of WMA.
Credit to @RicardoSantos for the existing implementation of the Hull Moving Average in pinescript:

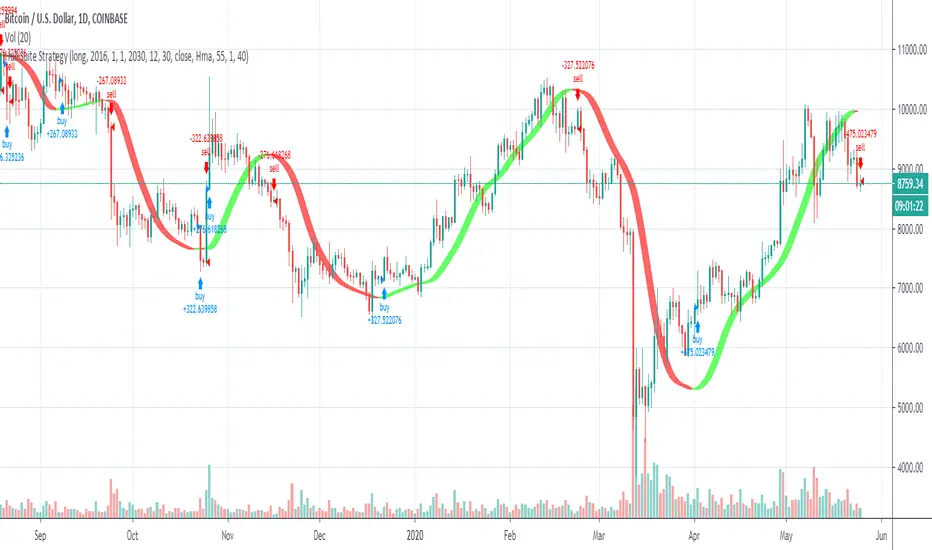
A Hull moving average pimpedHi all,
this is a great indicator that can give great signal for entry and exit.This is based on Hull moving averages.
When there is an up trend the indicator become green and when there is a down trend become red.
This indicator combined with other indicator can give a great performing strategy.
No public requests or donations for access to this script will be granted. No exceptions.
NOTICE: By requesting access to this script you acknowledge that you have read and understood that this is for research purposes only and neither I or Gunthy are responsible for any financial losses you may incur by using this script!

Multi SMA EMA WMA HMA BB (4x5 MAs Bollinger Bands) Adv MTF - RRBMulti SMA EMA WMA HMA 4x5 Moving Averages with Bollinger Bands Advanced MTF by RagingRocketBull 2019
Version 1.0
This indicator shows multiple MAs of any type SMA EMA WMA HMA etc with BB and MTF support, can show MAs as dynamically moving levels.
There are 4 MA groups + 1 BB group, a total of 4 TFs * 5 MAs = 20 MAs. You can assign any type/timeframe combo to a group, for example:
- EMAs 12,26,50,100,200 x H1, H4, D1, W1 (4 TFs x 5 MAs x 1 type)
- EMAs 8,10,13,21,30,50,55,100,200,400 x M15, H1 (2 TFs x 10 MAs x 1 type)
- D1 EMAs and SMAs 8,10,12,26,30,50,55,100,200,400 (1 TF x 10 MAs x 2 types)
- H1 WMAs 7,77,89,167,231; H4 HMAs 12,26,50,100,200; D1 EMAs 89,144,169,233,377; W1 SMAs 12,26,50,100,200 (4 TFs x 5 MAs x 4 types)
- +1 extra MA type/timeframe for BB
There are several versions: Simple, MTF, Pro MTF, Advanced MTF and Ultimate MTF. This is the Advanced MTF version. The Differences are listed below. All versions have BB
- Simple: you have 2 groups of MAs that can be assigned any type (5+5)
- MTF: +2 custom Timeframes for each group (2x5 MTF) +1 TF for BB, TF XY smoothing
- Pro MTF: 4 custom Timeframes for each group (4x3 MTF), 1 TF for BB, MA levels and show max bars back options
- Advanced MTF: +2 extra MAs/group (4x5 MTF), custom Ticker/Symbols, Timeframe <>= filter, Remove Duplicates Option
- Ultimate MTF: +individual settings for each MA, custom Ticker/Symbols
Features:
- 4x5 = 20 MAs of any type
- 4x MTF groups with XY step line smoothing
- +1 extra TF/type for BB MAs
- 4x5 = 20 MA levels with adjustable group offsets, indents and shift
- supports any existing type of MA: SMA, EMA, WMA, Hull Moving Average (HMA)
- custom tickers/symbols for each group - you can compare MAs of the same symbol across exchanges
- show max bars back option
- show/hide both groups of MAs/levels/BB and individual MAs
- timeframe filter: show only MAs/Levels with TFs <>= Current TF
- hide MAs/Levels with duplicate TFs
- support for custom TFs that are not available in free accounts: 2D, 3D etc
- support for timeframes in H: H, 2H, 4H etc
Notes:
- Uses timeframe textbox instead of input resolution dropdown to allow for 240 120 and other custom TFs
- Uses symbol textbox instead of input symbol to avoid establishing multiple dummy security connections to the current ticker - otherwise empty symbols will prevent script from running
- Possible reasons for missing MAs on a chart:
- there may not be enough bars in history to start plotting it. For example, W1 EMA200 needs at least 200 bars on a weekly chart.
- price << default Y smoothing step 5. For charts with low/fractional prices (i.e. 0.00002 << 5) adjust X Y smoothing as needed (set Y = 0.0000001) or disable it completely (set X,Y to 0,0)
- TradingView Replay Mode UI and Pinescript security calls are limited to TFs >= D (D,2D,W,MN...) for free accounts
- attempting to plot any TF < D1 in Replay Mode will only result in straight lines, but all TFs will work properly in history and real-time modes. This is not a bug.
- Max Bars Back (num_bars) is limited to 5000 for free accounts (10000 for paid), will show error when exceeded. To plot on all available history set to 0 (default)
- Slow load/redraw times. This indicator becomes slower, its UI less responsive when:
- Pinescript Node.js graphics library is too slow and inefficient at plotting bars/objects in a browser window. Code optimization doesn't help much - the graphics engine is the main reason for general slowness.
- the chart has a long history (10000+ bars) in a browser's cache (you have scrolled back a couple of screens in a max zoom mode).
- Reload the page/Load a fresh chart and then apply the indicator or
- Switch to another Timeframe (old TF history will still remain in cache and that TF will be slow)
- in max possible zoom mode around 4500 bars can fit on 1 screen - this also slows down responsiveness. Reset Zoom level
- initial load and redraw times after a param change in UI also depend on TF. For example:
D1/W1 - 2 sec, H1/H4 - 5-6 sec, M30 - 10 sec, M15/M5 - 4 sec, M1 - 5 sec.
M30 usually has the longest history (up to 16000 bars) and W1 - the shortest (1000 bars).
- when indicator uses more MAs (plots) and timeframes it will redraw slower. Seems that up to 5 Timeframes is acceptable, but 6+ Timeframes can become very slow.
- show_last=last_bars plot limit doesn't affect load/redraw times, so it was removed from MA plot
- Max Bars Back (num_bars) default/custom set UI value doesn't seem to affect load/redraw times
- In max zoom mode all dynamic levels disappear (they behave like text)
1. based on 3EmaBB, uses plot*, barssince and security functions
2. you can't set certain constants from input due to Pinescript limitations - change the code as needed, recompile and use as a private version
3. Levels = trackprice implementation
4. Show Max Bars Back = show_last implementation
5. swma has a fixed length = 4, alma and linreg have additional offset and smoothing params
6. Smoothing is applied by default for visual aesthetics on MTF. To use exact ma mtf values (lines with stair stepping) - disable it
Good Luck! You can explore, modify/reuse the code to build your own indicators.

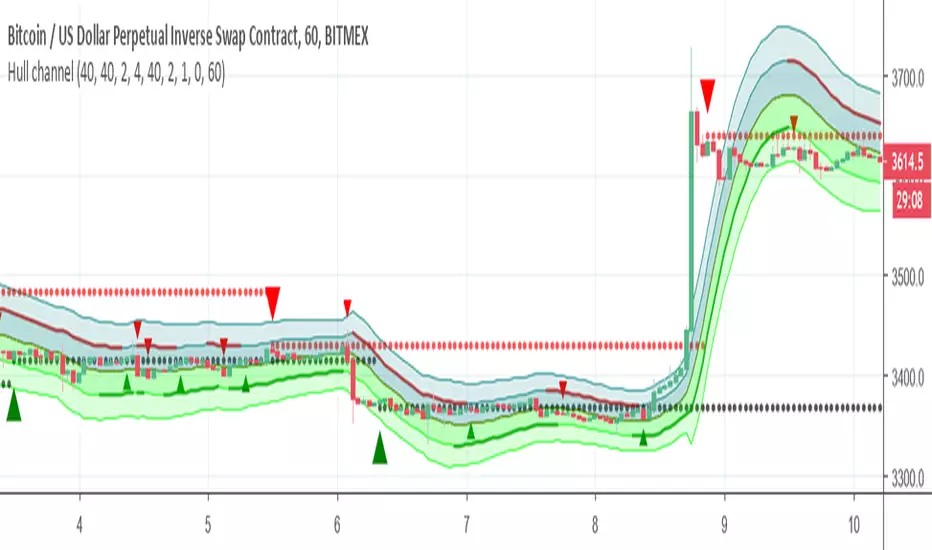
Hull channelThis Hull based channel , the resistance and the support based on Hull which also can be calculated as signal (big triangle) and represent by circles (red and black)
the channel has bands that are based on ATR and std (2 or 4) you can change as you like
The small arrow in green and red are the slope calculation (this also has signal and alerts)
there is bullish and bearish zone that you can highlight to see where you are according to slope
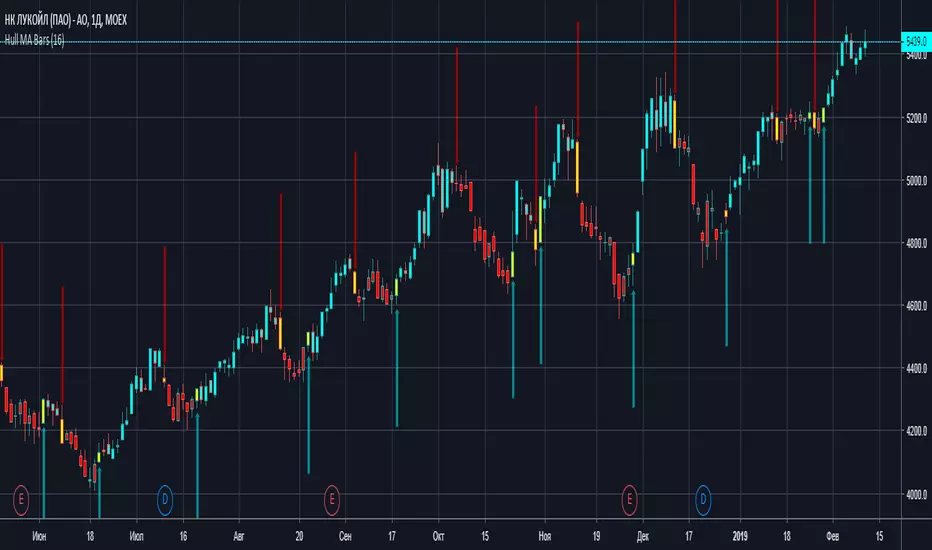
Hull MA BarsThis indicator fill bars with color of HullMA + warning yellow bars, then trend reversing