Ichimoku Cross Indicator [Mehdihz]This script shows tenken & kijen lines position to better detection of crosses.
Ichimoku Cloud

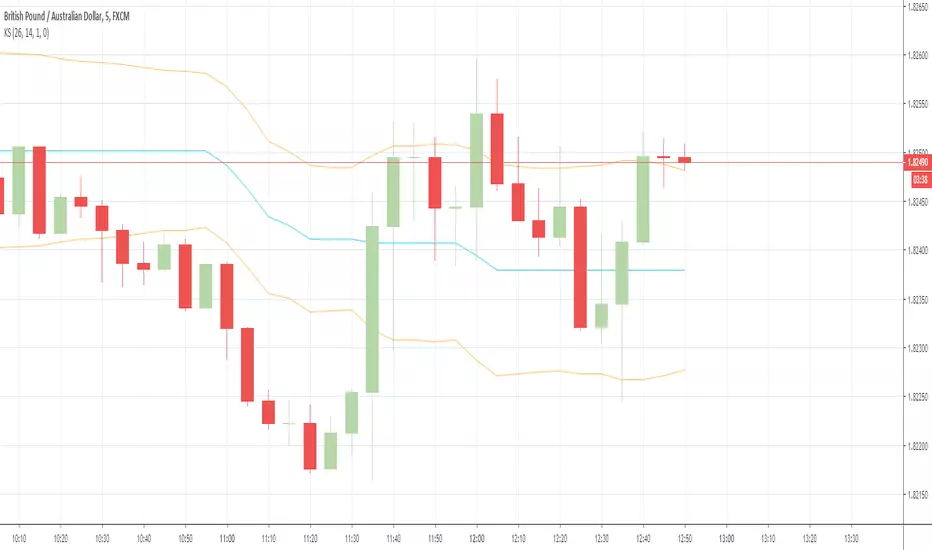
[M10] Ichimoku Keltner Channel Scalper [Alerts]Hey all,
This script combines a couple of popular indicators to create a reliable yet versatile opportunity to automate trades based on the Ichimoku Cloud. The idea is to use bullish/bearish Ichimoku crossovers to enter positions whilst taking advantage of a modified Keltner Channel to exit these positions at maximum profit.
The script has been backtested on various timeframes and proves effective in both trending and ranging markets.
I have also added the ability to limit your positions to only long, or short, if this is of preference.
Want to backtest this? A strategy version of this script is also available at no cost on my page - enjoy!
Any questions? Let me know!

Ichimoku Cloud setup OualidIchimoku Cloud setup Oualid
plus sûr dans les trades
Mieux addapté non agressif

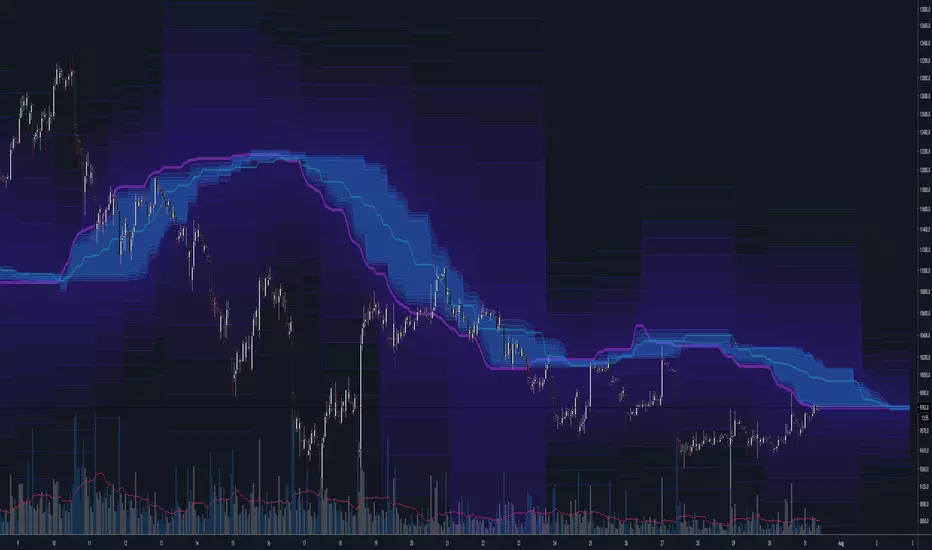
The Rumpy CloudSimilar basic principle to Ichimoku cloud, more sophisticated implementation.
I've exposed cloud width multipliers in the setting in case anyone wants to experiment with them, there are likely to be other widths of significance.
Lots of lines so settings includes easy batch way of altering color settings.
--------------------------------------
If you find it useful please consider a tip/donation :
BTC - 3BMEXEDyWJ58eXUEALYPadbn1wwWKmf6sA
--------------------------------------
Tenkan Kijun Cross AlertTenkan Kijun cross alert, best used alongside a Volume indicator to help aid with finding those trend continuation patterns.
I prefer to use the Chaikin Money Flow, when it indicates and holds above the 0 line then you will bias Longs, and when below then you will Bias shorts
If you like this then please donate
BTC: 1LRbUgrkvFLQ5Mt7C62EJRD9aMvhDNT22K
ETH: 0xa509b89bccb788234278eFE63470c10946E26F3c
LTC: LV7MUr6arvCffS5N6pbTWgav5S3Yi1Eejp

Skipz multi-indicatorMaking my own indicator pack based on several indicators used by my mentors.
Would love feedback

Bollinger bands/Lagging span crossHello my dear ambitious traders
I'm working hard this week to publish some great indicators this week and open sourced. Hope you'll enjoy, learn and use them.
This will be my greatest reward but comments showing appreciation are also very welcomed (actually likes too) :)
For today, I'll share a simple indicator but it's coming along with some insightful knowledge ^^
Anyway, I'm not here to ask you to this but to share a very cool indicator I made a few months ago and wanted to share for FREE with the community today
The indicator is related to this educational post : What-a-Bollinger-Bands-Lagging-span-cross-can-tell-us/
This trading technique was invented by Robbytrade, a famous french trader twitter.com
I wanted to have those visual signals on the chart so I coded it.
The advantage of being a developer is that you can litteraly code what you miss and get your life better in the process. The one that will find a way to code a new form of money will be rich... wait.... that guy is called Satoshi Nakamoto...
That's all for me today my friends
PS
Trying to update the Trade Manager shared yesterday with some cool features. More to come in the upcoming days
Enjoy
Dave

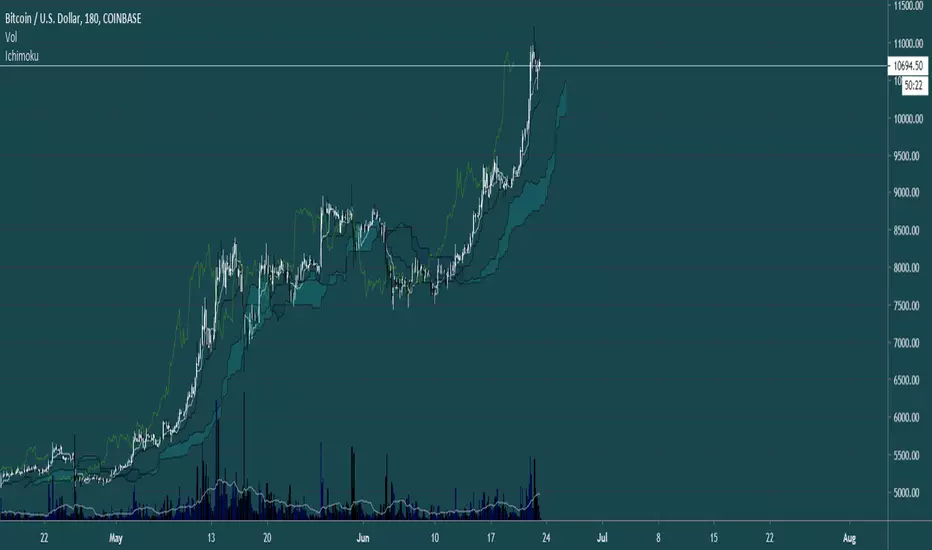
Ichimoku Compass(Ichimoku Cloud)Ichimoku Cloud Indicator for visualizing support/resistance levels. Candles turn from green to white when negative trend is detected.

The Mango Ribbon The Mango Ribbon is a convenience indicator which encompasses a combination of moving averages combining those of exponential and Ichimoku averages. I will be updating this indicator with more features as time passes.
Hope you enjoy. For access, simply pm me on Telegram (porco1x) or use the sign up form at mangoresearch.co

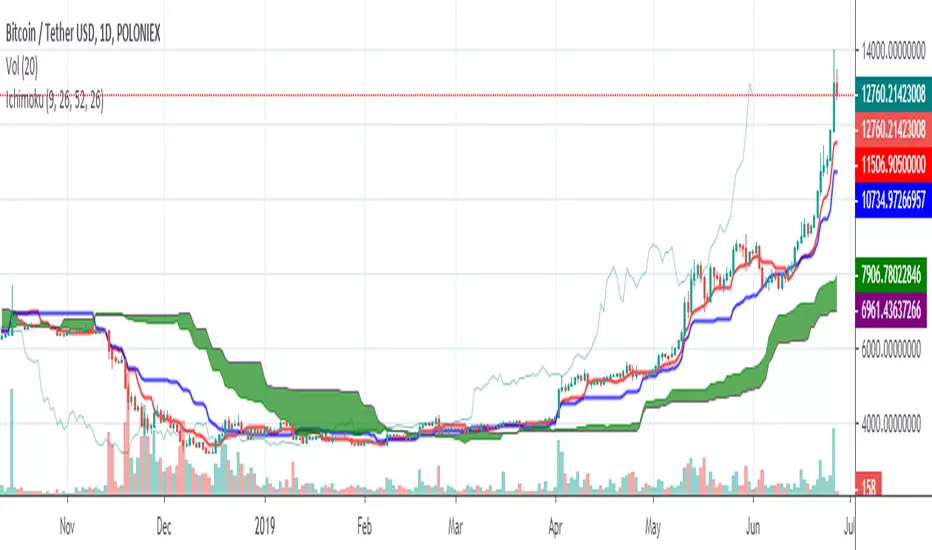
Volume Weighted Ichimoku (Cleaned Up Visuals)Ichimoku with cleaned up appearance on chart and volume-weighted highs / lows. Publishing this final version with open script.

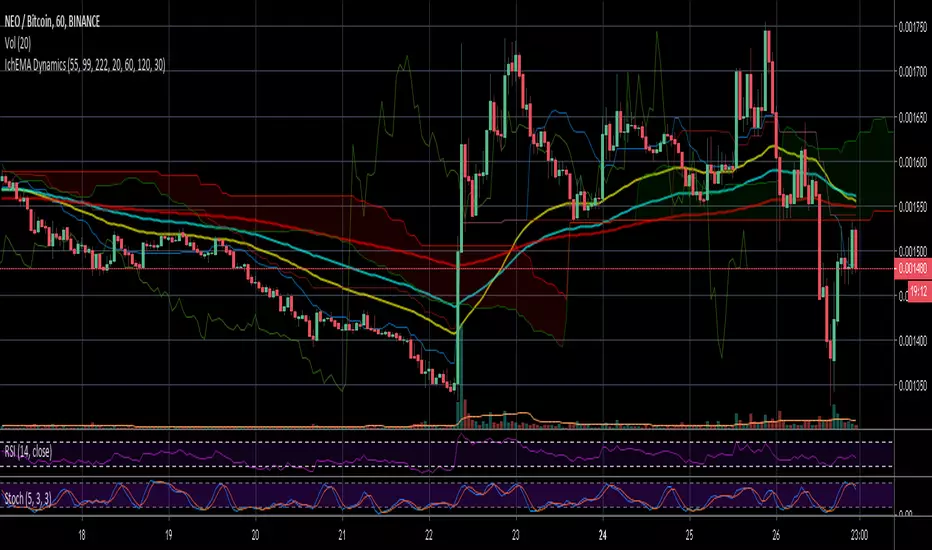
IchEMA Dynamics w/ EMAs and Cloud (for Darth Crypto's TFC Group)This indicator has the EMAs and Ichimoku cloud that make up my IchEMA Dynamic Supports. One of our members is experienced in making scripts, and was working on a much more complex solution that includes indicator functions as well! For now, this will give you my exact indicators for IchEMA dynamic supports. This indicator will automatically use my settings as the default settings.
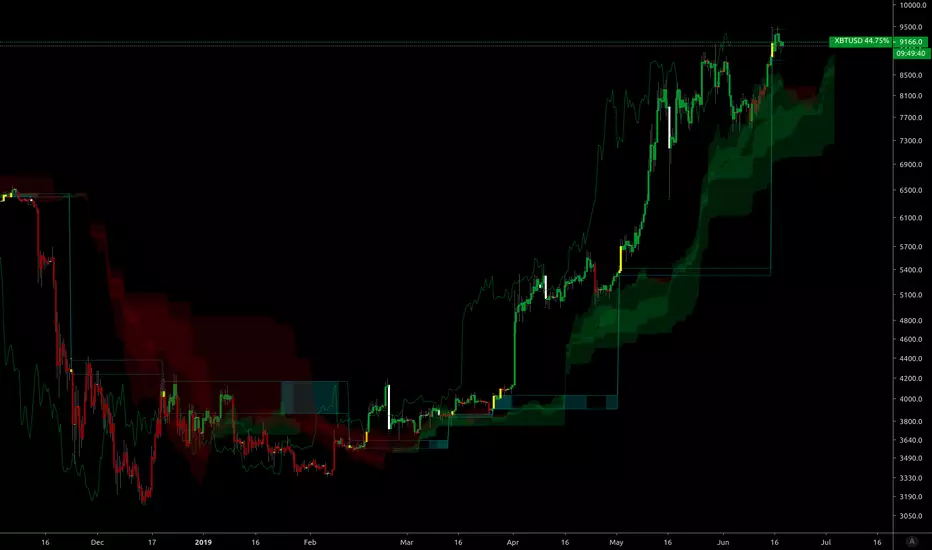
HTF IchimokuThis Indicator makes trading with ichimoku on different timeframes alot easier and more intuitive. It colors bars according to ichimoku trend and plots Kumo Breakouts and tk crosses.
tips are always welcome at: 38uGQJDDZDL6wX48x4gYTccPeQ3ZHVYmY4 ( btc )
Happy tradings :)
Crypto4Fun Gunbot Script #1This script provides a trigger for Gunbot (or any other bot) combining different indicators on 2 timeframes as follows :
1) on the timeframe of the chart : ichimoku and SMA-spread
2) on the higher timeframe : DI+ and DI- ==> you can select your preferred higher timeframe, preferrably higher than the timeframe of the current chart
All parameters are configurable
Workinstructions :
Add the script to your chart
Move the shown indicator to a window below
Set the email alert as follows : 'plot' value crosses over 95
Feedback and suggestions are welcome

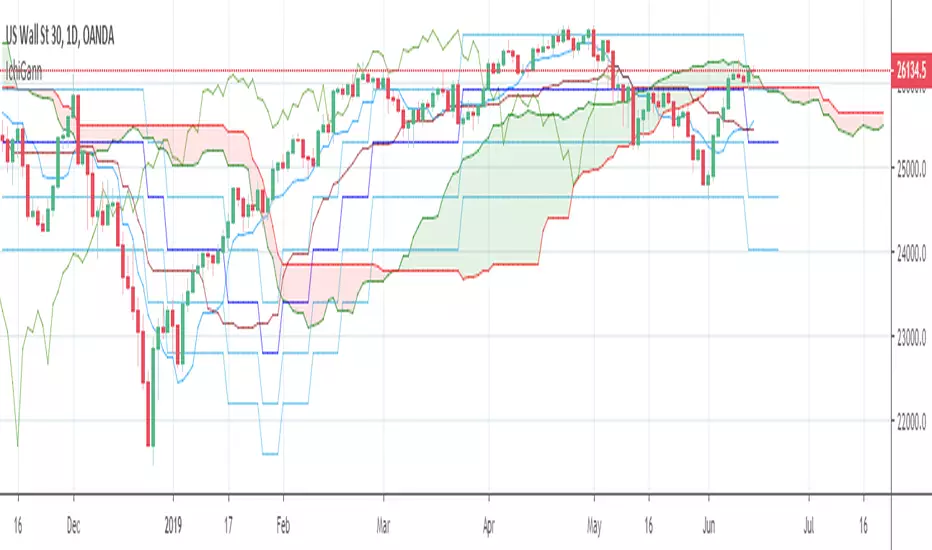
Ichmoku + GannThe script combines Ichimoku Clouds with Gann levels. Kijunsen is used as basis of calculation of 4 Gann levels above and below it. By default Gann Leves at 360 degrees are plotted but one can choose the desired degrees separation.
Kijun-sen Colored [aamonkey]I isolated the Kijun-sen from the Ichimoku Cloud and colored it.
You can do major damage by just entering when the price closes above the Kijun-sen and sell when it is the other way around.
Add some other confirmation indicators to filter some false breakouts and you are good to go.

Ichimoku Cloud signalswith this indicator you will get buy and sell signals with 7 different strategies by Ichimoku clouds

Bohyun's favorite composition by Theo ParkThis indicator contains
8 MA
1 Fibonacci Bollinger Bands
3 Bollinger Bands
2 Ichimokus

Ichimoku Cloud & TK FuturesThis is vanilla Ichimoku Cloud with a little extra.
This script offers a future insight into where the Tenkan-Sen and Kijun-Sen will be plotted to in the future.
Enable up to 6 future plot points for the Tenkan-Sen
Enable up to 12 future plot points for the Kijun-Sen
*NOTE* - If a new high or low is created, this will alter future plot points.
The TK Futures were developed with help from gyro . Thank you.
I adapted the Ichimoku Cloud script that was originally created by ChrisMoody . (CM Enhanced Ichimoku Cloud V5) Thank you.
