[DisDev] Level by LevelThis indicator's main objective is to provide you with the ability to chose the levels you are interested in , with the added functions of:
Level-by-Level Chart Reducer – This allows you to choose how many levels are above and below the current closing price to display.
Level-by-Level Table – This allows you to display all the levels within a table onto the chart.
The basis of this indicator is to provide you with a toolbox of levels that you can add to your trading plans.
Psychological Levels
A weekly range established each Saturday evening that can be thought of as a weekly "IB" or initial balance.
Average Daily Range ("ADR") & Average Weekly Range ("AWR")
In Forex, the International Monetary Fund ("IMF") controls the allowable weekly swings of a currency's price. The "AWR" and "ADR" perform calculations and dynamically adjust until the range is exceeded, at which time the levels will lock into place for the remainder of the day or week. The accepted theory is that price (even in Stocks and Crypto) will adhere to and remain within these levels, and, if exceeded, will revert back to them.
Initial Balance ("IB")
In Crypto trading, it is generally accepted that the High and Low of the first hour of each day (00:00 - 01:00 UTC) is the Initial Balance . The IB generally thought of as a zone that sets the tone for the rest of the trading session. It is often a time of high volume and volatility, with Stop Hunts at the highs and lows of a range before price moves in one direction or the other. The IB is a Market Profile concept introduced by Peter Steidlmayer. There is plenty of information on the Internet to learn more about IB's and how to implement them -- please do your own research.
Daily Open
Since Crypto is traded 24 hours per day, the generally accepted open is 00:00 UTC, the Tokyo open. Please refer to Part 1 for more details on sessions, starting times, conversions, and Daylight Savings Time.
Volume Weighted Average Price (VWAP's)
VWAPs are important areas on a chart. Institutional traders generally do not want to move price too far as they enter large buy or sell orders. So they wait for price to reach a tight zone around the VWAP where the majority of transactions occur on the Daily, Weekly, or Monthly timeframes. In these areas, there will be plenty of supply and demand for the institutional trader to execute their trades.
Weekly Open
The weekly open is Monday at 00:00 UTC.
Pivot Points (Support & Resistance)
This indicator calculates pivot levels based on a tested formula that calculates past and subsequent bars or candles. It displays the two closest to price pivot levels. The pivot formula takes a window of left bars and right bars, and then finds the highest or lowest value in that window. The window marches across the bar-set to discover the pivots.
We coded the script to label the levels and colors dynamically, either Support (Green) or Resistance (Red), depending on whether they are above or below price. The primary level line stays with the same color scheme:
Blue = Daily / Yellow = Weekly / Violet = Monthly
As price crosses the level:
1 - The label will switch from Support to Resistance and Resistance to Support
2 - The extender line will switch from Green to Red and Red to Green
3 - The same changes will take place in the Level-by-Level Coordinates Table
A Note on Levels and Data
Understanding How Data is Calculated and Presented
Calculating levels requires going back in time through a symbol or asset’s historical data. Time is measured by bars (candles), so depending on the chart's resolution (timeframe or TF) you are viewing, a different number of bars would be required to measure the same level.
For example, if we want to mark the Daily High and Low on the daily TF, we would be measuring 1 bar or candle. If we drop down to the 1-hour TF, we would need to measure 24 bars. For the 15-Minute TF it would be 96 bars (1hr/15min=4 bars per/hour and 4 x 24 = 96), and on the 1-Min TF, it requires 1,440 bars (1hr=60 Min and 6 x 24 = 1,440).
Hopefully, you get the idea and can see that the number of bars required increases exponentially as we move to weekly, monthly, and yearly levels.
TradingView Data
Please note this statement from TradingView's website:
"The length of historical data for any intraday interval (i.e. chart timeframe) is 5,000 bars/candles (for Pro and Pro+ account holders it is doubled to 10,000 bars/candles and for Premium holders it's quadrupled to 20,000) + additionally several bars/candles back to the beginning of the week, month or year (depending on the resolution). Unfortunately, this limit cannot be extended for now due to technical reasons. At lower resolutions (<30Min) Yearly and Monthly VWAPs may not show, but to overcome this issue the “Plot Save” function has been added to the settings to allow the user to manually input these levels. This concept is the same for Daily, Weekly, and Monthly pivots.
If you change the chart interval to daily or daily-based, you will see a longer date range. We display all available data for daily-based intervals."
How we Handled Data Limitations
The Plot Level Feature in the Level by Level Indicator
We have written this script to always show levels at the lowest time frame allowable by TradingView.
If you do not see specific Support or Resistance levels, switch to a higher time frame, enter the corresponding values in the provided fields on the input panel, and check the Plot box. This will hard code the level in and will print on any TF. Additionally, we coded it so that when the Plot feature is enacted, the calculated level will be disabled so that there are no overlaps of two levels being printed.
Legend
The logic behind the line styles:
Solid = Static or established
Dashed = Static but previous week or day
Dotted = Dynamic or still developing -- will turn solid once the values are locked in
*VWAPs would technically be a dotted line since they are fluid, however, TV does not handle the dots or dashes of a curved line well so we chose to keep this solid
Level-by-Level Table
We designed this table to provide the user with a view of the levels in the correct price sequence on the chart at all times since, depending on the resolution and zoom levels, it would typically not be possible. The levels are equidistant and do not align with the actual price.
The current price will move vertically through the table according to the actual price and its relative position to the other various levels. The levels will change price and line styles dynamically as well.
The current price rectangle and the border can be in sync with High Volume Candle colors to draw more attention to the chart during climatic volume events.
Settings & Options - Levels & Labels
Levels will show a faint line through price to the point of origin.
Labels will show a brighter line extended to the right of price.
The values (10, 20, 30) are the length of the extensions; they are staggered to avoid overlaps.
Settings & Options - Level Reducer
The Level Reducer gives you the ability to declutter your chart, but still have the indicator track all the selected levels.
With four Lines selected, for example, the indicator will give you the nearest four lines above price and the nearest four below price. The Table runs independently of the chart, so if you want to see eight levels as an example, the Table will show eight above and eight below price.
As the current price changes, the lines will dynamically change accordingly.
Initialbalance

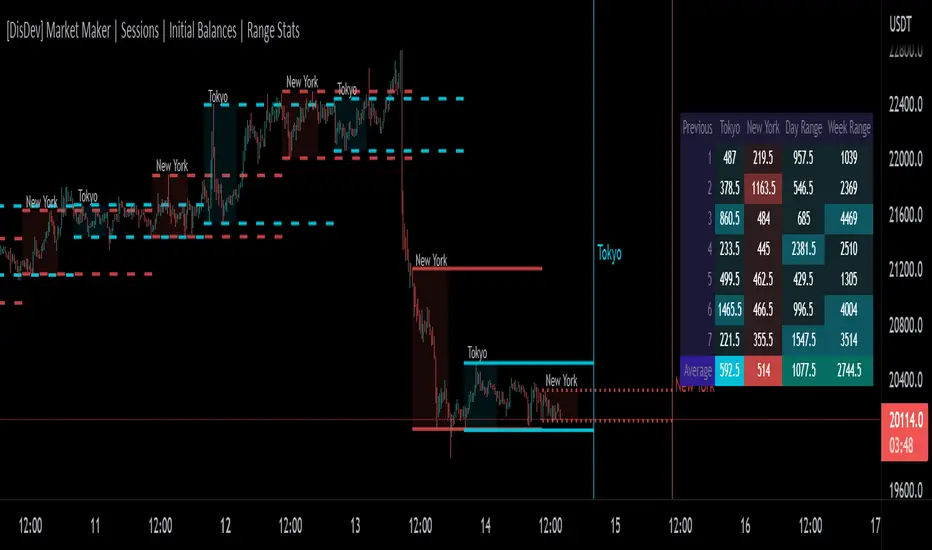
[DisDev] Market Maker | Sessions | Initial Balance | Range StatsThis indicator has two main components: Time-Specific Sessions and High/Low Statistics . There are also several subcomponents: Day of Week Separators, Specific Session High/Low Extenders, Day Range Statistics, Week Range Statistics, User Input Session Titles, etc.
Each component is explained and demonstrated how it could be utilized as a trading tool.
The basis of this indicator is to analyze session-specific price movements through automatic display and statistics.
Key:
Dotted lines = Developing Session
Solid Line = Session complete
Dashed lines = Past Session
1) The primary function is the five manual time-session inputs. These sessions could be based on a full market period, such as London Open to Close (0800 UTC to 1630 UTC), the Initial Balance of the day (0000 UTC to 0100 UTC), or a session Initial Balance New York (1430 UTC to 1530 UTC). The user can update settings input text to reflect this on the chart.
The following shows the example noted above, with the added subcomponents of:
• Shaded areas to define each session
• Extension of the Sessions highs and lows (extension 24/48/72-hour options)
• Future line projection (provides a reminder of when the market opens)
This allows you to see potential levels of resistance and support and market open volatility.
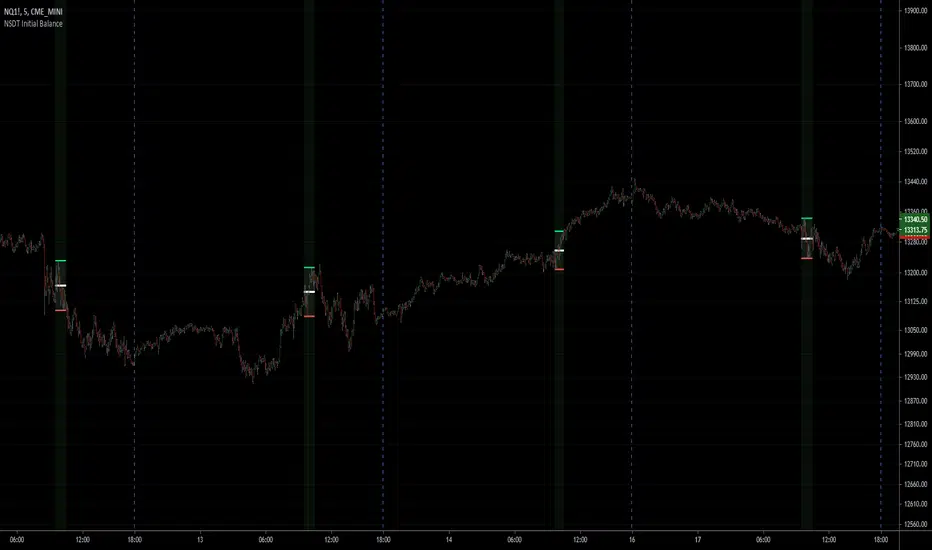
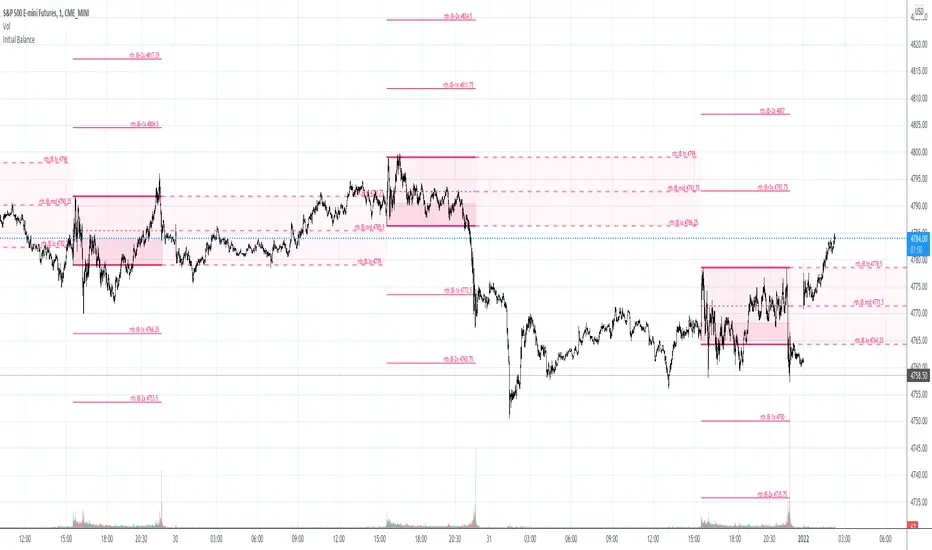
The below example shows the input sessions configured for five Session Initial Balances. You can see that the Sessions Initial Balances were in a tight price range. A range breakout occurred with price move of $1400 visualized.
2) The secondary function is the Range statistics. Range statistics can be used to track the volatility of each session, day or week and can be selected for up to 31 days. This helps the user to determine overbought or oversold conditions as well as pattern recognition.
Trade Example 1
Settings: New York Session Open to Session Close.
The colored boxes are manually drawn to emphasize how the New York Lows and Highs can act as a confluence for support and resistance areas.
Trade Example 2a
Settings: London Session Open to Session Close and New York Session Open to Session Close.
This chart shows how the Session Open (in this case, the New York Open) reminder notifies you that there could be volatility when a new session opens.
Trade Example 2b
Notice how price breaks to the upside at the opening of the New York session. In this instance it was a $2,250 or 5.17% increase in the opening hour.
3. Once London closes New York has control of the market; one push-up stops out the shorts that placed stop losses at the London high, then brings price back down to the mean.
By having the reminder lines and shaded sessions, the user is prepared and can anticipate some price reaction, often a reversal if price has been steadily moving in one direction.
IB + ExtensionsInitial Balance with Extensions.
Other traders have posted similar indicators. I wrote my own because I wanted additional features.
Features:
Supports up to 9 extensions. Default = 3.
Each extension is filled using an automatic gradient. Fill can be disabled if you like.
IB levels extend into the future to the end of the current session.
By default only the current IB levels are shown, but you can enable past IB's as well.
When showing past IB's, each session has a clean break - no awkward lines connecting one session to the other (this really annoyed me about other IB indicators!)
The IB midpoint is also supported. It is on by default, but can be disabled.
You may notice the midpoint of past IB's looks different than the current IB . There is a technical reason for this that I won't go into here. Ask if you want the full explanation.
NOTE: This indicator was designed for the crypto charts. It may have some rendering issues when used with other markets.

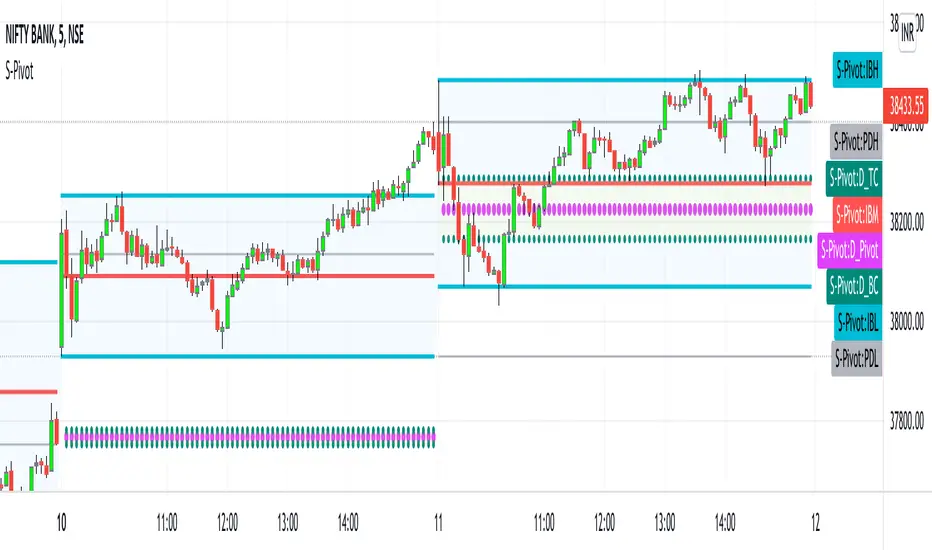
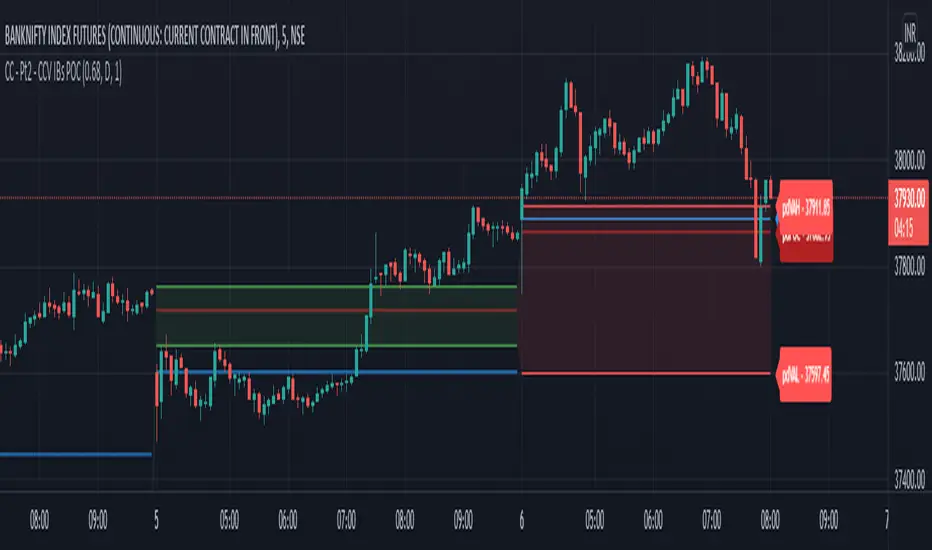
CPR_Previous Day Ranges_Initial BalanceHello Traders,
This script best works on Indian Index (Tested on BANKNIFTY & NIFTY)
This indicator can be used only for day trading (intraday: ex: 5min, 15min Timeframes) on indices.
This script helps to plot
1. Central Pivot Range(CPR)
2. Previous Day Ranges (PDH & PDL)
3. Initial Balance(IB)
brief description of indicators:
1. CPR: Central Pivot Range --> This indicator helps to identify key price points to set up trades. CPR is beneficial for intraday trading.
2.Previous Day Ranges: These ranges will help to understand the current day market.
PDH: Previous Day High value on current day
PDL: Previous Day Low value on current day
3.Initial Balance(IB):This indicator will help in day trading. IB will plot current day first 1hr high, low & mid values.
Disclaimer: This indicator can be used as refrence only. This has been tested on Banknifty and Nifty indices on day trading 5 minutes and 15 minutes timeframe. Understand yourself to knowledge of different trading methods.
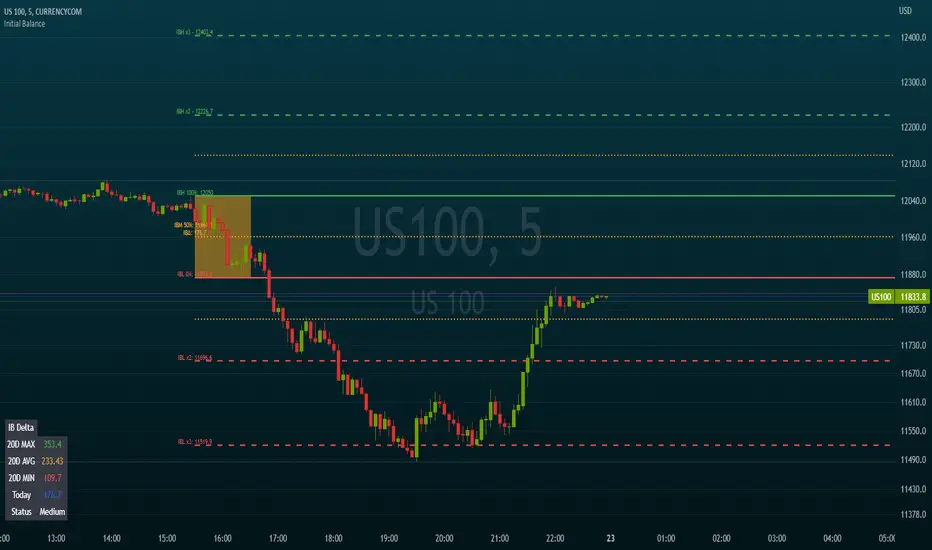
Initial BalanceThis script calculates and draws the initial balance price levels which can be really interesting for intraday activities.
Note: Obviously, you need to wait for the calculation period to finish in order to see your daily levels
The tool includes the following options
Customization of the session used to calculate the initial balance (default 0930-1030)
Show/Hide the calculation period (as a background color)
Show/Hide extra levels (report the IBH-IBL delta above and under the IB area)
Show/Hide intermediate levels (displays 50% price levels in the IB and extra areas)
Show labels (Display levels names as well as their price on corresponding lines)
Levels names:
- IBH (Initial Balance High)
- IBH (Initial Balance Low)
- IBM (Initial Balance Middle)
- IBH x2
- IBL x2
Default colors are green for high levels, red for low levels, and orange for intermediate levels
Extend levels (extends the current levels to left/right/both/none sides of the chart)
Day ClueDay Clue Indicator
live Market Information
Day Clue Indicator plots days information like " Initial Balance and Range ", " Day Range ", " Current Day Volume (for NIFTY and BANKNIFTY it takes the future volume) ", " ATR ", if the scrip is NIFTY or BANKNIFTY then it shows the difference between SPOT and Future price so that trader will come to know future is trading at premium or discount,it shows current day name at bottom right corner, and it plots the Ema-20 and Ema-200. These information will update during live market.
Information for Next Trading Session
Day Clue Indicator plots " Previous Day High" , " Previous Day Low ", " Central Pivot Range-CPR with S1 and R1 ","It indicate tomorrow is Trading Day or Trading Holiday(other than Weekend Holidays)" these are information used for next day that will be plot today itself once market closed
Limitations of Day Clue Indicator
Day Clue Indicator only work in Indian Market(NSE and BSE)
Day Clue Indicator only work in " 1-mins, 5-mins, 15-mins " Timeframes, if you switch to other timeframe like 30-mins,1-Hour, Daily then information will hide
Thank You

Koalafied Initial Balance Levels and ExtensionsShows the Initial Balance and range extensions for either the Daily session or individual market sessions (Asia, London, New York).
Initial Balance is the range represented by the first two segments (typically half-hour segments) of a trading session. Range extensions are a function of the longer-term trader participation, pushing price outside of the beginning 'fair' range established by the local traders. With the introduction of 24/7 markets the initial balance is often now regarded as less important than in the past, however re-calculating IB for multiple trading sessions may reinstitute insight to Market Direction and Confidence

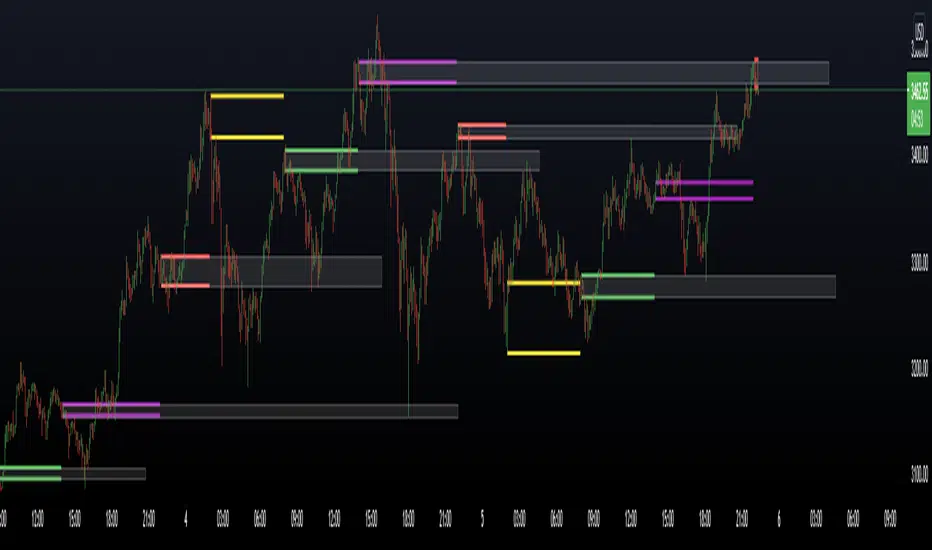
Single Prints - Session Initial BalancesDisclaimer: Expose yourself to the knowledge of different trading methods. If you are unaware of what a Single Print is then do some research and broaden your knowledge.
This indicator has only been tested on BTCUSDT Binance pair. This indicator is meant to be used on the 30 minute timeframe to highlight Single Prints.
The calculations are base on 0000 UTC and what Single Prints are created during that day.
Single Prints
Single Prints are where prices moves to fast through an area (on a 30 minute timeframe), in the case of this indicator in $50 intervals, where the price has not yet cross back past, represented as orange lines. If you were viewing this on a Time Price Opportunity Chart (TPO) each $50 would be represented as a square with a letter in it. If price has only been through that area once, within that 24 hour period, then it is called a Single Print. If however the Single Print is on the lower wick of the candle it is called a Buying Tail and on the Upper Wick a Selling Tail.
Single Prints leave low volume nodes with liquidity gaps, these inefficient moves tend to get filled, and we can seek trading opportunities once they get filled, or we can also enter before they get filled and use these single prints as targets.
Single Prints are a sign of emotional buying or selling as very little time was spent at those levels and thus there is no value there.
The endpoints of single print sections are considered to be potential support or resistance points and or get filled (like a CME gap).
The above is only a very short summary, to understand Single Prints, Buying Tails and Selling Tails more please do your own research (DYOR).
References:
Trading Riot Volume Profile - Website
TOROS TPO Charts Explained - Youtube
Session Boxes
Session Boxes are the high and low of that markets session before the new market session opens. I used the data from the website Trading Hours for the time input.
White box – Start of day UTC 0000 to Market Close UTC 2000
Purple box – Asia Start UTC 0130 to London Start UTC 0700
Yellow box – London Start UTC 0700 to New York Start UTC 1330
Blue box – New York Start UTC 1330 to Market Close UTC 2000
Red box – Market Close UTC 2000 to End of day UTC 2359
References:
Trading Hours - Website
Initial Balance
The Initial Balance is the market range between the high and low of the first hour of trading for the market. In the case of crypto when is the Initial Balance if it is 24/7.
Context of Initial Balance:
The Initial Balance is traditionally the range of prices transacted in the first hour of trade. Many regard the Initial Balance as a significant range because, especially for the index futures which are tied to the underlying stocks, orders entered overnight or before the open are typically executed prior to the end of the first hour of trade. Some use it to understand how the rest of the day may develop, while others use it as a span of time to avoid trading altogether because of its potential volatility.
For this indicator I have coded the Initial Balance time as below:
White Box - To appear for the first hour of the day 0000 to 0100 UTC .
Purple Box - To appear for the first hour of the day 0130 to 0230 UTC .
Yellow Box - To appear for the first hour of the day 0700 to 0800 UTC .
Blue Box - To appear for the first hour of the day 1330 to 1430 UTC .
Red Box - To appear for the first hour of the day 2000 to 2100 UTC .
The diagram above shows some examples:
How price (white arrows) retraces the single prints.
How price (red arrows) uses the single prints as S/R.
References:
Not Hard Trading – Website
My Pivots Initial Balance - Website
Thanks go to:
StackOverFlow Bjorn Mistiaen
Trading View user mvs1231
Please message me if you have any feedback/questions.
I am looking at developing this indicator further in the future.

NSDT Initial BalanceInitial Balance indicator plots the high and low of the first hour of US Futures Market session. Very useful for trading breakouts after market open. Also added range midline and background shading to identify first hour. Times are adjustable. All objects can be modified.
Key Levels by RifeMy take on Key Levels script that plots:
- Daily Open
- Weekly Open
- Monthly Open
- Day of Week Range (i.e. Monday Range)
- Initial Balance
Open levels are not visible on higher time frames, such as Daily Open is not visible on Weekly Open nor Monthly Open.
Initial Balance is not visible on the following timeframes: 2H, 4H, 6H, 8H, 1D, 1W and 1M. All other time frames will show it.

CBG Opening Range and Initial BalanceThis is a total re-write of my previous Opening Range indicator. All the same functionality with better code
Features
Opening Range and Initial Balance ranges (30 minutes and 1 hour defaults)
Overnight Range
Daily Open Price
Can select which midpoint: OR or IB
4 separate extensions (up and down) based on either OR or IB
Shaded range area
All lines and shading can be turned on and off in the Style menu
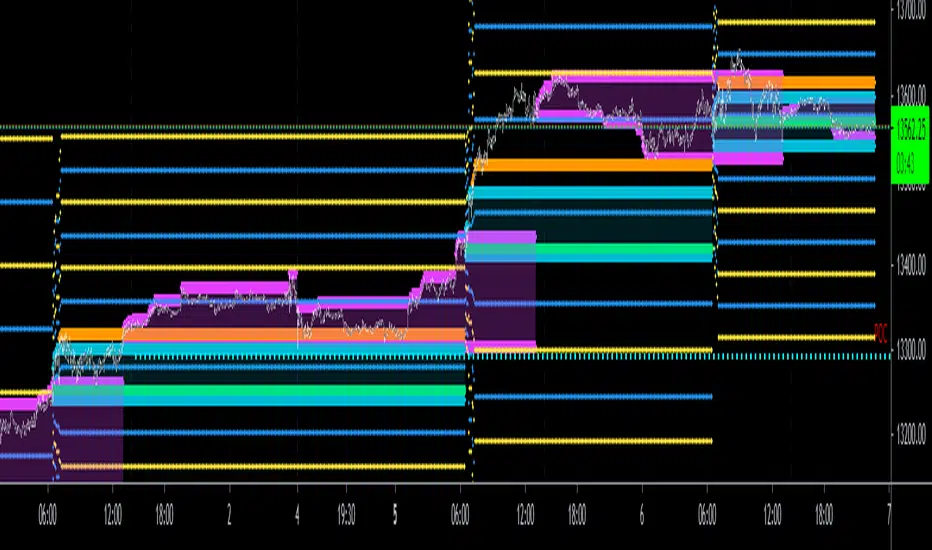
Chart Champions - Part 2 - CCV IBs POCsThank you for sparing you time to read my indicator.
This indicator has been created as a suite of 3. This was to ensure that those with only the Free Trading View account could benefit (with their restriction to 3 indicators). Please ensure you install each indicator and read each indicator write up to fully understand what has tried to achieved.
Chart Champions – Part 1 –Lvls nPOC VWAPS
This indicator is broken down into:
• Levels
• VWAPS
• Naked Point of Control
Levels
It displays the levels to the right of the price Axis to enable the user to have a cleaner chart.
The below levels will automatically appear:
dOpen – pdHigh – pdLow – pdEQ – pwEQ
Optional Levels include:
mOpen – pmOpen – pdOpen – dbyOpen – wOpen – pwOpen
VWAPs
Optional VWAPs
Daily (including pdVWAP close) – Weekly – Monthly
Naked Points of Control (nPOC)
To view the nPOC move the chart back in time to pick up the nPOCs.
Chart Champions – Part 2 – CCV IBs POC
This indicator is broken down into:
• Chart Champions Value
• Initial Balance
• Points of Control
Chart Champions Value (CCV)
CCV is based on the 80% rule of the dOpen opening outside of the pdVAH/pdVAL. Please do you own research to fully understand how this trading strategy works (readily avaliable online).
Initial Balance (IB)
IB is based on the first 60 minutes of the market opening. It captures the highest and lowest points within that 60 minutes. Please do you own research to fully understand how this trading strategy works (readily avaliable online).
Points of Control (POCs)
POC are the price levels where the most volume was traded.
Developing POC (dPOC) will constantly move with volume/price action through out the day.
Optional POCs
Previous Day POC (pdPOC) – Day Before Yesterday POC (dbyPOC)
Chart Champions – Part 3 – Sessions - Manual Input
This indicator is broken down into:
• Manual Inputs (daily, weekly, monthly)
• IGOR SessionsTtimes
• Pre + Market Openings
Manual Input
Daily x3
Weekly x 3
Monthly x 3
This allows the trader to put in specific levels.
IGOR Session Times
This is a user specific requirement to highlight cetain times during the day, displayed at the bottom of the chart in the colour strip.
Pre + Market Openings
This allows the user to see when pre market trading has started and with the live maket has started, displayed at the top of the chart in colours.
A huge thank you goes out to:
Stackoverflow users AnyDozer and Bjorn.
TV user ahancock for allow me use of this code.
Disclaimer the lower the timeframe the more information it processes.
Initial Balance Monitoring PanelInitial Balance Monitoring Panel
Allows you to have an instant view of 16 Crypto pairs within a monitoring panel, monitoring Initial Balance (Asia, London, New York Stock Exchanges).
The code can easily be changed to suit the crypto pairs you are trading.
The setup of my chart would also include this indicator and the " Initial Balance Markets Time Zones - Overall Highest and Lowest " (with all IBs enabled) as shown above.
Initial Balance is based on the highest and lowest price action within the first 60 minutes of trading. Reading online this can depict which way the market can trend for the session.
The indicator has been coded for Crypto (so other symbols may not work as expected).
Though Initial Balance is based off the first 60 minutes of the trading markets opening, but Crypto is 24/7, this indicator looks at how Asia, London and New York Stock Exchanges opening trading can affect Crypto price action.
As the current Market sentiment is bullish if the price action fell below all Initial balances I would be looking at completing Technical Analysis for a long trade and to see if price action can find support from the trading sessions Initial Balance:
Please see below an example of this....
IOTAUSDT signaled red (that it had dropped below all IBs) but then found support and moved on up.
Also a similar example as above for BTCUSDT....
If the signal is green do your technical analysis, but as shown below once the highest Initial Balance has been broken price can increase.
LINKLUSDT
I would like to say thanks to AnyDozer from StackOverFlow for helping me get my idea onto the charts and wugamlo for allowing me to use some of his panel code.

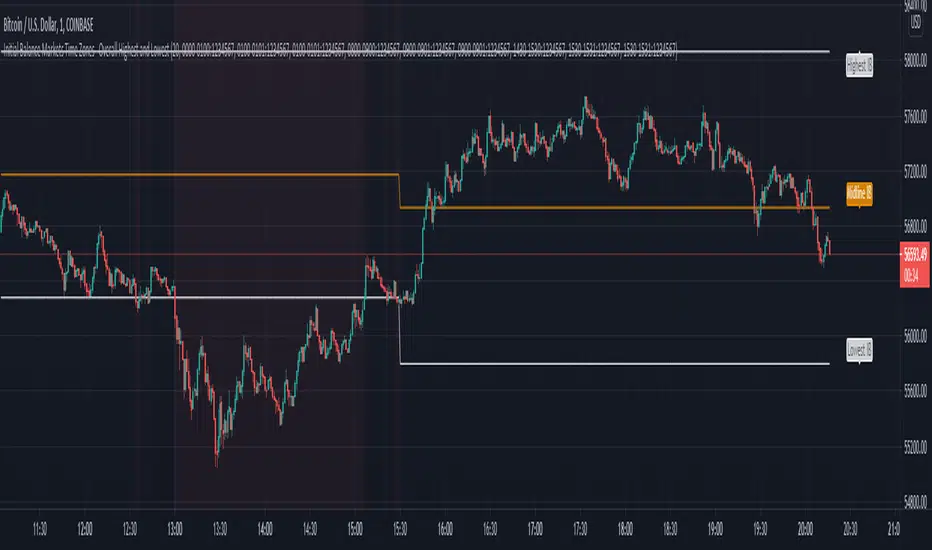
Initial Balance Markets Time Zones - Overall Highest and LowestInitial Balance Market Time Zones - Overall Highest and Lowest is an modified version of my previous script.
The aim was to show a cleaner screen by only displaying the highest and lowest Initial Balances from London, New York and Asia.
The below options are within the settings.
No.01
Price Action above all Initial Balances high = Green
Price Action below all Initial Balances low = Red
These are accompanied with alerts
No.02
Price Action above Midline = Green
Price Action below Midline = Red
These are accompanied with alerts
You also have the option to display all the Initial Balances within the settings.
Initial Balance Markets Time ZonesThe below script is based on Initial Balance.
Initial Balance is based on the highest and lowest points of Price Action (PA) within the first 60 minutes of trading. There is so much information available online, reference Initial Balance, that I have not provided a reference.
Most indicators I have seen have been solely based on UTC 0000 Initial Balance. My aim with this indicator was to be able to visualize how other time zones market openings Initial Balance affect PA.
The three market openings I chose to code in are:
London 0800 to 0900
New York 1430 to 1530
Asia 0000 to 0100
Within the script I have given the user the option to select to see with a green or red background when PA is above all zones Initial Balance high (green) or PA is below all zones Initial Balance low (red).
Alerts are also coded in, to prompt the user that PA has gone above or below as per above.
The Initial Balance high and lows also offer another form of areas of confluence.
Below are some examples of IB in action:
LTC
NULS
UNFI
DEXE

Trading Ideas - Chart Champions Value - Points of Interest Trading Ideas is based on having visual Points of Interest.
The indicator displays:
- dOpen : Daily Open
- dPOC: Developing Point of Control
- pdPOC : Previous Day Point of Control
- dbyPOC : Day Before Yesterday Point of Control
Initial Balance (High, low, mid points for the first hour (UTC 0000)
- IB High : Initial Balance High
- IB Mid : Initial Balance Middle
- IB Low : Initial Balance Low
Chart Champions Value ( CCV ) is based on Daniel - Chart Champions theory explained in his educational videos.
That if the previous day is a range day and price action (PA) closes:
Above the previous days Value Area High (pdVAH) then there is an 80% chance of it retracing back to previous days Value Area Low (pdVAL)
Below the previous days Value Area Low (pdVAL) then there is an 80% chance of it going back up to the previous days Value Area High (pdVAH)
The CCV check can be ticked on and off for a quick visual to see if the setup could potentially be in play (if green then CCV could be play for that day).
Settings/Configuration
The calculated Value Area (VA) can be amended.
It is recommend to change the resolution to that of your symbol. For example BTC resolution 1, XRP resolution 0.00001.
As seen below having key Points of Interest can make you think twice before going into a trade:
My thanks go to:
ahancock for allowing usage of his script.
AnyDozer and Bjorn Mistiaen on Stack Overflow for all their assistance.
Any feedback will be gratefully received.

Initial Balance & extensions Custom session time and IB durationThe indicator will plot Initial Balance levels and extensions. The session start and end times are configurable depending on instrument, as well as the Initial Balance end time. The session times must be entered in the underlying instrument's timezone, for example:
ES-futures (Chicago Timezone)
Session Start: 0830
Initial Balance End: 0930
Session End: 1515
US-Stocks (New York Timezone)
Session Start: 0930
Initial Balance End: 1030
Session End: 1600
Europe Futures (Madrid Timezone)
Session Start: 0800
Initial balance End: 0900
Session End: 2200
Colors and linewidths are also customisable.
User-Inputed Time Range & FibsGreetings Traders! I have decided to release a few scripts as open-source as I'm sure others can benefit from them and perhaps make them better.(Be sure to check my Profile for the other scripts as well: www.tradingview.com).
This one is called User-Inputed Time Range & Fibs.
The idea behind this script is to record the Range Highs and Lows of a User Defined Period, and plot potential Targets based on either Fibonacci Extensions or a Multiple of the Range Size. I created this originally for use with the US Session Initial Balance(From 9:30-10:30AM EST), however it can be set to any time period.
What is Initial Balance? In simple words, Initial Balance (IB) is the price data, which are formed during the first hour of a trading session. Activity of traders forms the so-called Initial Balance at this time. This concept was introduced for the first time by Peter Steidlmayer when he presented the market profile to traders(atas.net).
The IB is monitored as a break-out area for Range Extension traders. The IB High is also seen as an area of resistance and the IB Low as an area of support until it is broken(www.mypivots.com).
As a note, depending on the Time Zone you are in, you may need to manually add or subtract from the Timed Range to match the desired Time. For example in NY Eastern Time, I have to use 8:30-9:30AM to Capture the 9:30-10-30AM IB for ES and NQ. Similarly, I must use 14:30-15:30PM to Capture the 9:30-10-30AM IB for BTC. You will need to make adjustments based on the Time Zone you are located in.
I wanted to give a Special Thanks to @PineCoders for the Custom Rounding Function from Backtesting/Trading Engine--> (), Pinecoders.com for help with Tracking the Highs/Lows--> (www.pinecoders.com), and @TradeChartist for allowing me to use some of the code for the Fibonacci Extensions from his script here--> ().
If you like User-Inputed Time Range & Fibs, be sure to Like, Follow, and if you have any questions, don't be afraid to drop a comment below.

Opt IB+ [Intromoto]Hi Folks.
This script is similar to my previous IB+ script, but this has the options of changing the base period time frame, normally daily, to other options. I've also allowed user input to the range period, normally one hour of the trading session.
The IB can be used to establish a range and framework to trade within, as support and resistance, as well as directional bias.
I've reduced the upper and lower extensions to two per side, and added an IB 'breach' plotshape to aid in breakouts from the range in either direction, above highs, and below lows or the range.
Range high and range low plots will change color based on the directional bias and price relative to the range.
Please DM for access.
Thanks!

[co.n.g] LeathermanThis is a modest approach of assembling my most favorite strategies into a single indicator script!
I extended the functionality of the ART to the maximum in this piece of price action and volume analysis.
The original "Average Range Targets" - though by default turned off t due to heavily re-scaling the chart -
and the previous day's high and low.
What I've added:
high and low of the actual week
high and low of the previous week
open of the day
close of the previous day
VWAP of the daily session - adjustable to any length
VWAP of the weekly session
opening range / inital balance of the session -fixed to 15 Minutes
I've decluttered the chart as good as possible.
KNOWN BUGS:
Sometimes the plotting is incorrect due to rescaling or zooming in and out of the chart.
How to use - a quick price action guide:
The breakout of the open range is often indicating the trend of the day, a false breakout is often seen as a reversal sign.
A price below the VWAP is seen as cheap, a price above as expensive. In contrary to others, I personally prefer to see a rising price on a rising VWAP ;
additionally, I like bounces off or spikes and reversals through the VWAP , either the daily or the weekly.
The highs and lows of the days and weeks are seen as support and resistance . Trade preferably long above and short below those levels.
The ADR is an indication not working perfectly, especially with stocks.
!!! WARNING !!!
Don't rely solely on a single script nor a single indicator!
Always consider the price action, the trend, the overall market and especially the volume.
There is no "Get-Rich-Quick"-scheme, learn to read the chart and trade accordingly.
Enjoy and make money!
Yours,
Constantine
p.s.:
If you like to show your gratitude for my work:
CHEER!

IB+ [Intromoto] Hey traders,
This is a script that calculates the Initial Balance , which is the range of the first hour per trading session/day.
The pink and green lines are the high and respective low extension multiples, up to x12 the IB .
White line in the center is the middle of the IB , and the orange lines above and below are the 1/4 and 3/4 fractions of the IB .
IB is filled black to make the IB a bit more obvious.
The IB can be used to determine the direction/trend of price intraday or for swing trades.
S/R or pivot levels often occur at current or past IB extensions.
Reuploaded for code protection and for further edits.

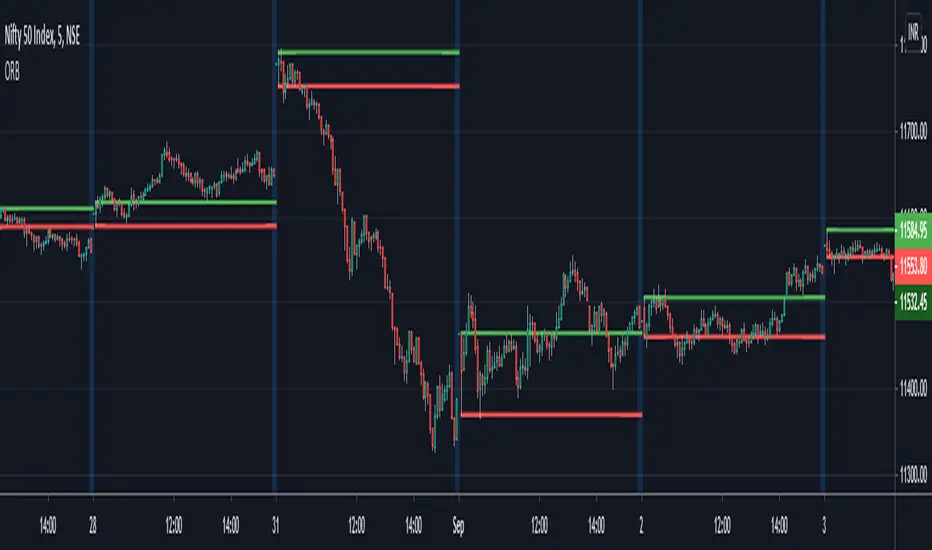
ORB - Opening Range BreakoutThis script plots the high/low of any custom session and extends it until the daily close. It does not show on the timeframe higher than the length of custom opening session by default.
The time period of opening range & the max timeframe to display it on can be adjusted from the settings.
So for eg. if want to use 5m ORB to trade, then set "ORB total time" as 5min & "Session Time" as whatever is the opening 5mins time period of ticker that are trading.