1-2-3 Reversal Strategy [Stormer Trend]Title: 1-2-3 Reversal Strategy
ENGLISH DESCRIPTION: OVERVIEW This indicator identifies the classic 1-2-3 Setup but optimized for Trend Following. Instead of trying to pick bottoms in a downtrend, this script filters for 1-2-3 patterns that occur in favor of the major trend (Continuations).
THE DUAL FILTER (EMA 7 + EMA 70) To reduce false signals, the script applies a strict trend filter by default:
BUY Signals: Only appear if the price is ABOVE both EMA 7 and EMA 70.
SELL Signals: Only appear if the price is BELOW both EMA 7 and EMA 70.
Result: You trade reversals that align with the dominant momentum.
FEATURE: THE GOLDEN SIGNAL (123+)
🟡 GOLD BAR: Happens when the 1-2-3 setup bar is also an Inside Bar.
Why: Combines Pivots + Volatility Contraction. Highly explosive.
HOW TO OPERATE
Timeframe: Weekly/Daily.
Entry: Breakout of the signal bar.
Stop: Technical stop at the pivot point (Bar 2).
Disclaimer: Educational tool only.
Inside Bar

Key Reversal Strategy [PFR Analysis]Title: Key Reversal Strategy
ENGLISH DESCRIPTION: OVERVIEW This indicator is a complete Price Action system designed for Position Trading. It identifies two powerful setups: Key Reversals (PFR) for rejection and Inside Bars (IB) for contraction/continuation. It also features dynamic EMAs and automatic entry/stop lines.
1. SIGNAL LOGIC & COLORS
🔵 BLUE (Trend PFR):
Setup: Key Reversal (Lower Low + Close > Previous Close).
Filter: Price is ABOVE EMA 7 and EMA 70.
Meaning: High probability pullback entry in an uptrend.
🟣 FUCHSIA (Reversal PFR):
Setup: Key Reversal occurring BELOW EMAs or against the trend.
Meaning: Potential bottom fishing / Reversal setup. Higher risk.
🟠 ORANGE (Inside Bar):
Setup: High < Previous High AND Low > Previous Low.
Meaning: Volatility contraction. Often precedes a strong breakout.
🏆 PRO TRADER TIP (THE GOLDEN RULE) The Best Signals occur when the EMAs are GREEN.
If you see a BLUE PFR and the EMAs are GREEN (Sloping Up), the momentum is fully aligned with your trade. This significantly increases the success rate.
Avoid Long setups if the EMA 70 is Red (Downtrend), even if the signal is Blue.
2. VISUAL AIDS
Dynamic EMAs: MME 7 & 70 change color (Green = Rising, Red = Falling).
Smart Lines: Automatically plots Dashed Lines (Green for Entry, Red for Stop) on the most recent valid signal.
HOW TO OPERATE
Timeframe: Weekly (1W) recommended.
Entry: Buy Stop above the signal bar's High.
Stop Loss: Just below the signal bar's Low.
Disclaimer: Educational tool only. Always manage your risk.

TDL: Formation Scanner: Symbol Scanner with Broadening Formation═══════════════════════════════════════════════════════
TDL: Formation Scanner
Multi-Symbol Scanner with Broadening Formation Analysis
═══════════════════════════════════════════════════════
A comprehensive multi-symbol scanner implementing bar-by-bar price action analysis with advanced broadening formation detection and trade style classification.
Scan up to 20 symbols simultaneously across 14 pre-defined sector buckets. Identify high-quality setups with detailed scoring, formation analysis, and actionable trade recommendations.
━━━━━━━━━━━━━━━━━━━━━━━━━━━━━━━━━━━━━━━
🔑 KEY FEATURES
━━━━━━━━━━━━━━━━━━━━━━━━━━━━━━━━━━━━━━━
Scan 20 symbols at once across 14 sector buckets
Bar-by-bar classification (1, 1-1, 2U, 2D, 3)
Five-factor weighted scoring system (0-100)
Broadening formation detection (7 pattern types)
Trade style classification (Mean Reversion vs Momentum)
Confluence rating based on multiple aligned factors
Reversal pattern detection (2-2 Rev, 3-2 Rev, Failed BO)
Edge-based action recommendations with detailed tooltips
SPY relative strength integration
Time-of-day weighting (power hour, closing drive)
━━━━━━━━━━━━━━━━━━━━━━━━━━━━━━━━━━━━━━━ ]
📊 SCANNER COLUMNS
━━━━━━━━━━━━━━━━━━━━━━━━━━━━━━━━━━━━━━━
SYM — Symbol (color-coded by trade style)
TYPE — Bar classification (1, 1-1, 2U, 2D, 3)
SIGNAL — Current trigger status (LONG/SHORT/RDY/WAIT)
PRICE — Current price
SCORE — Quality score (0-100) with grade
ENTRY — Distance to trigger or extent past trigger
WHY — Key factors (good tags | warning tags)
BRDG — Broadening formation type and bias
LOC — Location within formation (Upper/Lower/Mid)
PAT — Reversal pattern detected
CONF — Confluence rating (⭐⭐⭐ to ○)
ACTION — Recommended trade action
━━━━━━━━━━━━━━━━━━━━━━━━━━━━━━━━━━━━━━━
📚 BAR TYPE CLASSIFICATION
━━━━━━━━━━━━━━━━━━━━━━━━━━━━━━━━━━━━━━━
Every bar is classified by comparing to the prior bar:
★1-1 (Inside of Inside) — Coiling energy, highest potential
★1 (Inside) — Range contraction, either direction
2U (2-Up) — Broke prior high, held low → LONG ONLY
2D (2-Down) — Broke prior low, held high → SHORT ONLY
3 (Outside) — Broke both → Use close position for direction
Critical Rule: The scanner respects directional rules:
2U bars can ONLY trigger long entries
2D bars can ONLY trigger short entries
Inside bars wait for trigger direction
Outside bars use close location for bias
━━━━━━━━━━━━━━━━━━━━━━━━━━━━━━━━━━━━━━━
📐 BROADENING FORMATION DETECTION
━━━━━━━━━━━━━━━━━━━━━━━━━━━━━━━━━━━━━━━
Detects 7 types of expanding range patterns:
MF (Megaphone) — Higher highs + Lower lows → Neutral
ABW (Asc Broadening Wedge) — Both rising, highs steeper → Bear
DBW (Desc Broadening Wedge) — Both falling, lows steeper → Bull
BWB (Broadening Wedge Bottom) — Highs rising faster → Bull
BWT (Broadening Wedge Top) — Lows falling faster → Bear
ARA (Asc Right-Angle) — Flat highs + Rising lows → Bull
DRA (Desc Right-Angle) — Falling highs + Flat lows → Bear
Location Detection:
▲ UPPER = Near upper boundary (favors short/fade)
▼ LOWER = Near lower boundary (favors long/fade)
MID = Middle zone (wait for edge)
━━━━━━━━━━━━━━━━━━━━━━━━━━━━━━━━━━━━━━━
🔄 TRADE STYLE CLASSIFICATION
━━━━━━━━━━━━━━━━━━━━━━━━━━━━━━━━━━━━━━━
🟢 MEAN REVERSION — Fade the edges
(A+) = Perfect setup: Edge + Pattern + Bias aligned
(Go) = Good setup: Edge + Bias aligned
(Caution) = Edge setup but against formation bias
🔵 MOMENTUM — Follow the breakout/breakdown
(Breakout+) = Long through upper with Bull bias
(Breakdown+) = Short through lower with Bear bias
(Breakout) = Long through upper (no bias support)
(Breakdown) = Short through lower (no bias support)
━━━━━━━━━━━━━━━━━━━━━━━━━━━━━━━━━━━━━━━
⭐ CONFLUENCE RATING (CONF Column)
━━━━━━━━━━━━━━━━━━━━━━━━━━━━━━━━━━━━━━━
Confluence rating based on aligned factors:
MEAN REVERSION:
⭐⭐⭐ 🟢 = Strong: Edge + Pattern + Bias aligned
⭐⭐ 🟡 = Moderate: Some factors aligned
⭐ 🟠 = Low: Minimal confluence
MOMENTUM:
⭐⭐ 🟡 = Bias aligned breakout/breakdown
⭐ 🟠 = Neutral bias
○ 🔴 = Against formation bias
NO RATING:
— = Middle zone or no formation detected
Hover over CONF column for detailed breakdown of factors.
━━━━━━━━━━━━━━━━━━━━━━━━━━━━━━━━━━━━━━━
🔍 REVERSAL PATTERNS
━━━━━━━━━━━━━━━━━━━━━━━━━━━━━━━━━━━━━━━
2-2 Rev — Consecutive opposite 2-bars at edge
Example: 2U → 2D at upper edge = Strong reversal
3-2 Rev — Outside bar followed by directional 2-bar
Example: 3 → 2D at upper edge = Reversal after expansion
Failed BO — Price broke edge then reversed back inside
Trap pattern with strong reversal potential
━━━━━━━━━━━━━━━━━━━━━━━━━━━━━━━━━━━━━━━
📊 FIVE-FACTOR SCORING SYSTEM
━━━━━━━━━━━━━━━━━━━━━━━━━━━━━━━━━━━━━━━
Each setup scored 0-100 based on:
1. Setup Quality (20%) — Bar type (1-1 > 1 > 2 > 3)
2. Trigger Timing (20%) — Fresh > Ready > Running > Extended
3. Trend Alignment (20%) — EMA relationship and slope
4. Participation (15%) — Volume and close location
5. Risk Quality (15%) — Range size, gap risk
6. Regime (10%) — Volatility compression/expansion
Grades: A+ (85+) | A (75+) | B+ (65+) | B (55+) | C (<55)
━━━━━━━━━━━━━━━━━━━━━━━━━━━━━━━━━━━━━━━
📁 SECTOR BUCKETS (14 Groups)
━━━━━━━━━━━━━━━━━━━━━━━━━━━━━━━━━━━━━━━
1A - Indices & Mega Tech
1B - Sector ETFs & Crypto-related
2A - Semiconductors
2B - Tech & SaaS
3A - Banks
3B - Finance & Insurance
4A - Consumer
4B - Retail & Travel
5A - Healthcare
5B - Biotech
6A - Energy
6B - Industrial
7A - Speculative
7B - Growth
━━━━━━━━━━━━━━━━━━━━━━━━━━━━━━━━━━━━━━━
⚙️ KEY SETTINGS
━━━━━━━━━━━━━━━━━━━━━━━━━━━━━━━━━━━━━━━
Scan Settings:
Scan Timeframe: D (Daily), W (Weekly), M (Monthly)
Data Mode: Confirmed (no repaint) vs Live
Min Score: Filter low-quality setups
Status Filters:
Show Triggered / Ready / Watch
Inside Bars Only
Hide Extended Signals
Broadening Settings:
Edge Zone Threshold: 15% / 20% / 25%
Boost/Penalize edge setups
Show broadening stocks only
Trade Style Filters:
Show Mean Reversion setups
Show Momentum setups
━━━━━━━━━━━━━━━━━━━━━━━━━━━━━━━━━━━━━━━
📖 HOW TO USE
━━━━━━━━━━━━━━━━━━━━━━━━━━━━━━━━━━━━━━━
1. Select sector bucket
Choose from 14 pre-defined groups.
2. Review scanner results
Sorted by priority (triggered > ready > watch) and score.
3. Check CONF column
More stars = more factors aligned.
4. Check ACTION column
Shows recommended trade style and direction.
5. Apply Execution Suite
Add companion indicator to individual chart for execution.
━━━━━━━━━━━━━━━━━━━━━━━━━━━━━━━━━━━━━━━
🔗 COMPANION INDICATOR
━━━━━━━━━━━━━━━━━━━━━━━━━━━━━━━━━━━━━━━
Use with TDL: Trade Execution Suite for:
Visual formation boundaries on chart
Precise entry trigger lines
Stop and target levels
HTF bar type labels
Real-time trade management
━━━━━━━━━━━━━━━━━━━━━━━━━━━━━━━━━━━━━━━
⚠️ REPAINTING NOTICE
━━━━━━━━━━━━━━━━━━━━━━━━━━━━━━━━━━━━━━━
"Confirmed" mode (default): Uses last completed bar. NO REPAINTING.
"Live" mode: Uses forming bar. WILL REPAINT until bar closes.
━━━━━━━━━━━━━━━━━━━━━━━━━━━━━━━━━━━━━━━
⚠️ DISCLAIMER
━━━━━━━━━━━━━━━━━━━━━━━━━━━━━━━━━━━━━━━
This indicator is for educational and informational purposes only. Trading involves substantial risk of loss. Past performance does not guarantee future results. Always use proper risk management.
━━━━━━━━━━━━━━━━━━━━━━━━━━━━━━━━━━━━━━━

Inside Bar Breakout ( candlestick pattern).📌 What Is This Indicator?
BOIB Pro identifies a very strict form of inside bar:
✅ The inside bar candle’s entire range (body + wicks) must be inside the BODY of the previous candle (mother candle).
❌ If even a single wick is outside the mother body, the setup is rejected.
This filters out weak and noisy inside bars and focuses only on true compression candles.
⸻
📐 Pattern Rules (Strict)
1️⃣ Mother Candle
• The candle immediately before the inside bar
2️⃣ Body-Only Inside Bar (BOIB)
A valid BOIB must satisfy:
• Inside bar high ≤ mother candle body high
• Inside bar low ≥ mother candle body low
⚠️ Normal inside bars (inside wicks only) are ignored.
⸻
⏱️ Breakout Window Logic
After a valid BOIB forms:
• The indicator waits for the next 1 to 5 candles (user-configurable)
• Entry is triggered only if price CLOSES outside the BOIB range
✅ Long Signal
• Candle closes above BOIB high
✅ Short Signal
• Candle closes below BOIB low
If no breakout occurs within the window → setup expires automatically
⸻
🎯 Entry, Stop Loss & Take Profit Logic
Once a valid breakout/breakdown occurs, the indicator automatically draws a professional trade template:
Entry
• At the close of the breakout candle
Stop Loss
• Long → below BOIB low
• Short → above BOIB high
• Optional buffer:
• ATR-based
• Percentage-based
• Or none
Take Profits
• TP1: Risk-Reward based (default 1R)
• TP2: Extended target (default 2R)
All levels are clearly visualized using:
• Horizontal price lines
• Risk and reward boxes
• Informational labels
⸻
📊 Best Use Cases
• Crypto (BTC, ETH, major alts)
• Timeframes:
• Scalping: 5m
• Day trading: 15m / 30m
• Works best when combined with:
• Market structure
• Trend bias
• Support / resistance
⸻
⚠️ Important Notes
• This is NOT an auto-trading system
• Signals should always be used with:
• Proper risk management
• Market context
• Inside bars in sideways or low-volume markets may fail
⸻
📚 Educational Purpose Disclaimer
This indicator is provided for educational and analytical purposes only.
It does not constitute financial advice.
Trading involves risk, and past behavior does not guarantee future results.

Toby Crabel's HisVolAs in Linda Raschke's Street smarts..... . This indicator shows the signals of Toby Crabel's Historical Volatility 6/100 strategy. The strategy assumes, that volatility contraction measured by two measures would give better results.
There is one other script that is a strategy , but it assumes that the signal requires both inside bar and narrowest range, what is not as in Linda Raschke's.
The strategy and what does the script do:
1) measures short-term unannualized volatility (by default six), long term uannualized volatility (by default 100), and measures the ratio of short volatility / long volatility.
2) checks if the current bar is an inside bar or has narrowest range out of last X bar (by default 4), or both,
3) puts an etiquette if short volatility / long volatility is equal to or smaller than 0,5 AND the day is inside bar, has narrowest range, or both.
Next day both buy-stop and sell-stop should be set. Buy-stop at the high and sell-stop at the low of the bar with etiquette.
This is by no means any financial advice, nor the historical results guarantee future gain.


Inside and Outside Bar@55Explanation
Definition of Inside Bar:
Loose Definition: The high and low of the current candlestick are both within the high and low range of the previous candlestick.
Strict Definition: One extreme value (either high or low) of the current candlestick is equal to that of the previous candlestick, while the other extreme value falls within the range of the previous candlestick.
Definition of Outside Bar:
Loose Definition: The high of the current candlestick is higher than that of the previous candlestick, and the low of the current candlestick is lower than that of the previous candlestick.
Strict Definition: One extreme value (either high or low) of the current candlestick is equal to that of the previous candlestick, while the other extreme value breaks through the range of the previous candlestick.
plotshape Function: If an inside bar or outside bar is detected, the letter i (for inside bar) or o (for outside bar) will be displayed above the corresponding candlestick.
Parameters:
tightInside: When this toggle is enabled, the definition of an inside bar will be more strict, meaning one extreme value equals that of the previous candlestick and the other extreme value stays within the range of the previous candlestick.
tightOutside: When this toggle is enabled, the definition of an outside bar will be more strict, meaning one extreme value equals that of the previous candlestick and the other extreme value breaks through the range of the previous candlestick.

Inside Bar Detector
Inside Bar & Internal Structure
A precise tool for identifying Inside Bars and tracking price range breakouts with internal market structure visualization.
🎯 What It Does
This indicator detects Inside Bars (consolidation patterns) and classifies how price breaks out of established ranges. It helps traders identify:
• Consolidation zones where price is coiling
• Directional breakouts (up or down)
• Liquidity sweeps where price tests both sides before committing to a direction
📊 Key Features
Inside Bar Detection - Automatically identifies when current bar's range is contained within the previous range
Range Visualization - Draws dashed rectangle boxes around Inside Bar sequences
Breakout Classification - Categorizes breaks as: Break High, Break Low, or Expansion
Sweep Detection - Labels bars that sweep both sides of the range before closing directionally
Internal Structure Lines - Connects swing highs and lows to visualize market structure
Statistics Panel - Real-time count of Inside Bars and breakout types
🔧 How It Works
1. Price Range Tracking : The indicator maintains a dynamic price range (high/low) that updates on each breakout
2. Inside Bar Logic : A bar is classified as Inside Bar when its high ≤ range high AND low ≥ range low
3. Breakout Detection :
• Break High : Price closes above the range (bullish)
• Break Low : Price closes below the range (bearish)
• Sweep : Price tests both sides but closes directionally (labeled as Sweep↑ or Sweep↓)
• Expansion : Price breaks both sides but closes in the middle (neutral)
⚙️ Settings
Display Settings
- Show Inside Bar Box: Toggle rectangle visualization
- Show Statistics: Display count panel
- Show Sweep Labels: Mark liquidity sweep events
Internal Structure Settings
- Show Internal Structure Lines: Connect swing points
- Line Color & Width: Customize appearance
Color Settings
- Inside Bar Box Color & Transparency
📈 How To Use
• Trend Continuation : Look for Inside Bars forming after a strong move, then trade the breakout in the trend direction
• Reversal Setups : Watch for sweep patterns (Sweep↑/Sweep↓) at key levels - these often indicate liquidity grabs before reversals
• Structure Analysis : Use internal structure lines to identify the current market bias
⚠️ Alerts
The indicator includes 4 alert conditions:
• Inside Bar Detected
• Break High (includes bullish sweeps)
• Break Low (includes bearish sweeps)
• Dual Expansion (neutral)
📋 Notes
• Works on all timeframes and instruments
• Consecutive Inside Bars are merged into a single box for cleaner visualization
• Internal structure lines ignore Inside Bars to reduce noise

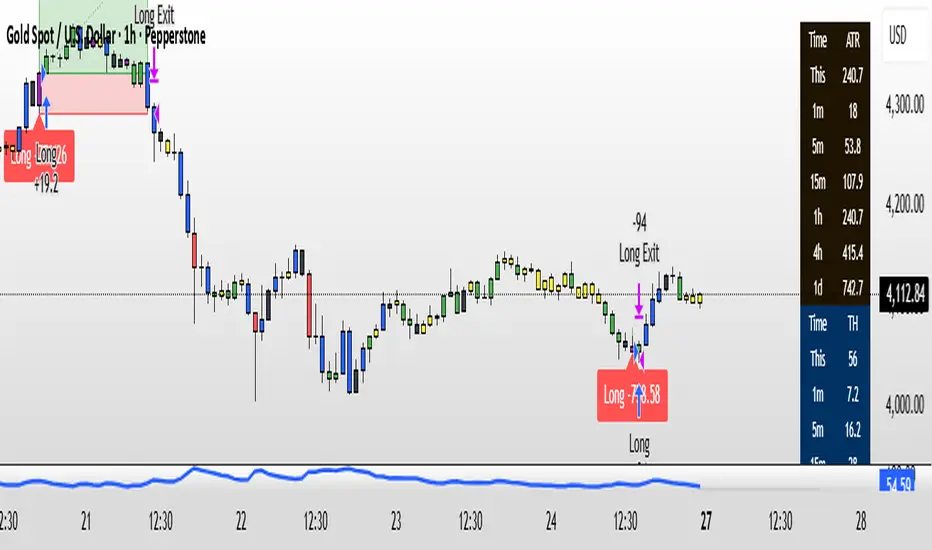
CyberTrading-Inside Hunt RobotThis Pine Script strategy, titled "Cyber-Inside", is a fully automated entry and risk management system built around inside bar pierce patterns and ATR-based dynamic stops/targets. It identifies specific candle formations, calculates position sizing based on risk percentage, and visually displays risk/reward zones and trade labels on the chart.
Detailed Explanation
1. Core Logic
The script searches for inside bars — candles whose high and low are contained within the previous bar — that appear after a valid “normal” or “long” range candle.
Then it waits for a wick pierce (a candle that breaks the previous inside bar's range slightly but closes inside).
That wick pierce acts as a potential reversal or continuation signal:
wickDown → possible long entry
wickUp → possible short entry
2. ATR-based Classification
Each candle is compared to the ATR(24):
Spinning (small) → below 0.8 × ATR
Standard → between 0.8× and 1.2× ATR
Long → between 1.2× and 2.5× ATR
Huge → above 2.5× ATR
Only certain candle types (standard or long) in the previous bars qualify for pattern validation.
3. Entry Conditions
A trade signal occurs when:
The current bar forms a wick pierce of a prior inside bar pattern.
No active position exists (strategy.position_size == 0).
Then:
For longs, entry at close, stop at previous low minus ATR buffer.
For shorts, entry at close, stop at previous high plus ATR buffer.
4. Risk Management
The stop distance defines the risk per trade, and the position size is adjusted dynamically so that only the chosen riskPercent (e.g., 1%) of equity is at risk.
If useRR is enabled, a take-profit target is placed using the defined risk/reward multiple (rr, e.g. 1:3).
If disabled, the target defaults to the previous candle’s high or low.
5. Visualization
The strategy visually marks:
Entry points (triangles)
Red box = risk zone (entry → stop)
Green box = reward zone (entry → target)
Optional diagonal and horizontal lines for clarity
Labels updated after trade closes with PnL values (profit or loss)
6. Application
This system helps traders:
Automate inside-bar breakout or reversal entries
Maintain strict risk-based position sizing
Visually assess trade zones and risk/reward areas
Backtest and evaluate performance consistency on various timeframes and assets
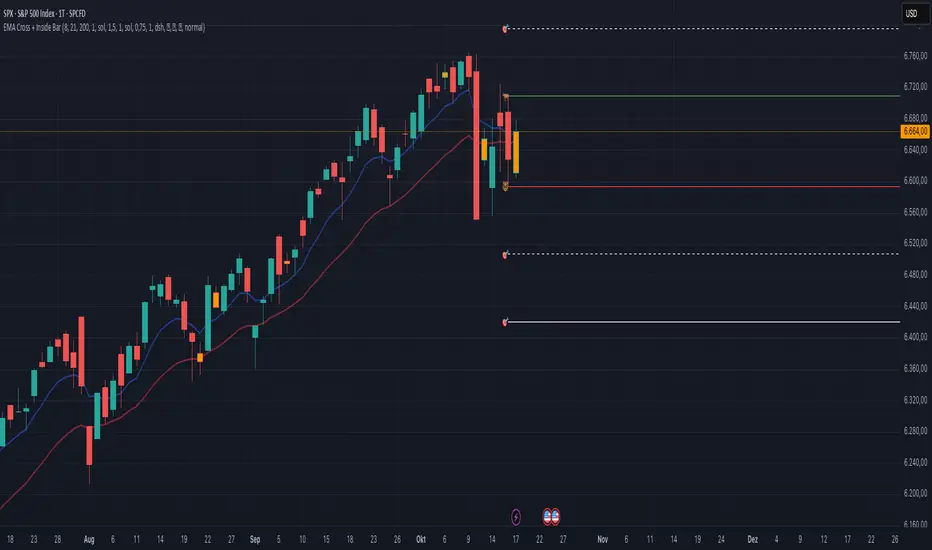
EMA Cross + Inside BarWith the EMA Cross + Inside Bar script you can spot inside bars instantly.
Based on the inside bar there is a call and a put trigger to help you find the key areas to look for long/short positions.
It's also possible to show possible target areas based on a multiplier.
The script is highly customizable and will be improved in the future.
If you have questions or feedback just message me via X.
And don't forget: Always do your own research :)
SMC pro trend
The PSK FX Structure Indicator (also known as SMC pro trend) is a complete Smart Money Concepts (SMC) toolkit designed for professional structure traders.
It detects and visualizes key price structure elements such as BoS (Break of Structure), CHoCH (Change of Character), HH/HL/LH/LL, IDM zones, SCOB, sweeps, inside bars, and EMA confluence — all with precise non-repainting logic.
This indicator helps traders read price action like an institution — identifying liquidity shifts, order flow direction, and possible reversal or continuation zones.
⸻
⚙️ Core Features
🧭 Structure Detection
• Automatic detection of major structure points:
• HH – Higher High
• HL – Higher Low
• LH – Lower High
• LL – Lower Low
• Confirms BoS (Break of Structure) and CHoCH (Change of Character) events in both bullish and bearish markets.
• Marks each structure change with labels and connecting lines for clarity.
🔁 BoS / CHoCH Logic
• Solid line = BoS
• Dashed line = CHoCH
• Colored by direction:
• 🟩 Bullish = Green
• 🟥 Bearish = Red
• Option to show live BoS/CHoCH lines extending forward for real-time updates.
🧱 IDM (Internal Displacement Model) Zones
• Detects previous and live IDM zones (premium/discount zones).
• Highlights IDM candles that cause structural displacement.
• Labels each detected IDM level automatically.
⚡ Sweeps (Liquidity Grab Detection)
• Detects when price sweeps previous highs/lows.
• Marks these zones with dotted lines and optional “X” markers.
🧩 SCOB Pattern (Smart Candle Order Block)
• Detects and colors special SMC candle structures:
• Bullish SCOB → Aqua
• Bearish SCOB → Fuchsia
• Option to color all bars by trend direction or only highlight SCOB bars.
🧭 Internal Structure & Pivots
• Marks minor highs/lows (internal structure) for better IDM leg visualization.
• Helps identify early momentum shifts before major structure breaks.
🎯 1.618 Target Projection
• Projects 1.618 Fibonacci targets dynamically after BoS or CHoCH confirmation.
• Displays target price level with text label:
• Bullish → Green Target Line
• Bearish → Red Target Line
🧱 Inside Bar Zones
• Highlights inside bar formations (compression zones).
• Draws colored boxes between high/low of inside bar clusters.
• Marks the first and consecutive inside bars with custom bar colors.
📊 EMA Filter
• Includes a toggleable Exponential Moving Average (EMA) for confluence with trend direction.
• Customizable EMA length (default: 50).
🎨 Monochrome Mode
• Toggle between normal color mode and a clean monochrome theme for minimalistic charting setups.
⸻
🧠 How to Use
1. Identify Market Context:
Wait for a confirmed CHoCH to spot potential reversals or structure shifts.
2. Follow Order Flow:
Confirm trend direction via BoS lines and IDM zones.
3. Entry Planning:
Combine sweep detection, inside bar zones, and IDM levels for sniper entries.
4. Take Profit Zones:
Use the 1.618 target projection line to set high-probability TP levels.
5. Trend Filtering:
Use EMA direction to confirm whether to follow continuation or counter-trend setups.
⸻
🧩 Inputs & Settings
Category
Key Settings
Structure
Equal H/L toggle, HH/LL labeling, internal structure
BoS/CHoCH
Enable/disable labels, custom label size, bull/bear colors
IDM
Show previous/live IDM, label size, color options
Sweeps
Show sweep lines, X-markers, sweep line color
Bar Coloring / SCOB
Toggle bar coloring and SCOB pattern
Inside Bars
Highlight and box compression zones
1.618 Targets
Enable Fibonacci target projection
EMA
Toggle EMA and adjust length
Monochrome Mode
Apply single-color chart theme
⚠️ Notes
• This indicator is built for non-repainting structure confirmation.
• Use it on higher timeframes for swing structure or lower timeframes for IDM entry precision.
• Works best with clean price action charts (no cluttered oscillators or extra visuals).
⸻
💡 Recommended Use Cases
✅ SMC traders
✅ ICT/Order Block strategy users
✅ Liquidity and market structure traders
✅ Scalpers and swing traders using BoS/CHoCH logic
⸻
✍️ Author
Developed by PURNA SAMPATH KALUARACHCHI (PSK FX)
Smart Money Concepts researcher and price structure developer.
⸻


Candlestick Suite–(Phoenix) it colors the major Reversal candlesticks
BullEngulf or BearEngulf or Engulfing() -> DARK_ORANGE
PiercingLine or DarkCloudCover -> CYAN
BullishHarami or BearishHarami -> YELLOW
BullishInsideBar or BearishInsideBar -> WHITE

IB with Range PercentageThis Pine Script indicator for TradingView combines several powerful technical analysis tools to give traders a comprehensive view of market action:
Inside Bar Detection: Identifies the classic inside bar candlestick pattern.
Moving Averages: Provides multiple moving averages to help determine trend and potential support/resistance levels.
Information Table: Displays key market data in a concise table format.
1. Inside Bar Detection and Range
The indicator marks inside bars on the chart. An inside bar is a candlestick where its entire range (high and low) falls within the range of the preceding candlestick (often called the "mother bar"). This pattern often signifies market consolidation or indecision.
Customizable Marking: Users can choose the shape and color used to mark the inside bars, such as triangles, squares, or circles.
Range Percentage: A label shows the range of the inside bar as a percentage of the previous bar's low, providing a quantitative measure of its size.
Time Restriction: A setting allows displaying inside bars only for a specified number of past days, focusing analysis on recent price action.
Customizable Label Size: Users can choose the size of the range percentage label for optimal visibility.
2. Moving Averages for Trend Analysis
The indicator can plot up to four moving averages (MAs) on the chart. Moving averages smooth out price data to help identify trends and potential support and resistance levels.
User-Selectable MA Type: For each MA, traders can choose between Simple Moving Average (SMA) or Exponential Moving Average (EMA).
Customizable Length: Users can specify the length (number of periods) for each MA, such as 20, 50, 100, or 200.
Customizable Color: Each MA's line color can be chosen to suit personal preferences.
Trend Identification: When the price is above an MA, it suggests an uptrend, while prices below suggest a downtrend. The slope of the MA also indicates trend momentum.
3. Information Table for Key Data
A customizable information table is displayed on the chart, providing a quick overview of important market data.
Average Daily Range (ADR) Percentage: Shows the average daily range of the asset as a percentage, reflecting its historical volatility.
Distance from EMAs: Displays how far the current price is from the 10, 20, and 50 period Exponential Moving Averages. A positive percentage indicates the price is above the MA, while a negative percentage means it's below.
Customizable Table Elements: Users can choose the table's background color, text color, and text size for optimal readability.
How to Use This Indicator:
This indicator can be a valuable tool for traders using technical analysis:
Inside Bar Breakouts: Inside bars often precede breakouts. Traders can use the inside bar markings and range percentage to identify potential breakout opportunities.
Confirmation of Trends: Moving averages help confirm the direction of the trend, enabling traders to align their inside bar strategies with the prevailing market direction.
Support and Resistance: Moving averages can act as dynamic support and resistance levels. Traders can look for inside bars forming near these levels as potential entry or exit points.
Volatility and Range Analysis: The ADR percentage helps assess the normal daily range of an asset, which can be useful for setting realistic price targets and managing risk.
Risk Management: The distance from EMAs can alert traders to potential overextended moves, providing information for setting stop-loss or take-profit levels.
By combining these elements, this indicator provides a layered approach to market analysis, allowing traders to identify potential trading opportunities and manage risk effectively based on both candlestick patterns and trend-following indicators. Remember that no indicator guarantees success, and it's essential to use this tool in conjunction with other analysis techniques and proper risk management practices.

Inside Bar With Alert - RajThis indicator helps you reduce your screen time by giving you consistent alerts on the formation of inside bar candle and it gives you bullish and bearish alerts on breakout of the mother candle. So if you believe in inside strategy this indicator will be helpful for you.


IL - Inside Bar Detector - v01Indicator: IL - Inside Bar Detector - v01
Product: An Indigo Lynx Indicator
Copyright: © Indigo Lynx, v01, 2025-07-04
Description:
This indicator identifies Inside Bar candlestick patterns, which can signal
consolidation or indecision in the market, often preceding breakouts.
It offers multiple definitions for what constitutes an Inside Bar, an
optional volume filter, and differentiates markers and display for
bullish or bearish closing inside bars.
Features:
- Detects Inside Bar patterns.
- Configurable Inside Bar Definitions (via "Inside Bar Definition" input):
1. "Body (O/C)": Current O/C body within previous O/C body.
2. "Range (H/L - Standard)": Current H/L within previous H/L.
3. "Super (Range & Body)": Requires BOTH conditions.
- Optional Volume Filter: Inside Bar volume < SMA of volume.
- Display Toggles: Separate options to show/hide Bullish closing IBs
and Bearish closing IBs.
- Customizable Visuals: Bar color and optional plotshape markers (differentiated
for bullish/bearish closing inside bars using "BI" and "BRI" text).
- Data Logging: Option to log detected pattern details.
How to Use & Interpret:
- Configure definition, volume filter, and display options.
- Inside Bars are highlighted by bar color if their type (bullish/bearish closing) is enabled.
- Optional shapes: Green up-triangle (BI) for bullish-closing Inside Bars,
Red down-triangle (BRI) for bearish-closing Inside Bars, if enabled.
- Use with other analysis methods for confirmation.
Disclaimer: Trading involves substantial risk of loss and is not suitable for all investors.
Past performance is not indicative of future results.

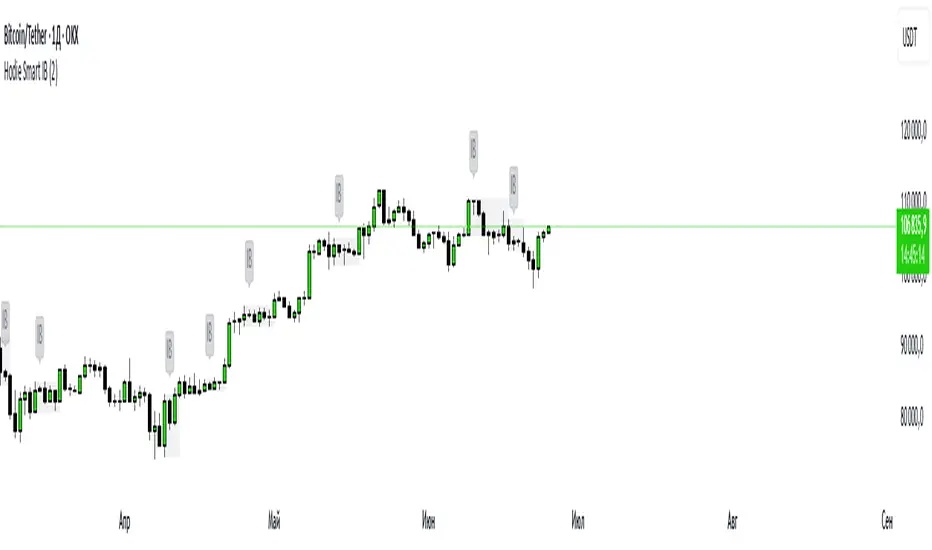
Hodie Smart Inside BarThe Hodie Smart Inside Bar indicator automatically detects and visually highlights inside bars — candles fully contained within the range of the previous (parent) candle.
How the indicator works:
Inside Bar Identification:
The indicator analyzes each candle and checks if its high is lower than the previous candle’s high, and its low is higher than the previous candle’s low. If this condition is met, the candle is considered an inside bar.
Size Filtering:
To filter out small and insignificant consolidations, the indicator compares the size of the parent candle’s range to the inside bar’s range. Only if the parent candle is significantly larger (2 times or more — adjustable parameter), the inside bar is considered significant.
Zone Drawing:
For each detected inside bar, the indicator draws a rectangular zone bounded by the parent candle’s high and low. This zone automatically extends to the right as new bars appear until the price moves outside the parent candle’s range.
Zone Completion:
Once the price closes above the parent candle’s high or below its low, the zone is considered complete and stops extending.
Visual Aids:
If enabled, the indicator can shade the background of the current inside bar for additional visual emphasis.
A label with the text "IB" appears above the inside bar candle on the chart for easier identification.
Alerts:
Supports alerts when a new inside bar forms.
Alerts help traders notice important signals promptly.
To activate, create an alert on the indicator with the condition “New Inside Bar”.
Benefits of the Indicator:
Inside bars often signal consolidation and potential liquidity accumulation, which may be followed by a strong impulsive breakout. This indicator helps traders quickly identify consolidation zones and prepare for possible price moves.
Candle Range Detector by TradeTech AnalysisCandle Range Detector by TradeTech Analysis
This advanced indicator identifies and visualizes price compression zones based on inside bar formations, then tracks how price behaves around those zones — offering valuable insights into liquidity sweeps, range expansions, and trap/mitigation behavior.
The script builds upon the foundational concept of range-based price action, commonly used by institutional traders, and adds automation, mitigation tracking, and sweep detection to map how price reacts around these critical ranges.
🔍 How It Works:
• Range Formation: A new range is detected when the current candle forms entirely within the high and low of the previous candle (i.e., an inside bar). This behavior often indicates price compression and potential breakout zones.
• Range Extension: Once a range is confirmed, the script projects upper and lower boundaries (using either a percentage-based multiplier or Fibonacci log extension), providing context for expected breakout zones.
• Mitigation Tracking: The script continuously monitors whether price breaks above or below the projected extensions, marking that range as mitigated — useful for confirming whether liquidity was absorbed.
• Sweep Detection: If price re-visits a mitigated zone and shows signs of a liquidity sweep (via wick + close behavior), the indicator triggers visual sweep labels and optional alerts.
🧠 Optional Visual Enhancements:
• Highlight range-forming candles with light blue background (toggle on/off)
• Midpoint dotted line for symmetry analysis
• Labels for “Range High” and “Range Low” for visual clarity
• Dynamic box drawing that adapts upon mitigation or continuation
⚙️ Customizable Features:
• Choose between Normal and Fibonacci-based detection modes
• Toggle visibility of range boxes, extension lines, and sweep markers
• Configure sweep alerts, mitigation window size, and visual transparency
⸻
🧪 Use Cases
• Identify consolidation zones before major price moves
• Confirm liquidity sweeps for entry/exit traps
• Visualize and test mitigation behavior of past zones
• Combine with Order Flow or Volume Profile tools to enhance context
⸻
⚠️ This is a fully original implementation that goes beyond classical inside-bar scanners by incorporating mitigation, extension projection, and liquidity sweeps — making it a powerful tool for intraday, swing, and even Smart Money-based trading setups.

AL Brooks - Price Action Multi-Signal Suite📘 Price Action Multi-Signal Suite📘
This indicator is a complete visual toolset for traders who use price action principles inspired by Al Brooks-style analysis.
It combines multiple nuanced signals — like first/second entries, breakout failures, trend bias, higher-timeframe context, and dynamic trend channels — into one elegant, customizable interface.
It is built with clarity, flexibility, and actionable precision in mind.
🧠 Core Concepts Behind the Tool
1. Trend Bias with EMA (20 by default)
The indicator calculates a standard EMA (default: 20) to establish trend direction bias.
When price is above EMA, we consider the market to be in a bull trend, and vice versa.
The EMA line changes color dynamically — green (bull), red (bear), gray (neutral).
🟢 Example:
If price is forming higher highs and staying above EMA with strong bull bars, the bias is bullish. In this phase, you're looking for High 1 and High 2 (H1/H2) setups.
2. First and Second Entries (H1/H2 and L1/L2)
High 1 (H1): First pullback in a bull trend after a minor new high.
High 2 (H2): A second attempt to push up after a failed H1.
Low 1 (L1) and Low 2 (L2): Mirror the above logic for bear trends.
📈 Example Trade – H2 Long:
Price breaks out above EMA.
Pulls back and forms an H1, but it fails to break out.
Second push (H2) forms a higher low, then closes strong above previous bar → BUY entry.
📉 Example Trade – L2 Short:
Market is below EMA.
A rally creates L1, fails.
L2 forms and closes below the previous bar low with a bear body → SELL entry.
3. Second Entry Logic (Simplified Swing Count)
This adds context to H2/L2 by ensuring at least two swings occurred in the same direction.
Reduces false signals in choppy markets.
Painted as colored circles (aqua = long, fuchsia = short).
4. Breakout Failure Detection
Detects false breakouts using 10-bar highs/lows:
Failed High Breakout: Price breaks a 10-bar high but closes back inside → potential reversal short.
Failed Low Breakout: Price breaks a 10-bar low but closes back inside → potential long.
🚨 Example:
Price breaks above a recent high but closes below it with a strong bear bar → look for reversal or fade setups.
5. Inside / Outside Bars
Helps recognize compression (inside bars) or volatility expansions (outside bars).
Inside bars often precede breakouts.
Outside bars may signal traps or indecision.
Use these in combination with entry logic. An H2 after an inside bar can signal a strong, clean breakout.
6. Higher Timeframe (HTF) Context
Pulls EMA and trend bias from a higher timeframe (default: 1hr).
Background color indicates HTF bias (adjustable opacity).
Green = HTF uptrend.
Red = HTF downtrend.
🧭 Usage: Trade in the direction of the HTF bias when possible. An H2 with HTF bias bullish adds confluence.
7. Trend Channels (Automatic, Visual)
Dynamically draws trend channel lines based on pivot highs/lows.
These act as support/resistance, visual guides for traps or continuation.
Trendline breakouts or touches often align with H2/L2 setups.
📏 Example:
Price touches lower channel and forms a second entry long (L2) with a strong bull bar → high-quality reversal trade.
⚙️ Customization Options
Toggle each signal component (entries, bias, bars, failures, channels).
Adjust EMA length, HTF resolution, background opacity.
Keep your chart clean and focused on the signals that matter to you.
📊 Trade Example Summary
H2 with HTF Bullish
Trade Setup: Strong bull bar after a failed H1, above EMA
Expected Move: Trend continuation upward
L2 with Channel Hit
Trade Setup: Pullback hits lower trend channel, forms L2
Expected Move: Reversal or scalp down
Failed High Breakout
Trade Setup: Price breaks above a 10-bar high, but reverses and closes inside
Expected Move: Quick fade or reversal short
Inside Bar + H2
Trade Setup: Price compresses into an inside bar, followed by a breakout with H2
Expected Move: Momentum breakout trade
Outside Bar + L2
Trade Setup: Price breaks strongly in one direction (outside bar), second push fails upward, forms L2
Expected Move: Short on weakness
Please note, this is an educational idea and representation of whatever I understood of it.
Historical performances may not be replicable in present/future.
Trade at your own responsibility.
Regards! ^^

Inside Bar/Outside Bar/Mother Bar Box By SmartTrader888This Indicator shows:
1. Inside Bar
2. Outside Bar
3. Mother Bar box (Box the mother bar and all subsequent inside bars)
This indicator handles correctly the edge conditions such as:
1. bar close = bar open
2. current bar low equals to mother bar low or current bar high equals mother bar high
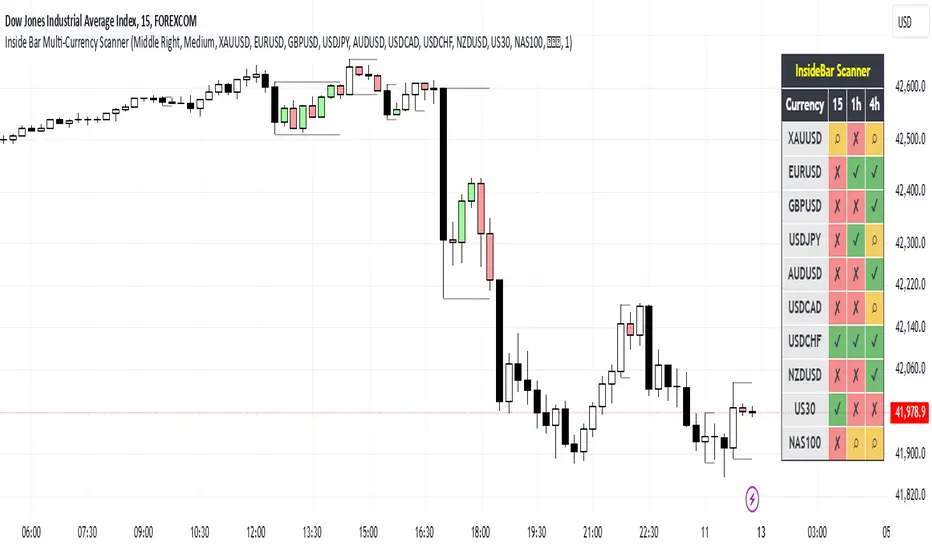
Inside Bar Multi-Currency ScannerDescription:
This script is an Inside Bar Scanner that allows you to monitor multiple currency pairs across different timeframes (15 minutes, 1 hour, and 4 hours). Its main features include:
Inside Bar Detection:
An Inside Bar is a candlestick where both the High and Low are within the range of the previous candle.
The script automatically identifies Inside Bars and displays the results in a table.
Customizable Timeframes:
Supports scanning in 15-minute, 1-hour, and 4-hour timeframes.
Results are displayed for each timeframe separately.
Multi-Currency Support:
Scan up to 10 currency pairs simultaneously.
Currency pairs are customizable and selected by the user.
Candle Coloring:
Inside Bars are highlighted with colors:
Semi-transparent green for bullish Inside Bars.
Semi-transparent red for bearish Inside Bars.
Colors are customizable and selected by the user.
Alerts:
Custom alerts for detecting Inside Bars in selected timeframes.
Receive notifications when an Inside Bar is detected in any of the selected currency pairs.
How to Use:
Select your desired currency pairs from the Scanner Currencies section.
Enable your preferred timeframes in the Scanner Timeframe section.
The script will display a table of results with Inside Bar information for each currency pair and timeframe.
Optionally, customize the candle colors in the Scanner InsideBar Color section.
Additional Explanation for Timeframe Status:
In each selected timeframe, there are three possible states for the candles:
Previous Candle is an Inside Bar:
Displayed with a green background and the symbol ✔.
Previous Candle is NOT an Inside Bar:
Displayed with a red background and the symbol ✘.
Current Candle is an Inside Bar:
Displayed with an orange background and the symbol ⌕.
These visual indicators provide a clear and quick overview of the Inside Bar status for each selected currency pair and timeframe.