Adaptive Support and Resistance LevelsAdaptive Support and Resistance Levels
This indicator is a comprehensive institutional-grade trading tool designed to visualize Auction Market Theory (AMT), Support and Resistance concepts directly on the price chart. It is built for traders who require a deep understanding of market structure without the visual clutter of standard retail indicators.
Key Features:
1] Fractal Adaptive Engine:
The indicator automatically adjusts its calculations based on your timeframe.
-Intraday (1m-15m): Displays Daily Levels.
-Swing/Positional (30m-1H): Displays Weekly Levels.
-Long Term (Daily+): Displays Monthly Levels.
2]Untested Levels:
-Identifies levels from previous sessions that have not been tested by price.
-Extends these levels forward as "Magnets" until price touches them.
-Touch-Delete Logic: Once price interacts with a magnet, the line is automatically removed to keep the chart clean.
3] Institutional Dashboard:
- A "Flight Deck" table in the top-right corner provides real-time metrics:
-Context: Are we inside, above, or below the previous value zone?
-Auction State: Is the current market balanced or imbalanced?
-IB Status: Initial Balance (first 60 mins) breakout/breakdown status.
-Fuel Gauge: Measures current range vs. ADR (Average Daily Range) to gauge exhaustion.
-Volume Flow: Detects high-aggression volume relative to the average.
How to Use:
Trend Following: Look for price breaking out of the (Static Lines) , Pullback rejection, Rejection from the lines.
Reversion: Use the lower lines for bulls reversal and Upper lines for bears reversal ( Kind of reversal candle formation )
Risk Management: Use the ADR Fuel Gauge to avoid buying extended markets (>100% ADR).
Disclaimer: This tool is only for educational and analytical purposes only. Not any recommendation.
Intradaytrading

Day Trading Astra by Pooja📌 Day Trading Astra by Pooja
Day Trading Astra by Pooja is specily designed for F&O Traders, a clean and fast momentum-shift indicator designed to support day traders with clear entry signals and structured filtering.
It uses a refined RSI–MA crossover engine, allowing traders to visualize momentum transitions directly on the price chart with minimal clutter.
✨ Key Features
🔶 1. RSI–MA Crossover Engine
Identifies potential momentum shifts using a fast RSI and smoothed RSI-MA baseline.
🔶 2. Clean BUY/SELL Chart Signals
Markers appear directly on the candle chart—easy to read, no extra panes.
🔶 3. Smart Filtering System (Optional)
To help reduce low-quality signals in uncertain conditions:
ADX trend-strength filter
ATR volatility check
Slope validation
Minimum bars between two signals
🔶 4. Alert + Webhook Ready
Supports TradingView alerts and webhook integration for automation tools.
Each alert includes symbol, direction, price, timestamp, unique ID, and an optional secret key for secure execution.
🔶 5. Multi-Timeframe Flexible
Works across all timeframes; users can apply it according to their day-trading style.
📝 How to Use
Add indicator to chart.
Select your preferred filters or use default settings.
Enable alerts if automated notifications are needed.
Combine with your own risk management and trading framework.
This tool is meant to support analysis, not replace personal judgment.
⚠️ Disclaimer
This script is a technical analysis tool and not financial advice.
Results vary depending on market conditions and user settings.
No indicator can guarantee profits or eliminate risk.
Always test settings before applying them in live markets.
The user is fully responsible for all trading decisions.
⭐ Summary
A clean, fast, and structured momentum-entry tool designed to help day traders identify potential intraday shifts with clarity and alert support.

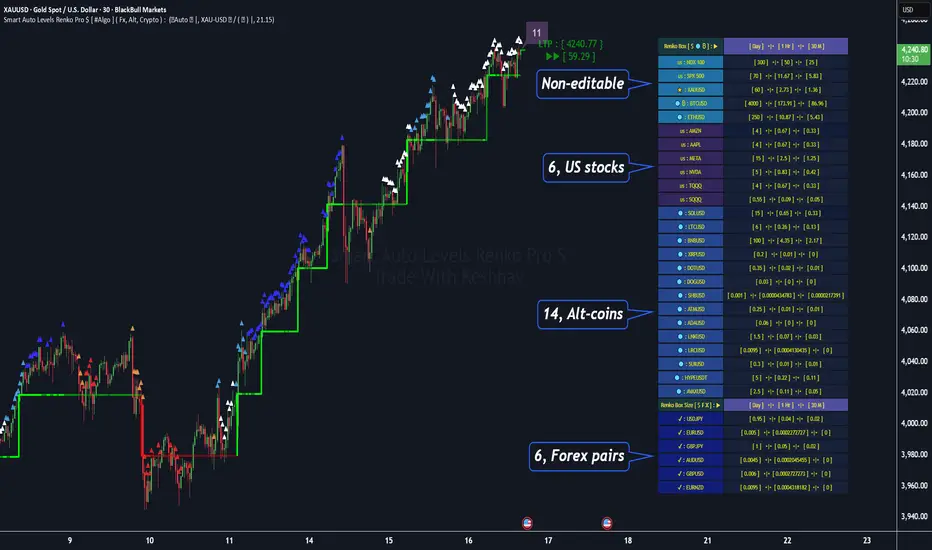
Smart Auto Levels Renko Pro $ [ #Algo ] ( Fx, Alt, Crypto ) : Smart Levels is Smart Trades 🏆
"Smart Auto Levels Renko Pro $ ( Fx, Alt, Crypto ) " indicator is specially designed for " Crypto, Altcoins, Forex pairs, and US exchange" . It gives more power to day traders, pull-back / reverse trend traders / scalpers & trend analysts. This indicator plots the key smart levels , which will be automatically drawn at the session's start or during the session, if specific input is selected.
🔶 Usage and Settings :
A :
⇓ ( *refer 📷 image ) ⇓
B :
⇓ ( *refer 📷 images ) ⇓
🔷 Features :
a : automated smart levels with #algo compatibility.
b : plots Trend strength ▲, and current candle strength count value label.
c : ▄▀ RENKO Emulator engine ( plots *Non-repaintable #renko data as a line chart over the standard chart).
d : session 1st candle's High, Low & 50% levels ( irrespective of chart time-frame ).
e : 1-hour High & Low levels of specific candle ( from the drop-down menu ), for any global
market crypto / altcoins / forex or USA exchange symbols.
f : previous Day / Week / Month, chart High & Low.
g : pivot point levels of the Daily, Weekly & Monthly charts.
h : 2 class types of ⏰ alerts ( only signals or #algo execution ).
i : auto RENKO box size (ATR-based) table for 31 symbols (5 Default non-editable symbols,
6 US exchange symbols, 14 Alt-coins, 6 Forex pairs.)
j : auto processes " daylight saving time 🌓" data and plots accordingly.
💠Note: "For key smart levels, it processes data from a customized time frame, which is not available for the *free Trading View subscription users , and requires a premium plan." By this indicator, you have an edge over the paid subscription plan users and can automatically plot the Non-repaintable RENKO emulator for the current chart on the Trading View free Plan for any time-frame ."
⬇ Take a deep dive 👁️🗨️ into the Smart levels trading Basic Demonstration ⬇
▄▀ 1: "RENKO Emulator Engine" ⭐ , plots a noiseless chart for easy Top/Bottom set-up analysis. 11 types of 💼 asset classes options available in the drop-down menu.
LTP is tagged to the current RSI value ➕ volatility color change for instant quick decisions.
⇓ ( *refer 📷 image ) ⇓
🟣 2: "Trend Strength ▲ Label with color condition.
The strength of the trend will be shown as a number label ( for the current candle ), and the ▲ color format represents the strength of the trend. Can be utilized as an Entry or Exit condition.
⇓ ( *refer 📷 image ) ⇓
🟠 3: plots "Session first candle High, low, and 50%" levels ( irrespective of chart time-frame ), which are critical levels for an intraday trader with add-on levels of Previous Day, Week & Month High and Low levels.
⇓ ( *refer 📷 image ) ⇓
🔵 4: plots "Hourly chart candle" High & Low levels for the specific candles, selected from the drop-down menu with Pivot Points levels of Daily, Weekly, Monthly chart.
⇓ ( *refer 📷 image ) ⇓
🔲 5: "Auto RENKO box size" ( ATR based ) : This indicator is specially designed for 'Renko' trading enthusiasts, where the Box size of the ' Renko chart ' for intraday or swing trading ( ATR based ) , automatically calculated for the selected ( editable ) symbols in the table.
⇓ ( *refer 📷 image ) ⇓
*NOTE :
Table symbols (Non-editable) for 2 USA index, XAU, BTC, ETH.
Symbols (editable) for USA index/stocks.
Table Symbols (editable) for alt-coins.
Table Symbols (editable) for Forex pairs.
⏰ 6: "Alert functions."
⇓ ( *refer 📷 image ) ⇓
◻ : Total 7 signal alerts can be possible in a Single alert.
◻ : Total 10 #algo alerts , ( must ✔ tick the Consent check box for algo execution ).
Note: : alert with RSI ( *manual ✍ input value ) condition.
After selecting alert/alerts ( signals 7 / #algo 10 ), an additional RSI condition can also be used as an input to trigger the alert.
ex: alert = { 🟠 𝟭 Hr 🕯 H & L ➕ ✅ RSI✍ } condition, will trigger the alert when both conditions meet simultaneously.
This Indicator will work like a Trading System . It is different from other indicators, which give Signals only. This script is designed to be tailored to your personal trading style by combining user input components to create your own comprehensive strategy . The synergy between the components is key to its usefulness.
🚀 It focuses on the key Smart Levels and gives you an Extra edge over others.
✅ HOW TO GET ACCESS :
You can see the Author's instructions below to get instant access to this indicator & our premium indicator suites. If you like any of my Invite-Only indicators, kindly DM and let me know!
⚠ RISK DISCLAIMER :
All content provided by "@TradeWithKeshhav" is for informational & educational purposes only.
It does not constitute any financial advice or a solicitation to buy or sell any securities of any type. All investments / trading involve risks. Past performance does not guarantee future results / returns.
Regards :
Team @TradeWithKeshhav
Happy trading and investing!
Futures Playbook: VWAP + OR + Cross-Asset TellsFutures Playbook: VWAP + OR + Cross-Asset Tells (with Trade Messages + Coach Panel)
This all-in-one futures trading toolkit combines Opening Range (OR) levels, VWAP, and cross-asset signals to help traders quickly read intraday structure, manage execution, and filter noise.
Core Features
• Opening Range (OR):
• Customizable OR window with High/Low and Midpoint.
• Automatic shading of the OR zone.
• VWAP & Bands:
• Built-in or session-anchored VWAP.
• Optional standard deviation bands for context.
• Cross-Asset Tells:
• Live reads on US 10Y yield, DXY, Crude, and Gold.
• Regime detection: rates risk, USD strength, energy softness, and real-rate easing.
• Confirmations:
• Volume vs. moving average filter.
• Cumulative delta with smoothing.
• ATR-based chop filter to avoid low-quality trends.
Trade Messages + Coach Panel
• Trade Messages (labels): Automatic on-chart prompts for OR completion, VWAP reclaim/loss, long/short setups, and EU close flows.
• Coach Panel (table): Real-time dashboard with regime context, directional bias, execution notes, risk reminders, and key levels (ORH, ORL, VWAP).
Alerts
• OR breakout (long/short with confirmations).
• VWAP reclaim or loss.
• 10Y yield crossing risk threshold.
Use Case
Designed for futures traders and scalpers who rely on VWAP + OR dynamics and need cross-asset confirmation before committing to trades. Great for structuring entries, managing risk, and filtering market noise throughout the session.

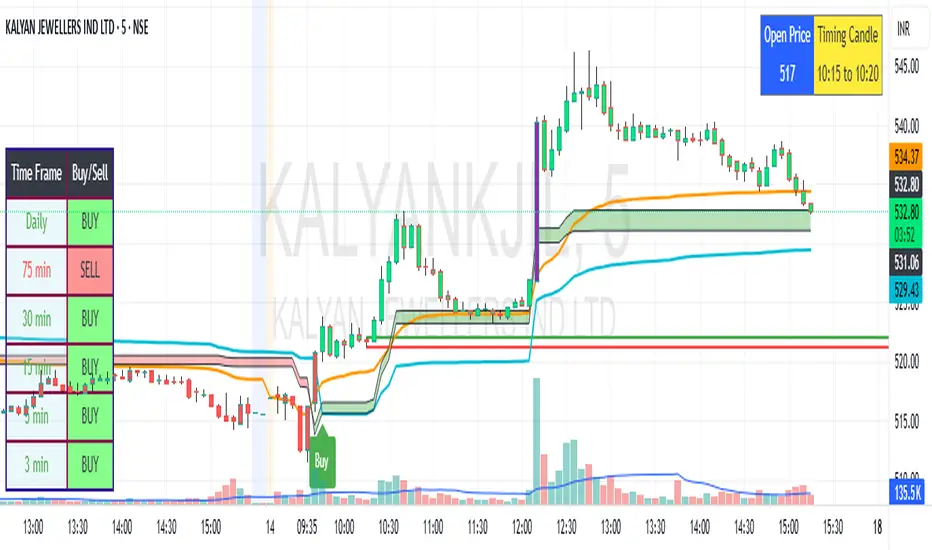
SBMS Timing Candle(5m) + Guru Candle(1m)-V1This indicator gives the 5m timing candle based on the current script trading and you can trade based on the range of the candle and follow-up price action, it gives idea about the trend to follow and Guru candle shown in 1m similar study for that price range can be applied for intraday trading decisions. You need to use ETH in 5m for showing Timing candle.
TradeJorno - Time + Price Levels
Tired of manually drawing and updating important ICT or SMC time and price levels on your charts every day?
Here’s an indicator to draw important TIME and PRICE levels automatically.
Here’s what you can highlight in realtime on your charts:
1. Previous major highs and lows
⁃ Previous daily and weekly highs and low
- Weekly dividing lines
2. Session highs/lows
⁃ Plot the high and low of Asia and London sessions.
⁃ Customise the timeframe and appearance on the chart.
- Previous session settlement price.
3. Various price levels
⁃ Pre-market opening prices : midnight, 7:30 and 8:30
⁃ Regular market opening prices: 9:30, 10:00, 14:00
- end of session settlement prices
4. Market opening range high and low
⁃ Lines extending throughout the current session
⁃ Customise the timeframe and appearance on the chart.
5. ICT Macro times
- Draw customisable vertical lines and labels to indicate the start of each ICT macro
period.
Let us know in the comments below if there’s anything else we need to add!

HTF Candle Overlay with Probability
Visualize Higher Timeframe Candles with Predictive Insights
This tool reconstructs higher-timeframe (HTF) candles using 1-minute bars and overlays them directly on your chart. It includes:
Wick + Body rendering for grouped HTF candles (e.g. 10m, 15m, etc.)
A dynamic label showing the probability of the current HTF candle closing bullish
Real-time updates and smart fading based on candle progress
Configurable colors for fills, outlines, and labels
🔧 Customizable Options:
Candle size (e.g. 10m, 15m)
Body fill and border color
Wick fill and border color
Label text/background color
Whether you're a scalper watching larger structure or a PA trader looking for confluence, this overlay gives you predictive insight where it matters: on the candle that's still forming.

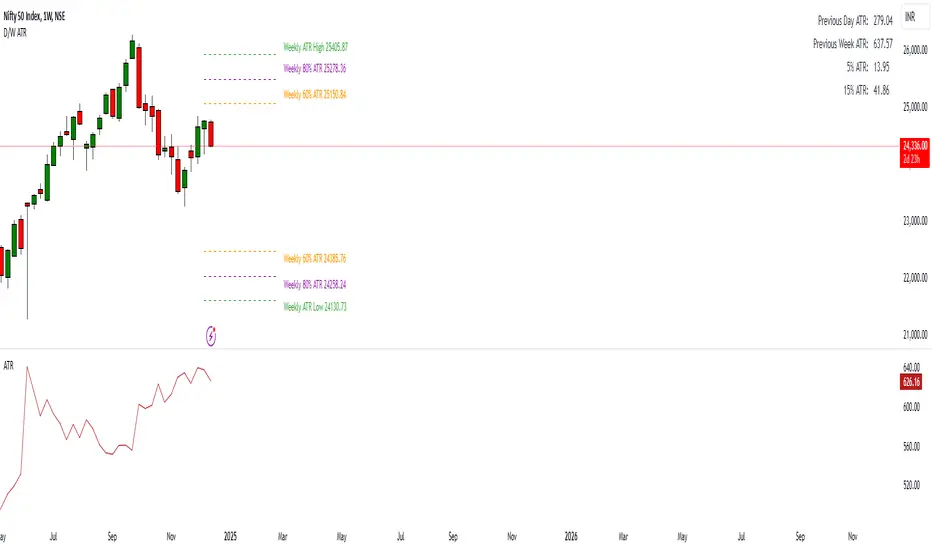
Daily ATR Levels - Vishal SubandhThe following script visualizes the ATR High and ATR Low levels based on the previous day’s closing price. The Average True Range (ATR) indicates how much a stock is likely to move—upward or downward—on a given day, providing insight into its intraday volatility. Additionally, the script calculates and displays the daily ATR as a percentage, with specific levels marked at 60% and 80%.
These percentage levels are plotted for both the high and low ranges, offering a framework to analyze potential price movements. In the context of a strong trend, prices often extend to the 80% or even 100% ATR level before showing signs of reversal. Such behavior is observed during pronounced uptrends or downtrends. Conversely, during weaker trends, price reversals may occur at the 60% ATR levels.
It is recommended to use this analysis in conjunction with other tools, such as support and resistance levels or demand and supply zones, for a more comprehensive approach to trading.
Support & Resistance AI LevelScopeSupport & Resistance AI LevelScope
Support & Resistance AI LevelScope is an advanced, AI-driven tool that automatically detects and highlights key support and resistance levels on your chart. This indicator leverages smart algorithms to pinpoint the most impactful levels, providing traders with a precise, real-time view of critical price boundaries. Save time and enhance your trading edge with effortless, intelligent support and resistance identification.
Key Features:
AI-Powered Level Detection: The LevelScope algorithm continuously analyzes price action, dynamically plotting support and resistance levels based on recent highs and lows across your chosen timeframe.
Sensitivity Control: Customize the sensitivity to display either major levels for a macro view or more frequent levels for detailed intraday analysis. Easily adjust to suit any trading style or market condition.
Level Strength Differentiation: Instantly recognize the strength of each level with visual cues based on how often price has touched each one. Stronger levels are emphasized, highlighting areas with higher significance, while weaker levels are marked subtly.
Customizable Visuals: Tailor the look of your chart with customizable color schemes and line thickness options for strong and weak levels, ensuring clear visibility without clutter.
Proximity Alerts: Receive alerts when price approaches key support or resistance, giving you a heads-up for potential market reactions and trading opportunities.
Who It’s For:
Whether you're a day trader, swing trader, or just want a quick, AI-driven way to identify high-probability levels on your chart, Support & Resistance AI LevelScope is designed to keep you focused and informed. This indicator is the perfect addition to any trader’s toolkit, empowering you to make more confident, data-backed trading decisions with ease.
Upgrade your analysis with AI-powered support and resistance—no more manual lines, only smart levels!

Entropy-Based Adaptive SuperTrendOverview:
Introducing the Entropy-Based Adaptive SuperTrend – a groundbreaking trading indicator designed to adapt dynamically to market conditions using market entropy. This enhanced SuperTrend indicator adjusts its sensitivity according to the level of chaos (or order) in price movements, providing more stable signals during volatile periods and more responsive signals when the market becomes orderly.
Key Features:
Entropy-Adaptive Mechanism: By incorporating an entropy measure, this indicator estimates the degree of unpredictability in the market. During high entropy periods (more chaotic), signals are made less sensitive, while during low entropy periods, the indicator reacts more quickly to price changes.
Adaptive ATR Multiplier: Unlike traditional SuperTrend indicators that use a fixed ATR multiplier, this version calculates a dynamic ATR multiplier based on the entropy score, ensuring more flexibility and adaptability in setting stop levels.
Visual Clarity: The indicator is overlayed on the price chart with customizable visual elements. The bullish and bearish trends are color-coded for ease of use, and optional entry signals ("L" for long and "S" for short) are plotted to clearly mark potential entry opportunities.
Alerts for Key Opportunities : Never miss an opportunity with built-in alerts for buy and sell signals. Traders can easily configure these alerts to be notified instantly when market conditions trigger a new trend.
How It Works:
Entropy Calculation: The entropy of the price data is calculated over a user-defined period, giving an indication of the degree of randomness in the price movements. The result is then smoothed to reduce noise and create a meaningful trend indication.
Dynamic ATR Adjustment: The ATR (Average True Range) multiplier, which controls the distance of the trailing stop, is adjusted based on the entropy score. This allows the SuperTrend line to widen in chaotic times, reducing false signals, while tightening in orderly times, allowing quicker trend captures.
Parameters Explained:
Entropy Settings: Control the sensitivity of entropy calculations, including the look-back period, number of bins for price distribution, and smoothing length.
Adaptive Settings: Adjust how the indicator adapts to different levels of entropy, including the adaptation period and the filtering weight.
SuperTrend Settings : Customize the ATR period and the dynamic multiplier range to fine-tune the trailing stops for your trading style.
Visual Settings: Choose your preferred colors for bullish and bearish trends, and decide if you want the entry labels displayed directly on the chart.
Use Cases:
Swing Traders can utilize the indicator to capture trend reversals while filtering out the noise during high entropy periods.
Intraday Traders can adapt the settings for shorter time frames to benefit from dynamic adjustments that reduce overtrading and false signals.
Risk Management: The entropy-based adaptive feature provides an edge in risk management by reducing sensitivity during times of increased chaos, thus helping to limit unnecessary trades.
How to Use It:
Look for entry labels ("L" for long, "S" for short) to identify potential opportunities.
Use the color-coded trendlines to determine market bias: greenish hue for bullish trends, reddish hue for bearish trends.
Customize the input settings to align with your preferred market timeframe and risk profile.
Alerts & Notifications:
Built-in alerts notify you of significant trend changes. Simply enable these alerts to receive updates when a new long or short opportunity is detected, helping you stay ahead without needing to watch the screen constantly.
Customization Tips:
Longer Timeframes : Increase the Entropy Period to better capture macro trends in high timeframe charts.
Higher Volatility Markets: Increase the ATR Max Multiplier to ensure stops are set farther away during high entropy.
Lower Volatility Markets: Use a lower ATR Base Multiplier and tighter entropy thresholds to capture rapid price movements.
Final Thoughts:
The Entropy-Based Adaptive SuperTrend indicator merges traditional trend-following logic with an adaptive mechanism driven by market entropy, aiming to address the challenges of whipsaws and false signals common in conventional SuperTrend setups. This indicator offers an intelligent and flexible way to track market trends, suitable for both beginners and experienced trade

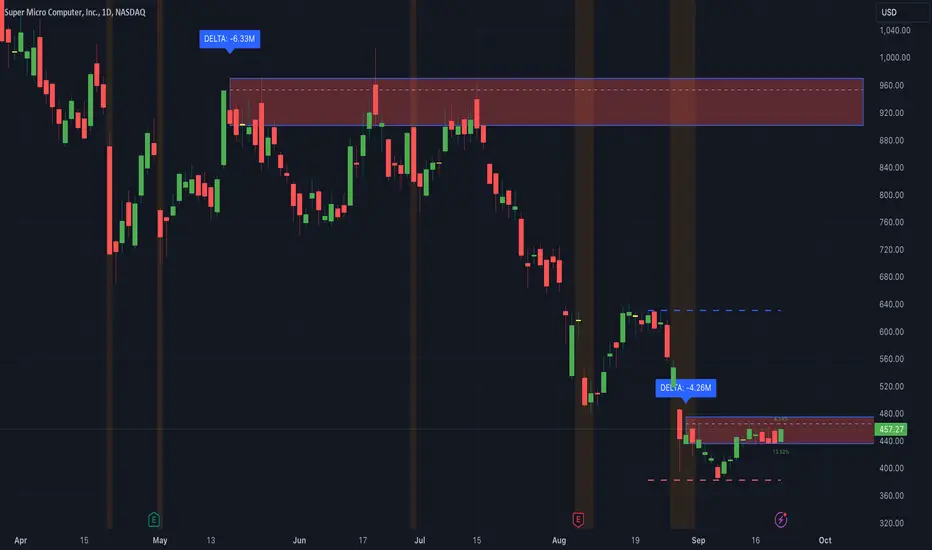
Thrax - Intraday Market Pressure ZonesTHRAX - INTRADAY MARKET PRESSURE ZONES
This indicator identifies potential support and resistance zones based on areas of significant market pressure. It dynamically plots these zones and adjusts their visibility based on real-time price action and user-defined thresholds. The indicator is useful for traders seeking to understand intraday market pressure, visualize zones of potential price reversals, and analyze volume imbalances at critical levels.
1. Support/Resistance Zones: Wherever the price retraces significantly from its high a support zone is drawn and when it retraces significantly from it low a resistance zone is drawn. The significant retracing is measured by the wick threshold percentage. For instance, if set to 75%, it implies price retracement of 75% either from high or from low for a particular candel
Volume delat: Displays volume delta information where the zones are formed. This can be used by trader to consider only those zones where delta is significant.
2. Breakout Detection: Monitors for price breakouts beyond established zones, deleting zones that are invalidated by price movement. when the price breaks a given zone with the threshold, it is considered to be mitigated and chances of trend continuation is decent.
Candle Coloring: Uses color codes (green, red, and yellow) to represent bullish, bearish, and indecisive (doji) candles, aiding quick visual assessment.
INPUTS
1. Wick Threshold (%) : Sets the minimum wick percentage required for a candle to be considered a support or resistance candidate.
2. Breakout Threshold (%) : Determines the percentage above or below a support or resistance zone that defines a breakout condition. if breaks a zone with the set threshold then the zone will be considered mititgated.
3. Max Number of Support/Resistance Zones : Limits the maximum number of support/resistance zones displayed on the chart, ranging from 1 to 5.
4. Show Wick Percentage Labels : Toggles the display of percentage values for upper and lower wicks on each candle.
TRADE SETUP
Identifying Entry Points: Look for the formation of support or resistance zones. Wait for price to retrace to these zones. if you are willing to take risk, you can consider even zones with low delta. If you want to be more cautious you should consider zones with high delta.
Volume Confirmation: Use the volume information to confirm the strength of the zone. Strong volume differences (displayed as labels) can indicate significant market pressure at these levels.
Breakout Trades: If price breaks through a support/resistance zone by more than the breakout threshold, consider this a signal for a potential trend continuation in the breakout direction.
Risk Management: Set stop-loss levels slightly outside of the identified zones to minimize risk in case of false breakouts. This can be set in input setting for breakout threshold.
Bonus Tip : Mark your significant highs and lows from where prices have retraced multiple times in the near past and if the zone is near these levels it can serve s a strong candidate of support or resistance
Therefore, in conclusion monitor the zones, based on delta and volume presence filter out the zone, wait for price retracement to the zone, intiate the trade with stop loss below zone with a set percentage.
Market Internals: VolumeThe indicator plots the total volume of the NYSE and NASDAQ exchanges and identifies periods with significant asymmetry between Up Volume and Down Volume. It can be used as an additional tool to confirm broad market sentiment.
Chart shows Total Volume (TVOL) bars for SPY daily chart. Green bars for UVOL>>DVOL, Red for DVOL>>UVOL. Neutral bars are gray. Blue line shows median TVOL.
Rationale:
Up Volume (UVOL) and Down Volume (DVOL) represent the total volume of stocks that have increased or decreased in price, respectively, compared to the previous session's closing price. The magnitude of the price change is irrelevant.
When UVOL is significantly higher than DVOL, it indicates a prevailing buying sentiment in the broad market. Conversely, when DVOL is higher, it signals prevailing selling sentiment.
Occasionally, the UVOL/DVOL (VOLD) ratio may be misaligned with the movement of the S&P index. The picture below illustrates an example of a day when the S&P declined, yet the UVOL was twice larger than DVOL. Such a divergence can suggest that the S&P was pulled down by a decline in a few large-cap stocks, while the broader market remained positive. In this case, the divergence led to a continuation of the rally.
Thus, VOLD, when combined with volume analysis, can be an effective tool for confirming market trends.
Parameters:
VOLD Ratio – minimum ratio of UVOL/DVOL or DVOL/UVOL. Indicator will color code volume columns when condition is true (“green” means buying; “red” selling).
Median Length – number of periods to calculate median TVOL.
Show Divergencies – indicator marks divergencies between price and volume sentiments on the main chart. Only works for SPY chart.
Users can also choose which exchanges (NASDAQ/NYSE) to use for volume calculation.
Notes:
Volume is shown in millions of contracts
Indicator should be used on the daily or higher timeframes. It won't work properly on the intraday charts
Disclaimer
This indicator should not be used as a standalone tool to make trading decisions but only in conjunction with other technical analysis methods.

Periodic Moving AveragesIndicator plots three simple moving averages (MA) that are reset at the beginning of period, specified by a user.
Red MA is based on highs
Blue MA is based on close
Green MA one is based on lows.
Moving averages often act as support /resistance levels. They can also help to identify intraday trend. It is important to realize that none of the moving averages is universal as price behavior changes from day to day. On the chart I’ve highlighted several occurrences when one of MAs (different ones) provided support for price.
Parameters:
PERIOD – period for which MAs are plotted. They are reset at the beginning of each period. Period cannot be lower than chart’s timeframe
LENGTH – length of moving averages. If set to 0 then parameter is ignored and MAs are calculated on all bars, available in the period
VWAP? – if checked then moving averages will be calculated as volume weighted price
Disclaimer
This indicator should not be used as a standalone tool to make trading decisions but only in conjunction with other technical analysis methods.

Arbitrage Spread v2 : 3 pairs + 3 charts [Arby.Trade]
This indicator allows you to track in real time the change in the spread (the difference in the exchange rate) between two assets for three trading pairs at the same time.
How does the indicator work?
In the indicator settings menu, the user selects two trading pairs, for example BTCUSDT on the Binance exchange and BTCUSDT on the Bybit exchange, after which the script will receive prices from both exchanges and compare them with each other, calculating the percentage deviation between prices (spread). This setting can be made for three trading pairs. Keep in mind that the script can only work with those assets and exchanges that are on board TradingView, and this is quite a lot.
According to the calculated value of spreads, the spread lines for three trading pairs are displayed on the screen. The spread lines move between values above zero and below. When the spread line is below zero, it means that the price of the asset on the first exchange is less than on the second. That is, by buying an asset on the first exchange and selling it on the second one, you can earn money (of course, it is important to take into account the commissions of the exchanges for these transactions). When the spread line is above zero, the opposite is true. When the spread is zero, the prices on both exchanges are the same and there is no arbitrage situation.
Indicator settings.
For a better visual representation of the current spread value, the indicator has the ability to set two threshold spread levels. The first threshold level is the level below which the spread is not interesting to the trader and he will not consider arbitrage deals. The second threshold level is the level of a particularly high spread. When the spread value exceeds the second threshold level, the spread values will be signed above the spread line, and the extreme values for the user-defined period of bars back will be additionally highlighted in a brighter color. Both threshold levels are displayed on the chart and the user can change their values in the indicator settings menu.
The script allows you to leave only one spread line on the chart for one of the three trading pairs, while maintaining the display of indicator tables for three trading pairs. The script also allows you to completely disable the display of unnecessary trading pairs.
If the volatility of the spread lines is too high and the spread lines from different trading pairs overlap each other, use the "Distance between charts" setting and increase its value until the display of all three charts becomes comfortable.
Alerts.
Additionally, you can set the threshold value of the spread, at which the script will send notifications from TradingView. We called it the Spread Signal Threshold. This threshold level has nothing to do with the visual thresholds described above. You can set a signal level exceeding the second visual threshold or make it lower, but it is important to understand that TradingView alerts will only be triggered if the Spread Signal Threshold is exceeded. This threshold level is common to all trading pairs, so notifications will be sent when this spread level is reached for any of the three trading pairs.
To set up alerts, open the "Alerts" tab in the TradingView menu on the right. Click the "Create Alert" button. Then, in the window that opens, select this indicator in the "Condition" line. After that, you can set a name for this alert and complete the notification setup by clicking the "Create" button.
We, the authors of this script, have been engaged in cryptocurrency arbitrage for a long time and, first of all, created it for ourselves and our daily arbitrage trading, but this does not prevent you from using it at your discretion for any types of assets and in any markets.
We have a lighter version of the indicator that allows you to track the spread for only one trading pair. If this indicator seems too heavy for you and your device, you can use a lighter version .
If, on the contrary, the capabilities of your hardware allow, do not forget that you can always add several copies of this indicator to your screen and simultaneously track not 3, but 6-9-12 and so on arbitrage pairs at the same time. ;)
--
Данный индикатор позволяет отслеживать в реальном времени изменение спреда (разницы в курсе) между двумя активами по трем торговым парам.
Как устроен индикатор?
В меню настроек индикатора пользователь выбирает две торговые пары, например BTCUSDT на бирже Binance и BTCUSDT на бирже Bybit, после чего скрипт получит цены с обеих бирж и сравнит их между собой, рассчитав процентное отклонение между ценами (спред). Такую настройку можно произвести для трех торговых пар. Учитывайте, что скрипт может работать только с теми активами и биржами, которые есть на борту TradingView, и это не мало.
По рассчитанному значению спредов на экран выводится линии спредов по трем торговым парам. Линии спредов двигаются между значениями то выше нуля, то ниже. Когда линия спреда ниже нуля это значит что цена на актив на первой бирже меньше, чем на второй. То есть, купив актив на первой бирже и продав его на второй можно заработать (конечно при этом важно учитывать комиссии бирж на совершение данных сделок). Когда линия спреда выше нуля - наоборот. Когда спред равен нулю - цены на обеих биржах одинаковы и арбитражная ситуация отсутствует.
Настройки индикатора.
Для лучшего визуального представления о текущем значении спреда индикатор имеет возможность задать два пороговых уровня спреда. Первый пороговый уровень – это уровень, ниже которого спред не интересен трейдеру и он не будет рассматривать арбитражные сделки. Второй пороговый уровень – это уровень особенно повышенного спреда. Когда значение спреда превышает второй пороговый уровень над линией спреда будут подписаны значения спреда, а экстремальные значения за заданный пользователем период баров назад будут дополнительно выделены более ярким цветом. Оба пороговых уровня отображаются на графике и пользователь может менять их значения в меню настроек индикатора.
Скрипт позволяет оставить на графике только одну линию спреда по одной из трех торговых пар, при этом сохранив отображение индикаторных таблиц по трем торговым парам. Также скрипт позволяет полностью отключить отображение ненужных торговых пар.
Если волатильность линий спреда слишком высока и линии спреда от разных торговых пар накладываются друг на друга воспользуйтесь настройкой «Distance between charts» и увеличивайте ее значение до тех пор пока отображение всех трех графиков не станет комфортным.
Уведомления.
Дополнительно можно настроить пороговое значение спреда, при достижении которого скрипт будет отправлять уведомления от TradingView. Мы назвали это Spread Signal Threshold. Этот пороговый уровень никак не связан с визуальными пороговыми уровнями, описанными выше. Вы можете задать сигнальный уровень превышающий второй визуальный пороговый уровень или сделать его ниже, но важно понимать, что оповещения TradingView будут срабатывать только от превышения именно Spread Signal Threshold. Этот пороговый уровень является общим для всех торговых пар, поэтому уведомления будут приходить при достижении этого уровня спреда по любой из трех торговых пар.
Для настройки оповещений откройте вкладку «Оповещения» в меню TradingView справа. Нажмите кнопку «Создать оповещение». Затем в открывшемся окне в строке «Условие» выберете данный индикатор. После чего вы можете задать название данному оповещению и завершить настройку оповещения, нажав кнопку «Создать».
Мы, авторы данного скрипта, давно занимаемся арбитражем криптовалюты и, в первую очередь, создавали его для себя и своей каждодневной арбитражной торговли, но это не мешает вам использовать его по своему усмотрению для любых видов активов и на любых рынках.
У нас есть более легкая версия индикатора, позволяющая отслеживать спред только по одной торговой паре. Если данный индикатор покажется для вас и вашего устройства слишком тяжелым вы можете воспользоваться более легкой версией .
Если, наоборот, возможности вашего железа позволяют, не забывайте, что вы всегда можете добавить себе на экран несколько копий этого индикатора и отслеживать одновременно не 3, а 6-9-12 и тд арбитражных пар одновременно. ;)

Apeiron Jail RangeThe Apeiron Jail Range is an experimental use of proprietary standard deviation calculations.
It calculates price standard deviations based of previous data & a MA, which it applies and anchors to an automatically (can also be done manually) selected TF open. Finally, the standard deviation bands are plotted and create a "Jail" range with up to 12 levels (6 above and 6 below) that can potentially work as support and resistance during the TF period anchor time.
The indicator is meant to help traders identify potential support and resistance levels which can then be used in confluence with other indicators and strategies. It can also be potentially used for testing automation strategies such as grid trading.
The anchor time and the lenght of the MA used for the calculation can be manually or automatically selected.
The example shown uses the same indicator twice to show all levels from 0.5 - 1 - 1.5 ... 5.5 - 6

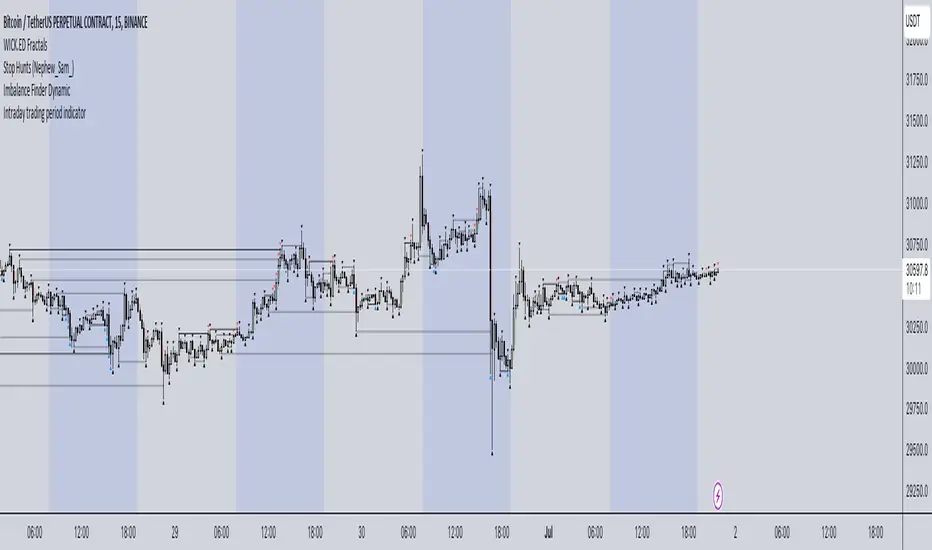
Intraday trading period indicatorI have created this indicator because I was in a need of simple indication of personal session time for my backtesting while practicing intraday Futures trading.
How it works:
1. Define your timezone.
2. Set Trading session start/end time.
3. Choose the colour you want to see your intraday session in.
Actual result: Your selected session is displayed with selected colour and within selected time period. Your are good to go.
It is not perfect for sure but it does what it needs to do and I think it is awesome.
Hope it will be useful for you and let the Profit be with you!
LNL Scalper ArrowsLNL Scalper Arrows
The indicator consist of various different types of candlestick patterns that are truly time tested by multiple veteran traders. These arrows are a combination of short-term scalping strategies taught by Linda Raschke & a trader that goes by name Quant Trade Edge. These strategies/patterns occur regularly within the markets. They offer high probability quick moves during the trending days. These four patterns are based on pure price action, no oscillators, no trend, no momentum indicators involved. Trend (ema) is there just as a simple trend gauge.
LNL Scalper Arrows were designed specifically for intra-day trading. Mostly useful for the futures but also stocks as well. These arrows can work anywhere between the fast-moving 512 or 1600 tick charts to a 1min, 2min and up to 5min or 10min charts.
Trend Gauge (Exponential Moving Average)
Nothing fancy just a classic EMA that can guide the direction of the short-term trend. I have added a custom coloring of the EMA that is based on a simple RSI filter. That should help to visualize the non-directional moments within the trend. Although the length is adjustable, for scalping it is better to focus on smaller periods such as 9, 13 or 20 or 34 but anything above 50 loses its purpose as a short-term trend gauge. Again, this is a scalping tool not a trend tool, you are not going to get rid of the fakeouts by increasing the period of the trend.
Tail Arrows (Eat the Tail Pattern)
Tail is a candlestick that is either a price rejection spike, or a flag continuation pattern on a lower time frame. A failed action. It is basically a candle with much bigger wick (shadow) of the candle than the actual body. Such candles are usually telling us about strong participation from the other side of the market. Eat the tail pattern occurs whenever the low of the Tail candle is immediately broken on a following candle "the tail is eaten alive". Such a breaks occurs in a most aggressive types of markets with a strong momentum. DO NOT try to trade this in a low volume or a ranging market. Tail Arrows are the most aggressive arrows & should be only used on the highest volume or a parabolic momentum markets.
Scalp Arrows (Scallop Pattern)
Known as Scallops or minor lows or highs, these patterns are the most common within the all scalper arrows. They occur regularly on 1min & 5min charts - basically everyday. Scallops provide the best possible risk to reward entry within the trend without the need of any indicators or oscillators. The Scallop Up 3 bar pattern consist of a high that is lower that the previous high but also low that is lower than the previous low. Scallop Up or a minor low triggers when the last high is broken, creating a three bar mountain or a peak within the 5 bar span.
Hoagie Arrows (Hoagie Pattern)
Hoagies occur way less often than any other scalping patterns. Hoagies represent two (or more) inside candles within the shadow of a first candle. Such a formation is creating a small compression or a range that sooner or later breaks out. The hoagie is triggered whenever the high or low of the shadow (first) candle is broken. The great thing about the hoagies is that they can work either way despite the trend direction. Although this indicator is coded for the 2 bar hoagies, there are no limitations on how much inside bars can hoagie include.
Umbrella Arrows (Umbrella Pattern)
Another really awesome 3 bar pattern that is really fun to trade. Umbrella occurs when the candle before the previous candle is a pin bar or a tail bar and the body of the previous candle is within the shadow or a wick of the candle before. The umbrella is triggered once the high or low of the previous bar is broken. Umbrellas are more frequent than Hoagies but occur much less than the Scallops.
Outside Bar Wedges (Outside Bar Pattern)
Pretty much self-explanatory candlestick pattern. Outside Bar is basically any bar that peaks outside of the both ends of the previous candle. So the range of the candle is higher & it looked beyond the high and beyond the low of the previous candle. These candles are signalizing the potenial momentum change. Ouside Bars usually occur at the tops or bottoms of the moves. I decided to add them because they can serve as a great addition to these scalping patterns.
Signal vs. SignalBreak Mode
The trigger can be viewed in two different ways:
1. Signal: Plots the trigger before the trigger bar, basically right when the pattern is formed but NOT YET triggered. The signal is triggered once the next candle break the high or low of the current candle.
2. SignalBrake: Plots the trigger after the break of the high or low of the actual pattern. It is basically a candle after the signal candle. (Signal is better for trading because it gives you time to prepare for the actual break of the high or low = the actual signal. SignalBrake is great for looking back in history only for the patterns that actually traded).
Pin Bar BTW Ratio
Pin Bar (Body-To-Wick) Ratio represents the size of the body of a pin bar candle for Eat the Tail and Umbrella patterns. Pin Bar BTW Ratio measures the ratio between the wick & the body of the candle. Ref. interval is 2.0 - 5.0 (ideal pin bar is 2.0 - 3.0 = the wick or a shadow is 2x - 3x bigger than the body of the candle)
ATR Stop & Target Labels
I also created three simple labels (tables) that can show you the ideal target & stop as well as the current ATR. Since LNL Scalper Arrows consist of high probability scalping patterns, a good rule of thumb to follow is to use a half of the current ATR as a target and a current ATR as a stop (or two times the target). So if the current 7 period ATR is 30 the target would be 15 pts. and a stop around 30 pts. With such a risk management you should aim for a win rate 70% or higher. Obviously you can adjust the risk management in the settings to your personal preference.
Low Range vs. High Range Markets
There are two major downsides with the Scalper Arrows:
1. You need volume and a volatility. These patterns really do struggle in ranging "boring" sideways action. It is absolutely crucial to recognize the current market environment and really stay cautions and (or completely out) in case the chop continues. Adding something like DMI can help you recognize the potential flat markets.
2. Not only do you need volume & momentum, you also need a decent range. This indicator works better on a rangy market such as NQ futures or YM. But are much tougher to trade on lower range markets such as some stocks or ZB futures or basically any other lower range market.
Hope it helps.

PIVOT STRATEGY [INDIAN MARKET TIMING]
A Back-tested Profitable Strategy for Free!!
A PIVOT INTRADAY STRATEGY for 5 minute Time-Frame , that also explains the time condition for Indian Markets
The Timing can be changed to fit other markets, scroll down to "TIME CONDITION" to know more.
The commission is also included in the strategy .
The basic idea is when ,
1) Price crosses above ema1 ,indicated by pivot highest line in green color .
2) Price crosses below ema1 ,indicated by pivot lowest line in red color .
3) Candle high crosses above pivot highest , is the Long condition .
4) Candle low crosses below pivot lowest , is the Short condition .
5) Maximum Risk per trade for the intraday trade can be changed .
6) Default_qty_size is set to 60 contracts , which can be changed under settings → properties → order size .
7) ATR is used for trailing after entry, as mentioned in the inputs below.
// ═════════════════════════//
// ————————> INPUTS <————————— //
// ═════════════════════════//
Leftbars —————> Length of pivot highs and lows
Rightbars —————> Length of pivot highs and lows
Price Cross Ema —————> Added condition
ATR LONG —————> ATR stoploss trail for Long positions
ATR SHORT —————> ATR stoploss trail for Short positions
RISK —————> Maximum Risk per trade for the day
The strategy was back-tested on RELIANCE ,the input values and the results are mentioned under "BACKTEST RESULTS" below .
// ═════════════════════════ //
// ————————> PROPERTIES<——————— //
// ═════════════════════════ //
Default_qty_size ————> 60 contracts , which can be changed under settings
↓
properties
↓
order size
// ═══════════════════════════════//
// ————————> TIME CONDITION <————————— //
// ═══════════════════════════════//
The time can be changed in the script , Add it → click on ' { } ' → Pine editor→ making it a copy [right top corner} → Edit the line 25 .
The Indian Markets open at 9:15am and closes at 3:30pm .
The 'time_cond' specifies the time at which Entries should happen .
"Close All" function closes all the trades at 3pm, at the open of the next candle.
To change the time to close all trades , Go to Pine Editor → Edit the line 103 .
All open trades get closed at 3pm , because some brokers don't allow you to place fresh intraday orders after 3pm .
NSE:RELIANCE
// ═══════════════════════════════════════════════ //
// ————————> BACKTEST RESULTS ( 128 CLOSED TRADES )<————————— //
// ═══════════════════════════════════════════════ //
INPUTS can be changed for better back-test results.
The strategy applied to NIFTY ( 5 min Time-Frame and contract size 60 ) gives us 60% profitability y , as shown below
It was tested for a period a 6 months with a Profit Factor of 1.45 ,net Profit of 21,500Rs profit .
Sharpe Ratio : 0.311
Sortino Ratio : 0.727
The graph has a Linear Curve with consistent profits .
The INPUTS are as follows,
1) Leftbars ————————> 3
2) Rightbars ————————> 5
3) Price Cross Ema ——————> 150
4) ATR LONG ————————> 2.7
5) ATR SHORT ———————> 2.9
6) RISK —————————> 2500
7) Default qty size ——————> 60
NSE:RELIANCE
Save it to favorites.
Apply it to your charts Now !!
↓
FOLLOW US FOR MORE !
Thank me later ;)

Shinohara Intensity Ratio (SIR)Shinohara Intensity Ratio (SIR) - the indicator
This indicator is used to make clear the intensity of the trend. It shows the possible trend of the price. If the price is in an uptrend or in a downtrend, the indicator shows when you can buy or sell or get out. A good example can be seen in the chart with natural gas, a few days earlier it was already seen that a trend reversal was imminent. Shinohara indicator has already indicated it a few days before.
SIR preset
Period: last 26 periods
Strong ratio: green line "GL"
Weak ratio: red line "RL"
What shows you SIR indicator
It has two lines. The strong ratio line is colored in green and the weak ratio line in red.
When the "GL" is above the "RL", this is the indication of price is an uptrend. When the "RL" is above the "GL", it indicates the price in the downtrend.
The increasing of ratio is the sign of trend intensity is increasing. In the high value of the SIR indicator trend reversal may soon.
SIR indicator line is around 100, this indicating the intensity of the price is average.
SIR line is above 120, the intensity of starting a strong trend
SIR line is above 200 or more this indication of the extreme intensity of the trend
Using Strategy
Buy Signal: "GL" is rising above the 120 and the "RL" is below the 100 level
Sell Signal: "RL" is rising above the 120 level and the "GL" is below 100 level
When the "GL" & "RL" (both lines) are rising above 120 or more then you should avoid taking any position
You can take profit or close your position, if the indicator line moving above the 200 level, then you should alert. If the price trend starts reversing, then you can close your position.

TradeWithAB Signal IndicatorThis indicator specifically designed for Momentum trading by an Intraday trader on index( Nifty , BankNifty ) and Equity stocks. This indicator works with DMI and PRICE ACTIONS which gives automated Buy and Sell signals along with Stop loss and Trailing Stop loss when certain criteria are met. It is not a Holy Grail system that gives you continuous profits and it has some limited downfalls also which can be controlled by proper risk Management and position sizing. This is a premium invite only indicator which can be use after given access to you by us. There are some guidelines on how to use this indicator which are given below and you have to follow these guidelines very strictly to get the maximum results.
Guidelines :-
1. Timeframe - 5 min
2. Period should be changed on daily basis(if required) for index trading.
3. Period value would be basically derived from IND VIX value (closest integer) divided by 2.
Ex 1. If the VIX value is 23.56, then it will be consider as 24. So the period value will be 24/2= 12.
Ex 2. If the VIX value is 23.10, then it will be considered as 24. So the period value will be 24/2= 12.
Ex 3. If the VIX value is 22.88, then it will be considered as 22. So the period value will be 22/2= 11.
4. Period value should be fixed at 20 for equity stocks.
5. DO NOT take any SWING or POSITIONAL trade with this indicator.
6. You have to take almost all the trade generated by this indicator on a particular stock/index for better results.
7. Signal confirmation is required for enter the trade as it will give you maximum profits.
8. GREEN TRIANGLE is represented as BUY Signal whereas RED TRIANGLE is represented as SELL Signal.
9. GREEN ARROW is considered as BUY TRAILING STOP LOSS as well as BUY RE-ENTRY for some scenarios.
10. RED ARROW is considered as SELL TRAILING STOP LOSS and SELL RE-ENTRY for some scenarios.
11. You have to avoid entering a trade on a round level zone. Eg- Banknifty 37000,35500,40000 etc etc.
BUY Trade Management :-
1. Trade should be initiated if and only if there is a buy signal(Green Triangle) is generated with confirmation of its respective indices (Recent candle of respective index should be similar to the signal candle).
*in case of BankNifty , Nifty will be its respective index and vice-versa.
2. You should only enter the trade at the CLOSE of the signal generated candle.
3. Your Stop loss should be placed at the LOW of the signal generated candle.
4. There is a trailing Stop loss signal (Green Arrow) after the buying signal is generated.
5. You should trail your Stop loss at the LOW of the trailing Stop loss signal generated candle.
6. You should trail your Stop loss repeatedly until your trailing Stop loss got hit and hence Exit your buy trade.
7. After Exiting the trade you have always option to re-enter at the next trailing Stop loss signal(green arrow) generated candle CLOSE and put your Stop loss at LOW of that candle and repeat the same trailing stop loss procedures.
SELL Trade Management :-
1. Trade should be initiated if and only if there is a sell signal(Red Triangle) is generated with confirmation of its respective indices (Recent candle of respective index should be similar to the signal candle).
*in case of BankNifty , Nifty will be its respective index and vice-versa.
2. You should only enter the trade at the CLOSE of the signal generated candle.
3. Your Stop loss should be placed at the HIGH of the signal generated candle.
4. There is a trailing Stop loss signal (Red Arrow) after the selling signal is generated.
5. You should trail your Stop loss at the HIGH of the trailing Stop loss signal generated candle.
6. You should trail your Stop loss repeatedly until your trailing Stop loss got hit and hence Exit your sell trade.
7. After Exiting the trade you have always option to re-enter at the next trailing Stop loss signal(red arrow) generated candle CLOSE and put your Stop loss at HIGH of that candle and repeat the same trailing stop loss procedures.
Disclaimer :-
*I am not a SEBI Registered Analyst and shall not be liable for any profit, loss or liability resulting, directly or indirectly from the use and results of the indicator. This is not a Holy Grail setup, sometimes the traders hit Stop loss and sometimes it gives amazing results as well.
Instructions to access to this invite-only script:-
*Send us a message if you wish to gain access to this indicator. The subscribers will get benefits of any future development or updates in the current script without any extra charges. Other trading style like swing and positional trading will also available in future updates.

IDEAL BB with MA (With Alerts)It gives well combination of Moving average and Bollinger bands with signals

Algo Trading Strategy (Nifty & BankNifty)What is Algo Trading Strategy ( Nifty & Bank Nifty )?
There are many 9 to 5 working professionals who have some spare money to invest each month but they can not do active trading because they are busy with their full time job.
So they wish to have an automated system which could take and close trades for them with a proven back-tested strategy, proper money management, ability to trade within particular timings, pre-defined maximum loss they can bear and so on.
To cater needs of such type of traders, we created from scratch; and published an 'AutoTrading Algo (Nifty & Bank Nifty) in Sep 2021. (The link is given below, please read on).
Many people who want to try this AutoTrading Algo want us to share stats of this algo with them.
In order to fulfil this demand, we have converted that "Algo Trading" Study into a Strategy whose description you are reading right now.
For all other queries related to how our "Algo Trading (Nifty & Bank Nifty)" works, what are its limitations, benefits and other features, please read the description of our main 'Algo Trading (Bank Nifty & Nifty )' study which is available at following link:
Note:
1. in order to test this strategy on longer time period, you must have a Premium TradingView account.
2. If you have premium TradingView account, the stats you generate will exactly match with our stats which we keep sharing in our channel.
3. To Enable Auto-Trading, You will need to connect this Algo with your broker's trading platform through 3rd party platforms. We will guide you on how to do this, when you contact us.

Algo Trading (Nifty & BankNifty)What is Algo Trading ( Nifty & Bank Nifty ) Indicator?
There are many 9 to 5 working professionals who have some spare money to invest each month but they can not do active trading because they are busy with their full time job.
So they wish to have an automated system which could take and close trades for them with a proven back-tested strategy, proper money management, ability to trade within particular timings, pre-defined maximum loss they can bear and so on.
This indicator facilities all such needs of working professionals.
How this indicator generates signals?
This indicator generates signals in 3 ways:
(a) Pricing action validated by Jump in Volume
(b) Moving Average Crossovers
(c) Zeta Force Signals as generated by our proprietary formula for Bank Nifty & Nifty
Once a threshold value is crossed, the Buy/Sell signal (LE & SE) appears on the chart and algo keeps track of the current state. Then this state is remembered for the loss or profit the trade is generating and position is closed either when loss crosses the set limit or when profitable trade starts receding.
What are the various features of this indicator?
(a) You can define your session timing i.e. the time period when you want your trades to be taken. For example: between 1000 hrs to 1330 hrs or so on.
(b) You can choose to close all positions by EOD . ( EOD is defined by the user. For example, if you set the session timing between 9:30 to 11:00 am, then indicator will not take any trades outside
this range).
(c) You can define the total loss you can bear during a particular day. For example, if total loss is 5% for the day, the algo stops taking further trades.
(d) You can set up either manual alerts for each event, for example Buy, Sell, Buy Close, Sell Close where you can customize the message you want to display or you can select the 'Any Alert()
function call' option which will generate pop up messages in TradeTron or Algoji friendly format. These signals can be routed to 3rd party platforms for execution. If you have TradeTron or
Algoji Account, you can enter your API key in algo settings, and after that the messages generated will contain your API Key by default.
What are the limitations of this indicator?
You can not make money with any indicator or algo if market is narrow range bound.
For you to make money, there must be a trend or mini-trend. Sometimes, price starts trending for a while and then reverses back. In such cases, multiple Stop Loss Hits might occur.
Can I use this for Option Trading also?
Deep in the money options behave like Futures only. So yes, you can use this algo for Options Trading by buying Deep in the money options.
Can I use this for trading in stocks or any other instrument?
No. The code has been hard-wired for Bank Nifty & Nifty (Indian Indices) only. A different, generic version of this algo is in the pipeline which can be used for Forex or Commodity and Stocks.
