NeoChartLabs McGinley DynamicOne of our Favorite Indicators - the McGinley Dynamic
The MGD is adaptive, it speeds up for crypto and slows down for stocks, this version turns green when bullish and red when bearish - this is a fast indicator so the colors are more reliable on higher time frames.
The McGinley Dynamic is a smart, adaptive moving average technical indicator created by John R. McGinley, designed to overcome the lag and whipsaw issues of traditional moving averages (MAs) by automatically adjusting to varying market speeds, resulting in a smoother, more responsive line that tracks price action better, acting as a reliable trend-following tool or baseline in financial charts.
Shout out to LOXX for the original script, updated to v6.
Kaufman's Adaptive Moving Average (KAMA)

The Magic MAOverview
The Magic MA is a smart, adaptive trend-following indicator designed to simplify market structure into a single, highly intuitive visual system. It blends multiple dynamic trend signals into one composite output — giving traders a clean view of momentum, direction, and overall trend health at a glance.
Instead of juggling multiple moving averages, The Magic MA condenses them into a unified scoring model that updates in real-time, highlighting when the market is strong, weakening, or about to shift.
How It Works
Powered by a proprietary algorithm, The Magic MA analyzes trend direction and momentum using three core concepts:
- Trend Slope — Are trends strengthening or losing steam?
- Market Positioning — Is price aligned with the dominant direction?
- Relative Trend Structure — Are short-term dynamics supporting or contradicting the larger move?
These components combine into a 0–100 trend score, continuously recalculated to reflect the live market environment.
The system adapts based on volatility and trend consistency — more responsive during strong moves, smoother when markets get noisy.
What You See
The Magic MA Line
A smoothed, adaptive trend baseline:
Green when upward momentum dominates
Red when downward momentum prevails
The Trend Fill
A color-graded zone that reveals trend strength:
Bright Green — Strong uptrend, momentum expanding
Green — Bullish bias, healthy trend
Orange — Neutral / transition zone
Red — Bearish conditions, momentum negative
The fill not only shows direction — its thickness can help gauge conviction in current price movement.
Trend Score Display
A clean scoreboard panel showing current trend strength (0–100) to support quick decision-making.
How To Use It
Trend Bias
Score > 70 → High-probability bullish environment
Score 50–70 → Favor long setups
Score 30–50 → Caution — market may be reversing or consolidating
Score < 30 → Bearish environment — avoid longs or consider shorts
Signal Concepts
Bullish trigger → Score rising above the midline with the Magic MA turning green
Bearish trigger → Score falling below the midline with the Magic MA turning red
Momentum exits → Trend score pulling back from extremes
Best Practices
Align trades with the trend fill direction
Use score shifts to confirm breakouts or reversals
Validate setups with structure levels (S/R, swing highs/lows)
Credits
Core logic draws inspiration from recognized adaptive trend research and digital signal processing techniques, including the work of Kaufman and Ehlers. Code by Alex Orekhov (everget) and LuxAlgo.

Moving VWAP-KAMA CloudMoving VWAP-KAMA Cloud
Overview
The Moving VWAP-KAMA Cloud is a high-conviction trend filter designed to solve a major problem with standard indicators: Noise. By combining a smoothed Volume Weighted Average Price (MVWAP) with Kaufman’s Adaptive Moving Average (KAMA), this indicator creates a "Value Zone" that identifies the true structural trend while ignoring choppy price action.
Unlike brittle lines that break constantly, this cloud is "slow" by design—making it exceptionally powerful for spotting genuine trend reversals and filtering out fakeouts.
How It Works
This script uses a unique "Double Smoothing" architecture:
The Anchor (MVWAP): We take the standard VWAP and smooth it with a 30-period EMA. This represents the "Fair Value" baseline where volume has supported price over time.
The Filter (KAMA): We apply Kaufman's Adaptive Moving Average to the already smoothed MVWAP. KAMA is unique because it flattens out during low-volatility (choppy) periods and speeds up during high-momentum trends.
The Cloud:
Green/Teal Cloud: Bullish Structure (MVWAP > KAMA)
Purple Cloud: Bearish Structure (MVWAP < KAMA)
🔥 The "Reversal Slingshot" Strategy
Backtests reveal a powerful behavior during major trend changes, particularly after long bear markets:
The Resistance Phase: During a long-term downtrend, price will repeatedly rally into the Purple Cloud and get rejected. The flattened KAMA line acts as a "concrete ceiling," keeping the bearish trend intact.
The Breakout & Flip: When price finally breaks above the cloud with conviction, and the cloud flips Green, it signals a structural regime change.
The "Slingshot" Retest: Often, immediately after this flip, price will drop back into the top of the cloud. This is the "Slingshot" moment. The old resistance becomes new, hardened support.
The Rally: From this support bounce, stocks often launch into a sustained, multi-month bull run. This setup has been observed repeatedly at the bottom of major corrections.
How to Use This Indicator
1. Dynamic Support & Resistance
The KAMA Wall: When price retraces into the cloud, the KAMA line often flattens out, acting as a hard "floor" or "wall." A break of this wall usually signals a genuine trend change, not just a stop hunt.
2. Trend Confirmation (Regime Filter)
Bullish Regime: If price is holding above the cloud, only look for Long setups.
Bearish Regime: If price is holding below the cloud, only look for Short setups.
No-Trade Zone: If price is stuck inside the cloud, the market is traversing fair value. Stand aside until a clear winner emerges.
3. Multi-Timeframe Versatility
While designed for trend confirmation on higher timeframes (4H, Daily), this indicator adapts beautifully to lower timeframes (5m, 15m) for intraday scalping.
On Lower Timeframes: The cloud reacts much faster, acting as a dynamic "VWAP Band" that helps intraday traders stay on the right side of momentum during the session.
Settings
Moving VWAP Period (30): The lookback period for the base VWAP smoothing.
KAMA Settings (10, 10, 30): Controls the sensitivity of the adaptive filter.
Cloud Transparency: Adjust to keep your chart clean.
Alerts Included
Price Cross Over/Under MVWAP
Price Cross Over/Under KAMA
Cloud Flip (Bullish/Bearish Trend Change)
Tip for Traders
This is not a signal entry indicator. It is a Trend Conviction tool. Use it to filter your entries from faster indicators (like RSI or MACD). If your fast indicator signals "Buy" but the cloud is Purple, the probability is low. Wait for the Cloud Flip

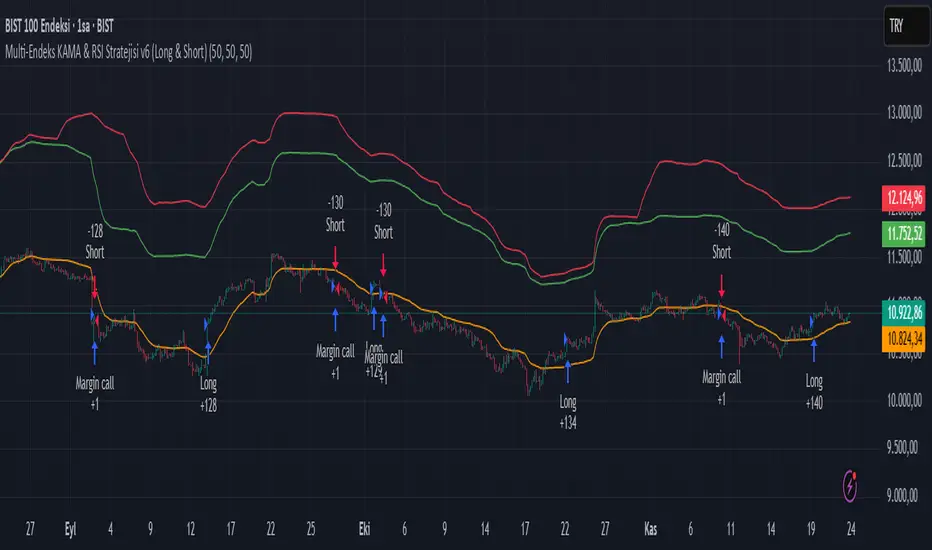
Multi-Endeks KAMA & RSI Stratejisi v6 (Long & Short)Multi-Index KAMA & RSI Strategy v6 (Long & Short)
This is a hybrid trading strategy that combines two powerful technical analysis tools—the Kaufman's Adaptive Moving Average (KAMA) for trend following and the Relative Strength Index (RSI) for measuring momentum and identifying overbought/oversold conditions.
The term "Multi-Index" suggests that the decision-making process might incorporate data or conditions from several different market indices or timeframes, rather than just the single asset being traded.
🧭 Core Components
1. KAMA (Kaufman's Adaptive Moving Average)
KAMA is an adaptive moving average developed by quantitative financial theorist Perry J. Kaufman.
Adaptivity: Unlike standard moving averages, KAMA automatically adjusts its smoothing factor (speed) based on market volatility.
Mechanism:
Trending Markets (Low Noise): When prices move clearly in one direction (low volatility), KAMA speeds up, hugging the price closely and providing fast signals.
Sideways Markets (High Noise): When prices are choppy (high volatility/noise), KAMA slows down, smoothing out price fluctuations to reduce the risk of whipsaws (false signals).
Role in Strategy: To define the main trend direction. The position of the price relative to the KAMA line determines the base directional bias (Long or Short).
2. RSI (Relative Strength Index)
RSI is a momentum oscillator developed by J. Welles Wilder Jr. that measures the speed and change of price movements.
Overbought/Oversold: It oscillates between 0 and 100. Conventionally, a reading above 70 suggests overbought conditions (potential sell signal), and a reading below 30 suggests oversold conditions (potential buy signal).
Role in Strategy: Timing and Confirmation. Once the trend is confirmed by KAMA, the RSI acts as a timing filter, often confirming an entry as it moves away from extreme overbought (for Short) or oversold (for Long) levels.
📉 Potential Trading Logic (V6)
This "v6" strategy likely aims to capture more reliable entries by requiring both trend (KAMA) and momentum (RSI) alignment:
1. LONG (Buy) Entry Conditions
Trend Confirmation (KAMA): The asset's price (Closing Price) must be above the KAMA line (confirming an uptrend).
Momentum Confirmation (RSI):
Option A (Reversal): The RSI must cross above the 30 level (exiting oversold) or decisively move above the 50 level.
Option B (Trend-Continuation): In a strong uptrend, the RSI might bounce off the 40-50 zone and turn upwards, confirming trend continuation.
2. SHORT (Sell) Entry Conditions
Trend Confirmation (KAMA): The asset's price (Closing Price) must be below the KAMA line (confirming a downtrend).
Momentum Confirmation (RSI):
Option A (Reversal): The RSI must cross below the 70 level (exiting overbought) or decisively move below the 50 level.
Option B (Trend-Continuation): In a strong downtrend, the RSI might be rejected from the 50-60 zone and turn downwards, confirming continuation.
3. Exit Management
The strategy likely utilizes dynamic risk controls:
Stop-Loss: A dynamic stop placed on the opposite side of the KAMA, or an ATR-based distance to adjust to volatility.
Take-Profit: Conditions such as the RSI reaching extreme levels or the KAMA line being crossed in the reverse direction.
🌟 Implication of the "V6" Version
The "v6" designation implies that the strategy has been refined and iterated upon over time to address weaknesses in prior versions (v1, v2, etc.). These improvements might include:
Filters: Adding stricter RSI or KAMA cross filters to reduce false signals.
Multi-Index Logic: Using the RSI or KAMA of a secondary instrument (e.g., a major index or volatility measure) as a macro filter for the main trade execution.
Optimization: Optimizing the default lookback periods for KAMA and RSI for different asset classes.
Crypto Schlingel - PVSRA POC EMA Suite v5.903The Chart Indicator Suite combines a wide range of powerful tools that help traders accurately analyze market structures, volatility, and key price zones. With indicators such as POC, pivot points, EMAs, VWAP, Bollinger Bands, and important market levels such as yesterday/weekly high & low, daily open, psy high/low, and ADR, the suite offers a comprehensive overview of trends and market behavior. Supplemented by pvsra candles, long candle detection, and the display of relevant stock market opening hours, it reliably supports traders in making informed trading decisions.
Indicators are configurable
All of the indicators mentioned are fully configurable and can be flexibly adapted to individual trading strategies. Users can freely adjust parameters, display types, and sensitivities to highlight exactly the market information that is relevant to their personal trading style.
The individual fields in the configuration are self-explanatory or are explained in a toolbar, so that the possible settings become clear.
POC
The Point of Control (POC) is a central concept in market profile and volume profile analysis and plays an important role in technical chart analysis. Here is a detailed description of its usefulness and significance:
Definition
The point of control (POC) is the price level at which the most trading volume has taken place within a certain period of time.
It therefore shows the price at which buyers and sellers were most active – the center of market interest.
📊 Use and significance in chart analysis
1. Central support and resistance zone
Since the largest volume was traded at the POC, this price is considered a “fair zone” or equilibrium price.
The market often reacts strongly to the POC:
Above the POC → potential resistance if the price is coming from below.
Below the POC → potential support if the price is falling from above.
Example: If the price returns to the POC, this can be an entry opportunity for traders betting on a market reaction.
2. Interpretation of market acceptance
A price range with high volume (including POC) shows where the market has accepted a fair value.
Low volume, on the other hand, indicates rejection or disinterest.
→ The POC therefore helps to distinguish between accepted price zones and transition areas.
PIVOT POINTS
Pivot points are predefined price levels calculated from the previous day's price data (or a previous time unit).
They help traders identify potential support and resistance zones for the current trading day (or period).
Benefits of pivot points in chart analysis
1. Determining support and resistance areas
The calculated pivot levels (P, S1, S2, R1, R2, etc.) show where the market is likely to react:
Supports (S1, S2, S3) → possible downward turning points.
Resistance (R1, R2, R3) → possible upward turning points.
These zones are often observed by many traders at the same time, making them self-fulfilling marks.
2. Trend determination and market sentiment
If the market opens above the pivot (P) and remains there → signals buying pressure.
If the market trades below the pivot (P) → signals selling pressure.
A break above R1 or below S1 may indicate a strong trend day.
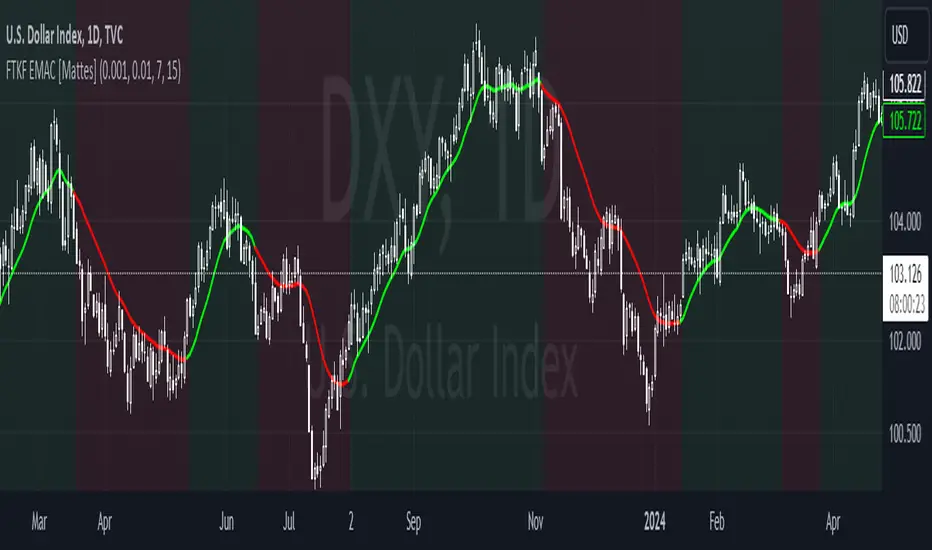
EMA Exponential Moving Average
The EMA is the exponentially weighted moving average of a price.
It shows the average price of a security over a certain period of time, weighted according to recency – that is:
👉 more recent price data has more influence than older data.
This distinguishes it from the simple moving average (SMA), in which all values are weighted equally.
Benefits of the EMA in chart analysis -> Identifying trends
The EMA reacts more quickly to price changes than the SMA and is therefore ideal for:
Identifying trend reversals at an early stage
Confirming trend directions
👉 Rising EMA → Upward trend
👉 Falling EMA → Downward trend
Traders often use combinations such as:
EMA 50 / EMA 200 → Long-term trends
SIGNIFICANCE OF HIGHS AND LOWS
The daily high, daily low, weekly high, and weekly low are objective price zones that show:
Where the market bought (high) or sold (low) the most, and where supply and demand reached their extremes in the past period.
These levels often act as magnetic price zones in ongoing trading, where traders react (entry, profit-taking, or stop setting).
🎯 Use of yesterday's high and low (previous day high/low)
🔹Support and resistance levels
Yesterday's high often acts as resistance when the price comes from below.
Yesterday's low becomes support when the price falls from above.
➡️ Traders watch these levels closely to trade breakouts or reversals.
EMA 9 / EMA 20 → Short-term movements
🎯 Benefits of weekly highs and lows (Weekly High/Low)
Important structural markers in the higher time frame
Weekly highs and lows show medium to long-term market structure.
They are often considered stronger supports/resistances than daily levels.
➡️ For example, if the price breaks above the weekly high, this usually signals institutional interest and may indicate a continuation of the trend.
➡️ Conversely, failure to break above a weekly high may indicate market weakness or a reversal.
DAILY OPEN
The Daily Open is the price at which trading begins on a new day.
It marks the first price after the close of the previous trading session.
👉 In many markets (e.g., Forex, index futures, crypto), this is the starting point of daily price movement, where market direction and sentiment realign.
🎯 Benefits of the Daily Open in chart analysis
Direction indicator (daily bias)
The Daily Open serves as a neutral center line for the current trading day.
Traders use it to assess the market direction (bias):
Price above the Daily Open → bullish day (buyers dominate)
Price below the daily open → bearish day (sellers dominate)
📈 → If the daily open is broken and held above, this indicates upward momentum.
📉 → If it is broken below, this signals weakness.
This simple observation helps traders trade with the daily trend rather than against it.
STOCK MARKET OPENING HOURS
Every major stock exchange has defined trading hours during which institutional capital is active.
Examples (CET):
Asia (Tokyo/ Hong Kong) 1:00 a.m. – 9:00 a.m.
Europe (London/Frankfurt) 08:00 – 17:30
USA (New York) 15:30 – 22:00
Market dynamics change significantly during these time windows, as volume, liquidity, and volatility fluctuate depending on the session.
📈 Benefits in chart analysis
🔹Recognizing volatility and liquidity phases
At the start of a session (e.g., 9:00 a.m. in Frankfurt or 3:30 p.m. in New York), trading volume rises sharply.
This results in strong movements, often with changes in direction or breakouts.
👉 These phases are particularly suitable for:
Breakout strategies
Volume or momentum trades
Example:
If an index (e.g., DAX or S&P 500) reacts strongly at the US opening, this indicates institutional activity that may shape the rest of the day.
PSY HIGH AND PSY LOW
Psy High and Psy Low stand for:
Psychological High → the psychologically significant upper price level of a particular range
Psychological Low → the psychologically significant lower price level
These are often round numbers or striking price zones that market participants unconsciously use as a guide.
Examples:
For EUR/USD: 1.0500, 1.1000, 1.1500
For DAX: 17,000, 17,500, 18,000
For BTC/USD: 60,000, 65,000, 70,000
Traders also refer to such levels as “big figures” or “round numbers.”
📊 Why are psy levels so important?
Because they are based on human perception and market psychology:
👉 People think in round numbers, not in decimals such as 1.1037 or 17.264.
That's why:
Private investors often place their stop losses or take profits just above or below these levels, Institutional traders place large limit orders in these zones, and Algorithms react to the liquidity created there.
→ This results in increased volume, reaction patterns, and price movements at these levels.
ADR (Average Daily Range)
The ADR measures the average daily trading range of a market over a specific period of time – i.e., how many points, pips, or dollars the price typically moves per day.
Example:
If the DAX has moved an average of 180 points per day over the last 14 days, the ADR(14) = 180.
🎯 The benefits of ADR in chart analysis
🔹 Assessment of daily volatility
The ADR shows how much a market typically moves per day.
→ This allows you to see whether the current day is more volatile or calmer than normal.
Interpretation – Meaning
Current range < ADR
→ Market is still moving within normal limits → Potential for further movement
Current range ≈ ADR
→ Daily target largely achieved → lower probability of significant expansion
Current range > ADR
→ Market overextended → increased probability of correction or consolidation
👉 This helps you to plan entries, price targets, and stops realistically.
VWAP (Volume Weighted Average Price)
The VWAP is the volume-weighted average price of a security for a specific period of time – usually per day.
👉 Unlike a simple moving average (e.g., EMA), the VWAP takes into account how much was actually traded – not just where the price was.
It therefore reflects the fair market value, taking into account the trading volume.
🎯 Benefits of VWAP in chart analysis
🔹 Determining the fair average price
The VWAP shows where the majority of the trading volume took place – i.e., the price that the majority of market participants actually paid.
➡️ This is the “fair price of the day.”
Price above VWAP → buyers dominate (bullish)
Price below VWAP → sellers dominate (bearish)
This information is particularly valuable for determining the intraday bias (direction of the day).
BOLLINGER BANDS
Bollinger Bands consist of three lines based on a moving average (usually SMA 20):
Middle band:
→ usually the 20-period SMA (simple moving average)
Upper band:
→ SMA + (2 × standard deviation)
Lower band:
→ SMA − (2 × standard deviation)
👉 This means that the bands “breathe” with volatility – they widen when the market is volatile and contract when the market is calm.
🎯 The benefits of Bollinger Bands in chart analysis
🔹 Measuring market volatility
The main function of Bollinger Bands is to visualize the volatility of a market:
Wide bands → high volatility → strong movement/trend phase
Narrow bands → low volatility → calm market/consolidation
📈 When the bands contract sharply (“Bollinger squeeze”) → often a harbinger of an impending breakout.
KAMA
The KAMA was developed by Perry J. Kaufman.
Unlike normal moving averages such as SMA or EMA, it dynamically adjusts its smoothing to market conditions:
Low volatility / strong trend → reacts faster to price movements
High volatility / sideways movement → reacts slower, reduces false signals
The core idea: adaptability instead of rigid smoothing.
🎯 Benefits of KAMA in chart analysis
🔹 Filtering out market noise
KAMA smooths out unnecessary price fluctuations (noise) that many normal indicators mistakenly interpret as signals.
➡️ This minimizes false signals in sideways phases, while real trends remain visible.
EXTRA LARGE WICKS
A wick (or wick) is the thin line above or below the candle body:
Top → Highest price during the period
Bottom → Lowest price during the period
Long wick → Significant rejection of the price at this extreme zone
Example: A long upper wick means that the price rose high but was then pushed back sharply.
🎯 Benefits of long wicks in chart analysis
🔹 Recognizing rejections and resistance
Long upper wick: Sellers did not allow the higher price → possible downward reversal
Long lower wick: Buyers defended the lower price → possible upward reversal
💡 The market “speaks” through these wicks: It shows where buyers or sellers are not giving in any further.

Doctor Analytics – EMERSON >🜂 Doctor Analytics – EMERSON >
“Where probability replaces emotion.”
Doctor Analytics – EMERSON > isn’t a tool — it’s a behavioral correction system for traders who refuse to gamble.
Built on the Kulture Metrics / Emerson Moss framework, it combines the raw aggression of momentum with the cold precision of mathematical expectancy.
This isn’t signal-hunting; it’s surgical probability alignment.
Inside every calculation beats the Path-Integral Engine — Linetsky-inspired stochastic modeling that measures the expected payoff of all recent price paths, weighted by volatility and discounted through time. It watches volatility breathe, measures it, and only moves when mathematics agrees with momentum.
The Kulture Metrics Dashboard transforms trading discipline into data:
Tracks your live balance, dynamic risk %, and target %.
Computes exact dollar risk and payoff values in real time.
Enforces drawdown protection with an automatic Loss Halt Flag after two consecutive hits.
Embeds compliance awareness through a Trust Bank audit watermark.
While others chase trends, EMERSON > calculates the probability of continuation.
Each signal passes through layered verification — trend integrity, volatility gate, and path-integral confirmation — filtering out emotional noise until only certainty remains.
Benefits that dominate the screen:
⚙️ Real-time equity evolution and risk-to-reward feedback.
⚙️ Path-integral logic that aligns with professional option-pricing models.
⚙️ Adaptive volatility gating for ultra-clean confirmations.
⚙️ Visual dashboard — no spreadsheets, no hesitation, no excuses.
Doctor Analytics – EMERSON > is more than an indicator; it’s a trading philosophy encoded in Pine v6.
For those who understand that discipline and mathematics are the last forms of rebellion.
Kulture Metrics | EMERSON — When logic meets inevitability.

Average True Range Stop Loss Finder with KAMAATR SL finder with bands
Kaufmann adaptive moving average
ATR SL finder with bands
Kaufmann adaptive moving average

Tunç ŞatıroğluTunç Şatıroğlu's Technical Analysis Suite
Description:
This comprehensive Pine Script indicator, inspired by the technical analysis teachings of Tunç Şatıroğlu, integrates six powerful TradingView indicators into a single, user-friendly suite for robust trend, momentum, and divergence analysis. Each component has been carefully selected and enhanced by beytun to improve functionality, performance, and visual clarity, aligning with Şatıroğlu's approach to technical analysis. The default configuration is meticulously set to match the exact settings of the individual indicators as used by Tunç Şatıroğlu in his training, ensuring authenticity and ease of use for followers of his methodology. Whether you're a beginner or an experienced trader, this suite provides a versatile toolkit for analyzing markets across multiple timeframes.
Included Indicators:
1. WaveTrend with Crosses (by LazyBear, modified): A momentum oscillator that identifies overbought/oversold conditions and trend reversals with clear buy/sell signals via crosses and bar color highlights.
2. Kaufman Adaptive Moving Average (KAMA) (by HPotter, modified): A dynamic moving average that adapts to market volatility, offering a smoother trend-following signal.
3. SuperTrend (by Alex Orekhov, modified): A trend-following indicator that plots dynamic support/resistance levels with buy/sell signals and optional wicks for enhanced accuracy.
4. Nadaraya-Watson Envelope (by LuxAlgo, modified): A non-linear envelope that highlights potential reversals with customizable repainting options for smoother outputs.
5. Divergence for Many Indicators v4 (by LonesomeTheBlue, modified): Detects regular and hidden divergences across multiple indicators (MACD, RSI, Stochastic, CCI, Momentum, OBV, VWMA, CMF, MFI, and more) for early reversal signals.
6. Ichimoku Cloud (TradingView built-in, modified): A multi-faceted indicator for trend direction, support/resistance, and momentum, with enhanced visuals for the Kumo Cloud.
Key Features:
- Authentic Default Settings : Pre-configured to mirror the exact parameters used by Tunç Şatıroğlu for each indicator, ensuring alignment with his proven technical analysis approach.
- Customizable Settings : Enable/disable individual indicators and fine-tune parameters to suit your trading style while retaining the option to revert to Şatıroğlu’s defaults.
- Enhanced User Experience : Modifications improve visual clarity, performance, and usability, with options like repainting smoothing for Nadaraya-Watson and adjustable Ichimoku projection periods.
- Multi-Timeframe Analysis : Combines trend-following, momentum, and divergence tools for a holistic view of market dynamics.
- Alert Conditions : Built-in alerts for SuperTrend direction changes, buy/sell signals, and divergence detections to keep you informed.
- Visual Clarity : Overlays (KAMA, SuperTrend, Nadaraya-Watson, Ichimoku) and pane-based indicators (WaveTrend, Divergences) are clearly distinguished, with customizable colors and styles.
Notes:
- The Nadaraya-Watson Envelope and Ichimoku Cloud may repaint in their default modes. Use the "Repainting Smoothing" option for Nadaraya-Watson or adjust Ichimoku settings to mitigate repainting if preferred.
- Published under the MIT License, with components licensed under GPL-3.0 (SuperTrend), CC BY-NC-SA 4.0 (Nadaraya-Watson), MPL 2.0 (Divergence), and TradingView's terms (Ichimoku Cloud).
Usage:
Add this indicator to your TradingView chart to leverage Tunç Şatıroğlu’s exact indicator configurations out of the box. Customize settings as needed to align with your strategy, and use the combined signals to identify trends, reversals, and divergences. Ideal for traders following Şatıroğlu’s methodologies or anyone seeking a powerful, all-in-one technical analysis tool.
Credits:
Original authors: LazyBear, HPotter, Alex Orekhov, LuxAlgo, LonesomeTheBlue, and TradingView.
Modifications and integration by beytun .
License:
Published under the MIT License, incorporating code under GPL-3.0, CC BY-NC-SA 4.0, MPL 2.0, and TradingView’s terms where applicable.

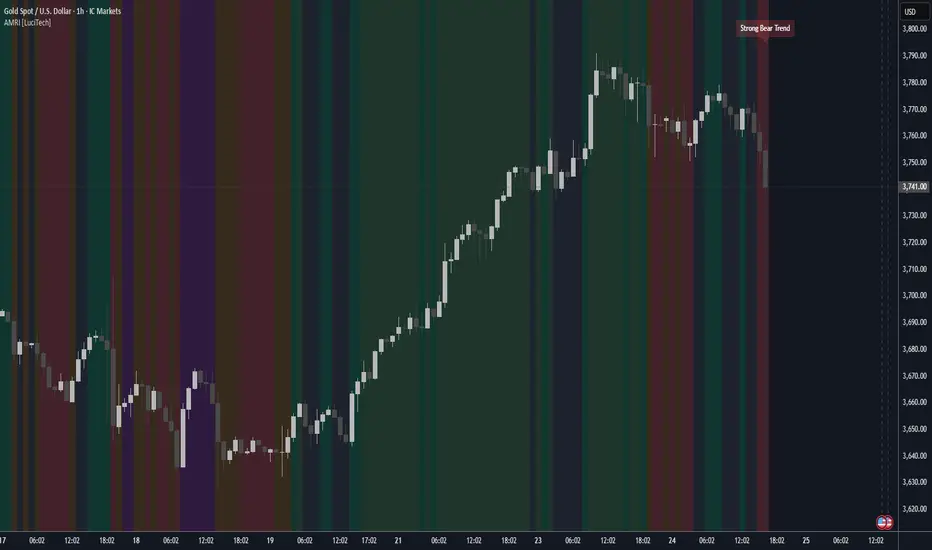
Adaptive Market Regime Identifier [LuciTech]What it Does:
AMRI visually identifies and categorizes the market into six primary regimes directly on your chart using a color-coded background. These regimes are:
-Strong Bull Trend: Characterized by robust upward momentum and low volatility.
-Weak Bull Trend: Indicates upward momentum with less conviction or higher volatility.
-Strong Bear Trend: Defined by powerful downward momentum and low volatility.
-Weak Bear Trend: Suggests downward momentum with less force or increased volatility.
-Consolidation: Periods of low volatility and sideways price action.
-Volatile Chop: High volatility without clear directional bias, often seen during transitions or indecision.
By clearly delineating these states, AMRI helps traders quickly grasp the overarching market context, enabling them to apply strategies best suited for the current conditions (e.g., trend-following in strong trends, range-bound strategies in consolidation, or caution in volatile chop).
How it Works (The Adaptive Edge)
AMRI achieves its adaptive classification by continuously analyzing three core market dimensions, with each component dynamically adjusting to current market conditions:
1.Adaptive Moving Average (KAMA): The indicator utilizes the Kaufman Adaptive Moving Average (KAMA) to gauge trend direction and strength. KAMA is unique because it adjusts its smoothing period based on market efficiency (noise vs. direction). In trending markets, it becomes more responsive, while in choppy markets, it smooths out noise, providing a more reliable trend signal than static moving averages.
2.Adaptive Average True Range (ATR): Volatility is measured using an adaptive version of the Average True Range. Similar to KAMA, this ATR dynamically adjusts its sensitivity to reflect real-time changes in market volatility. This helps AMRI differentiate between calm, ranging markets and highly volatile, directional moves or chaotic periods.
3.Normalized Slope Analysis: The slope of the KAMA is normalized against the Adaptive ATR. This normalization provides a robust measure of trend strength that is relative to the current market volatility, making the thresholds for strong and weak trends more meaningful across different instruments and timeframes.
These adaptive components work in concert to provide a nuanced and responsive classification of the market regime, minimizing lag and reducing false signals often associated with fixed-parameter indicators.
Key Features & Originality:
-Dynamic Regime Classification: AMRI stands out by not just indicating trend or range, but by classifying the type of market regime, offering a higher-level analytical framework. This is a meta-indicator that provides context for all other trading tools.
-Adaptive Core Metrics: The use of KAMA and an Adaptive ATR ensures that the indicator remains relevant and responsive across diverse market conditions, automatically adjusting to changes in volatility and trend efficiency. This self-adjusting nature is a significant advantage over indicators with static lookback periods.
-Visual Clarity: The color-coded background provides an immediate, at-a-glance understanding of the current market regime, reducing cognitive load and allowing for quicker decision-making.
-Contextual Trading: By identifying the prevailing regime, AMRI empowers traders to select and apply strategies that are most effective for that specific environment, helping to avoid costly mistakes of using a trend-following strategy in a ranging market, or vice-versa.
-Originality: While components like KAMA and ATR are known, their adaptive integration into a comprehensive, multi-regime classification system, combined with normalized slope analysis for trend strength, offers a novel approach to market analysis not commonly found in publicly available indicators.
HMA super trade by @arkancapMulti-HMA with five customizable moving averages: visual colors, transparency via picker, flexible line styles, and label/alert for HMA50↔HMA100 crossovers. Lightweight, readable, and ready for trading templates.
Мульти-HMA с пятью настраиваемыми скользящими: визуальные цвета, прозрачность через пикер, гибкие стили линий и метка/алерт для пересечений HMA50↔HMA100. Лёгкий, читабельный и готовый к торговым шаблонам.
Five Hull moving averages that show the trend and indicate key crossovers. Customize colors, thickness, and get accurate alerts. Suitable for scalping and multi-timeframes. Support for filling between moving averages to visually highlight areas of strength or weakness.
Пять Hull-скользящих, которые показывают тренд и подсказывают ключевые пересечения. Настраивай цвета, толщину и получай аккуратные алерты. Подходит для скальпа и мульти-таймфрейма. Поддержка заливки между скользящими для наглядного выделения зон силы или слабости.

ETH/SOL 1D Dynamic Trend Core - Indicator v46🚀 Dynamic Trend Core
The Dynamic Trend Core is a sophisticated, multi-layer trading engine designed to identify high-probability, trend-following opportunities. It offers both a quantitative backtesting engine and a rich, intuitive visual interface.
Its core philosophy is simple: confirmation. The system seeks to filter out market noise by requiring a confluence of conditions—trend, momentum, price action, and volume—to be in alignment before a signal is considered valid.
⚙️ Core Logic Components
Primary Trend Analysis (SAMA): The foundation is a Self-Adjusting Moving Average (SAMA) that determines the underlying market trend (Bullish, Bearish, or Consolidation).
Confirmation & Momentum: Signals are confirmed with a blend of the Natural Market Slope and a Cyclic RSI to ensure momentum aligns with the primary trend.
Advanced Filtering Layers: A suite of optional filters allows for robust customization:
Volume & ADX: Ensure sufficient market participation and trend strength.
Market Regime: Uses the total crypto market cap to gauge broad market health.
Multi-Timeframe (MTF): Aligns signals with the dominant weekly trend.
BTC Cycle Analysis: Uses Halving or Mayer Multiple models to position trades within historical macro cycles.
Delta Zones: An additional filter to confirm signals with recent buy or sell pressure detected in candle wicks.
📊 The On-Chart Command Center
The strategy's real power comes from its on-chart visual feedback system, which provides full transparency into the engine's decision-making process.
Note: For the dashboard to update in real-time, you must enable "Recalculate on every tick" in the script's settings.
Power Core Gauge: Located at the bottom-center, this gauge is the heart of the system. It displays the number of active filter conditions met (e.g., 6/7) and "powers up" by glowing brightly as a signal becomes fully confirmed.
Live Conditions Panel: In the bottom-right corner, this panel acts as a detailed pre-flight checklist. It shows the real-time status of every single filter, helping you understand exactly why a trade is (or is not) being triggered.
Energized Trendline: The main SAMA trendline changes color and brightness based on the strength and direction of the trend, providing immediate visual context.
Halving Cycle Visualization: An optional visual guide to the phases of the Bitcoin halving cycle.
Delta Zone Pressure Boxes: A visual guide that draws boxes around candles exhibiting significant buying or selling pressure.
🛠️ How to Use
Operation Mode: "Alerts-Only Mode" for generating live signals.
Configure Strategy: Start with the default filters. If a potential trade setup is missed, check the Live Conditions Panel to see exactly which filter blocked the signal. Adjust the filters to suit your specific asset and timeframe.
Manage Risk: Adjust the Risk & Exit settings to match your personal risk tolerance.
BTC Dynamic Trend Core - Indicator v46🚀 Dynamic Trend Core
The Dynamic Trend Core is a sophisticated, multi-layer trading engine designed to identify high-probability, trend-following opportunities. It offers both a quantitative backtesting engine and a rich, intuitive visual interface.
Its core philosophy is simple: confirmation. The system seeks to filter out market noise by requiring a confluence of conditions—trend, momentum, price action, and volume—to be in alignment before a signal is considered valid.
⚙️ Core Logic Components
Primary Trend Analysis (SAMA): The foundation is a Self-Adjusting Moving Average (SAMA) that determines the underlying market trend (Bullish, Bearish, or Consolidation).
Confirmation & Momentum: Signals are confirmed with a blend of the Natural Market Slope and a Cyclic RSI to ensure momentum aligns with the primary trend.
Advanced Filtering Layers: A suite of optional filters allows for robust customization:
Volume & ADX: Ensure sufficient market participation and trend strength.
Market Regime: Uses the total crypto market cap to gauge broad market health.
Multi-Timeframe (MTF): Aligns signals with the dominant weekly trend.
BTC Cycle Analysis: Uses Halving or Mayer Multiple models to position trades within historical macro cycles.
Delta Zones: An additional filter to confirm signals with recent buy or sell pressure detected in candle wicks.
📊 The On-Chart Command Center
The strategy's real power comes from its on-chart visual feedback system, which provides full transparency into the engine's decision-making process.
Note: For the dashboard to update in real-time, you must enable "Recalculate on every tick" in the script's settings.
Power Core Gauge: Located at the bottom-center, this gauge is the heart of the system. It displays the number of active filter conditions met (e.g., 6/7) and "powers up" by glowing brightly as a signal becomes fully confirmed.
Live Conditions Panel: In the bottom-right corner, this panel acts as a detailed pre-flight checklist. It shows the real-time status of every single filter, helping you understand exactly why a trade is (or is not) being triggered.
Energized Trendline: The main SAMA trendline changes color and brightness based on the strength and direction of the trend, providing immediate visual context.
Halving Cycle Visualization: An optional visual guide to the phases of the Bitcoin halving cycle.
Delta Zone Pressure Boxes: A visual guide that draws boxes around candles exhibiting significant buying or selling pressure.
🛠️ How to Use
Indicator version of BTC DTC Strategy: "Alerts-Only Mode" for generating live signals.
Configure Strategy: Start with the default filters. If a potential trade setup is missed, check the Live Conditions Panel to see exactly which filter blocked the signal. Adjust the filters to suit your specific asset and timeframe.
Manage Risk: Adjust the Risk & Exit settings to match your personal risk tolerance.

KAMA Trend Flip - SightLing LabsBuckle up, traders—this open-source KAMA Trend Flip indicator is your ticket to sniping trend reversals with a Kaufman Adaptive Moving Average (KAMA) that’s sharper than a Wall Street shark’s tooth. No voodoo, no fluff—just raw, volatility-adaptive math that dances with the market’s rhythm. It zips through trending rockets and chills in choppy waters, slashing false signals like a samurai. Not laggy like the others - this thing is the real deal!
Core Mechanics:
• Efficiency Ratio (ER): Reads the market’s pulse (0-1). High ER = turbo-charged MA, low ER = smooth operator.
• Adaptive Smoothing: Mixes fast (default power 2) and slow (default 30) constants to match market mood swings.
• Trend Signals: KAMA climbs = blue uptrend (bulls run wild). KAMA dips = yellow downtrend (bears take over). Flat = gray snooze-fest.
• Alerts: Instant pings on flips—“Trend Flip Up” for long plays, “Down” for shorts. Plug into bots for set-and-forget domination.
Why It Crushes:
• Smokes static MAs in volatile arenas (crypto, stocks, you name it). Backtests show 20-30% fewer fakeouts than SMA50.
• Visual Pop: Overlays price with bold blue/yellow signals. Slap it on BTC 1D to see trends light up like Times Square.
• Tweakable: Dial ER length (default 50) to your timeframe. Short for scalps, long for swing trades.
Example Settings in Action:
• 10s Chart (Hyper-Scalping): Set Source: Close, ER Length: 100, Fast Power: 1, Slow Power: 6. Catches micro-trends in crypto like a heat-seeking missile. Blue/yellow flips scream entry/exit on fast moves.
• 2m Chart (Quick Trades): Set Source: Close, ER Length: 14, Fast Power: 1, Slow Power: 6. Perfect for rapid trend shifts in stocks or forex. Signals align with momentum bursts—check historical flips for proof.
Deployment:
• Drop it on any chart. Backtest settings to match your asset’s volatility—tweak until it sings.
• Pair with RSI or volume spikes for killer confirmation. Pro move: Enter on flip + volume pop, exit on reverse.
• Strategy-Ready: Slap long/short logic on alerts to build a lean, mean trading machine.
Open source from SightLing Labs—grab it, hack it, profit from it. Share your tweaks in the comments and let’s outsmart the market together. Trade hard, win big!

ETH/SOL 1D Dynamic Trend Core - STRATEGY v 45Overview
The Dynamic Trend Core is a sophisticated, multi-layer trading engine designed to identify high-probability, trend-following opportunities. Its core philosophy is rooted in confluence, meaning it requires multiple conditions across trend, momentum, and volume to align before generating a signal. This approach aims to filter out market noise and provide a clearer view of the underlying trend.
The script includes a comprehensive backtesting engine for strategy optimization and a rich, intuitive visual interface for real-time analysis.
How It Works: Core Logic
The engine validates signals through several sequential layers:
Primary Trend Analysis (SAMA): The foundation is a Self-Adjusting Moving Average (SAMA) that dynamically determines the primary market direction (Bullish, Bearish, or Consolidation).
Momentum Confirmation: Signals are then qualified using a blend of the Natural Market Slope and a Cyclic RSI to ensure momentum is firmly aligned with the established trend.
Advanced Filtering Suite: A suite of optional filters provides robust confirmation and allows for deep customization:
Volume & ADX: Confirms that trades are supported by sufficient market participation and trend strength.
Market Regime: Gauges broad market health (e.g., using TOTAL market cap) to avoid trading against the entire market.
Multi-Timeframe (MTF) Analysis: Aligns signals with the dominant trend on a higher timeframe (e.g., Weekly).
BTC Cycle Analysis: Positions trades within the context of historical Bitcoin cycles using models like the Halving Cycle or Mayer Multiple.
On-Chart Visuals & Features
The script provides full transparency into its logic with a powerful on-chart interface.
IMPORTANT: For the live visual elements to function correctly, you must enable "Recalculate on every tick" in the script's settings (Settings > Properties).
Power Core Gauge: Located at the bottom-center of the chart, this gauge is the heart of the system. It displays the number of filter conditions currently met (e.g., 5/6) and "powers up" by glowing brighter as more conditions align, indicating a fully confirmed signal is ready.
Live Conditions Panel: This panel in the bottom-right corner acts as a real-time pre-flight checklist. It shows the status (pass/fail) of every individual filter, so you know exactly why a signal is, or is not, being generated.
Energized Trendline: The primary SAMA trendline changes color and intensity based on the strength and direction of the trend, offering immediate visual context.
BTC Halving Cycle Visualizer: Provides a background color guide to the different phases of the Bitcoin halving cycle for macro context.
How to Use & Configure
Select Operation Mode:
Backtest Mode: Use this to test different settings on historical data and find optimal configurations for a specific asset and timeframe.
Alerts-Only Mode: Use this for live trading to generate alert signals without cluttering the chart with backtest data. (Contact publisher for access to this version)
Configure Your Filters:
Start with the default filter settings.
If a potential setup is missed, check the Live Conditions Panel to see which specific filter blocked the signal.
Enable, disable, or adjust filters in the script's settings to match your trading style and the asset's characteristics.
Manage Your Risk:
Go to the "Risk & Exit" settings to configure your Stop Loss and Take Profit parameters to match your personal risk tolerance.
Disclaimer: This script is for educational and informational purposes only. It is not financial advice. All trading involves risk, and past performance is not indicative of future results. Please conduct your own research and backtesting before making any trading decisions.

BTC Dynamic Trend Core Strategy v45// The Dynamic Trend Core is a sophisticated, multi-layer trading strategy that provides both a quantitative //
// backtesting engine and a rich, intuitive visual interface. It is designed to identify high-probability //
// trend-following opportunities by requiring a confluence of conditions to be met before a signal is considered //
// valid. //
// //
// The system's philosophy is rooted in confirmation, seeking to filter out market noise by ensuring that trend, //
// momentum, market sentiment, and volume are all in alignment. //
// //
// --- CORE LOGIC COMPONENTS --- //
// 1. **Primary Trend Analysis (SAMA):** The foundation is a self-adjusting moving average (SAMA) that //
// determines the underlying market trend (Bullish, Bearish, or Consolidation). //
// //
// 2. **Confirmation & Momentum:** Signals are confirmed with a blend of the Natural Market Slope and a Cyclic //
// RSI to ensure momentum aligns with the primary trend. //
// //
// 3. **Advanced Filtering Layers:** A suite of optional filters allows for robust customization: //
// - **Volume & ADX:** Ensure sufficient market participation and trend strength. //
// - **Market Regime:** Uses total crypto market cap to gauge broad market health. //
// - **Multi-Timeframe (MTF):** Aligns signals with the dominant weekly trend. //
// - **BTC Cycle Analysis:** Uses Halving or Mayer Multiple models to position trades within historical //
// macro cycles. //
// //
// --- VISUAL INTERFACE --- //
// The strategy's real power comes from its on-chart visual feedback system, which provides full transparency. //
// ****Note: for this to be enabled recalculate 'on every tick' needs to be enabled in the properties settings. //
// 1. **Power Core Gauge:** Located at the bottom-center, this gauge is the heart of the system. It displays the //
// number of active filter conditions that have been met (e.g., 5/6). It "powers up" as more conditions align,//
// glowing brightly when a signal is fully confirmed and ready. //
// //
// 2. **Live Conditions Panel:** In the bottom-right corner, this panel acts as a detailed pre-flight checklist. //
// It shows the real-time status of every single filter, helping you understand exactly why a trade is (or //
// is not) being triggered. //
// //
// 3. **Energized Trendline:** The main SAMA trendline changes color and brightness based on the strength and //
// direction of the trend, providing immediate visual context. //
// //
// 4. **Halving cycle visualisation:** Visual guide to halving phases //
// //
// --- HOW TO USE --- //
// 1. **Select Operation Mode:** Use "Backtest Mode" to test settings and "Alerts-Only Mode" for live signals. //
// //
// 2. **Configure Strategy:** Start with the default filters. If a potential trade setup is missed, check the //
// **Live Conditions Panel** to see exactly which filter blocked the signal. Adjust the filters to suit your //
// specific asset and timeframe. //
// //
// 3. **Manage Risk:** Adjust the Risk & Exit settings to match your personal risk tolerance. //

Kaufman Trend Strength Signal█ Overview
Kaufman Trend Strength Signal is an advanced trend detection tool that decomposes price action into its underlying directional trend and localized oscillation using a vector-based Kalman Filter.
By integrating adaptive smoothing and dynamic weighting via a weighted moving average (WMA), this indicator provides real-time insight into both trend direction and trend strength — something standard moving averages often fail to capture.
The core model assumes that observed price consists of two components:
(1) a directional trend, and
(2) localized noise or oscillation.
Using a two-step Predict & Update cycle, the filter continuously refines its trend estimate as new market data becomes available.
█ How It Works
This indicator employs a Kalman Filter model that separates the trend from short-term fluctuations in a price series.
Predict & Update Cycle : With each new bar, the filter predicts the price state and updates that prediction using the latest observed price, producing a smooth but adaptive trend line.
Trend Strength Normalization : Internally, the oscillator component is normalized against recent values (N periods) to calculate a trend strength score between -100 and +100.
(Note: The oscillator is not plotted on the chart but is used for signal generation.)
Filtered MA Line : The trend component is plotted as a smooth Kalman Filter-based moving average (MA) line on the main chart.
Threshold Cross Signals : When the internal trend strength crosses a user-defined threshold (default: ±60), visual entry arrows are displayed to signal momentum shifts.
█ Key Features
Adaptive Trend Estimation : Real-time filtering that adjusts dynamically to market changes.
Visual Buy/Sell Signals : Entry arrows appear when the trend strength crosses above or below the configured threshold.
Built-in Range Filter : The MA line turns blue when trend strength is weak (|value| < 10), helping you filter out choppy, sideways conditions.
█ How to Use
Trend Detection :
• Green MA = bullish trend
• Red MA = bearish trend
• Blue MA = no trend / ranging market
Entry Signals :
• Green triangle = trend strength crossed above +Threshold → potential bullish entry
• Red triangle = trend strength crossed below -Threshold → potential bearish entry
█ Settings
Entry Threshold : Level at which the trend strength triggers entry signals (default: 60)
Process Noise 1 & 2 : Control the filter’s responsiveness to recent price action. Higher = more reactive; lower = smoother.
Measurement Noise : Sets how much the filter "trusts" price data. High = smoother MA, low = faster response but more noise.
Trend Lookback (N2) : Number of bars used to normalize trend strength. Lower = more sensitive; higher = more stable.
Trend Smoothness (R2) : WMA smoothing applied to the trend strength calculation.
█ Visual Guide
Green MA Line → Bullish trend
Red MA Line → Bearish trend
Blue MA Line → Sideways/range
Green Triangle → Entry signal (trend strengthening)
Red Triangle → Entry signal (trend weakening)
█ Best Practices
In high-volatility conditions, increase Measurement Noise to reduce false signals.
Combine with other indicators (e.g., RSI, MACD, EMA) for confirmation and filtering.
Adjust "Entry Threshold" and noise settings depending on your timeframe and trading style.
❗ Disclaimer
This script is provided for educational purposes only and should not be considered financial advice or a recommendation to buy/sell any asset.
Trading involves risk. Past performance does not guarantee future results.
Always perform your own analysis and use proper risk management when trading.

Kaufman Trend Strategy# ✅ Kaufman Trend Strategy – Full Description (Script Publishing Version)
**Kaufman Trend Strategy** is a dynamic trend-following strategy based on Kaufman Filter theory.
It detects real-time trend momentum, reduces noise, and aims to enhance entry accuracy while optimizing risk.
⚠️ _For educational and research purposes only. Past performance does not guarantee future results._
---
## 🎯 Strategy Objective
- Smooth price noise using Kaufman Filter smoothing
- Detect the strength and direction of trends with a normalized oscillator
- Manage profits using multi-stage take-profits and adaptive ATR stop-loss logic
---
## ✨ Key Features
- **Kaufman Filter Trend Detection**
Extracts directional signal using a state space model.
- **Multi-Stage Profit-Taking**
Automatically takes partial profits based on color changes and zero-cross events.
- **ATR-Based Volatility Stops**
Stops adjust based on swing highs/lows and current market volatility.
---
## 📊 Entry & Exit Logic
**Long Entry**
- `trend_strength ≥ 60`
- Green trend signal
- Price above the Kaufman average
**Short Entry**
- `trend_strength ≤ -60`
- Red trend signal
- Price below the Kaufman average
**Exit (Long/Short)**
- Blue trend color → TP1 (50%)
- Oscillator crosses 0 → TP2 (25%)
- Trend weakens → Final exit (25%)
- ATR + swing-based stop loss
---
## 💰 Risk Management
- Initial capital: `$3,000`
- Order size: `$100` per trade (realistic, low-risk sizing)
- Commission: `0.002%`
- Slippage: `2 ticks`
- Pyramiding: `1` max position
- Estimated risk/trade: `~0.1–0.5%` of equity
> ⚠️ _No trade risks more than 5% of equity. This strategy follows TradingView script publishing rules._
---
## ⚙️ Default Parameters
- **1st Take Profit**: 50%
- **2nd Take Profit**: 25%
- **Final Exit**: 25%
- **ATR Period**: 14
- **Swing Lookback**: 10
- **Entry Threshold**: ±60
- **Exit Threshold**: ±40
---
## 📅 Backtest Summary
- **Symbol**: USD/JPY
- **Timeframe**: 1H
- **Date Range**: Jan 3, 2022 – Jun 4, 2025
- **Trades**: 924
- **Win Rate**: 41.67%
- **Profit Factor**: 1.108
- **Net Profit**: +$1,659.29 (+54.56%)
- **Max Drawdown**: -$1,419.73 (-31.87%)
---
## ✅ Summary
This strategy uses Kaufman filtering to detect market direction with reduced lag and increased smoothness.
It’s built with visual clarity and strong trade management, making it practical for both beginners and advanced users.
---
## 📌 Disclaimer
This script is for educational and informational purposes only and should not be considered financial advice.
Use with proper risk controls and always test in a demo environment before live trading.

Trailing Monster StrategyTrailing Monster Strategy
This is an experimental trend-following strategy that incorporates a custom adaptive moving average (PKAMA), RSI-based momentum filtering, and dynamic trailing stop-loss logic. It is designed for educational and research purposes only, and may require further optimization or risk management considerations prior to live deployment.
Strategy Logic
The strategy attempts to participate in sustained price trends by combining:
- A Power Kaufman Adaptive Moving Average (PKAMA) for dynamic trend detection,
- RSI and Simple Moving Average (SMA) filters for market condition confirmation,
- A delayed trailing stop-loss to manage exits once a trade is in profit.
Entry Conditions
Long Entry:
- RSI exceeds the overbought threshold (default: 70),
- Price is trading above the 200-period SMA,
- PKAMA slope is positive (indicating upward momentum),
- A minimum number of bars have passed since the last entry.
Short Entry:
- RSI falls below the oversold threshold (default: 30),
- Price is trading below the 200-period SMA,
- PKAMA slope is negative (indicating downward momentum),
-A minimum number of bars have passed since the last entry.
Exit Conditions
- A trailing stop-loss is applied once the position has been open for a user-defined number of bars.
- The trailing distance is calculated as a fixed percentage of the average entry price.
Technical Notes
This script implements a custom version of the Power Kaufman Adaptive Moving Average (PKAMA), conceptually inspired by alexgrover’s public implementation on TradingView .
Unlike traditional moving averages, PKAMA dynamically adjusts its responsiveness based on recent market volatility, allowing it to better capture trend changes in fast-moving assets like altcoins.
Disclaimer
This strategy is provided for educational purposes only.
It is not financial advice, and no guarantee of profitability is implied.
Always conduct thorough backtesting and forward testing before using any strategy in a live environment.
Adjust inputs based on your individual risk tolerance, asset class, and trading style.
Feedback is encouraged. You are welcome to fork and modify this script to suit your own preferences and market approach.

Litecoin Trailing-Stop StrategyAltcoins Trailing-Stop Strategy
This strategy is based on a momentum breakout approach using PKAMA (Powered Kaufman Adaptive Moving Average) as a trend filter, and a delayed trailing stop mechanism to manage risk effectively.
It has been designed and fine-tuned Altcoins, which historically shows consistent volatility patterns and clean trend structures, especially on intraday timeframes like 15m and 30m.
Strategy Logic:
Entry Conditions:
Long when PKAMA indicates an upward move
Short when PKAMA detects a downward trend
Minimum spacing of 30 bars between trades to avoid overtrading
Trailing Stop:
Activated only after a customizable delay (delayBars)
User can set trailing stop % and delay independently
Helps avoid premature exits due to short-term volatility
Customizable Parameters:
This strategy uses a custom implementation of PKAMA (Powered Kaufman Adaptive Moving Average), inspired by the work of alexgrover
PKAMA is a volatility-aware moving average that adjusts dynamically to market conditions, making it ideal for altcoins where trend strength and direction change frequently.
This script is for educational and experimental purposes only. It is not financial advice. Please test thoroughly before using it in live conditions, and always adapt parameters to your specific asset and time frame.
Feedback is welcome! Feel free to clone and adapt it for your own trading style.

Fourier Transformed & Kalman Filtered EMA Crossover [Mattes]The Fourier Transformed & Kalman Filtered EMA Crossover (FTKF EMAC) is a trend-following indicator that leverages Fourier Transform approximation, Kalman Filtration, and two Exponential Moving Averages (EMAs) of different lengths to provide accurate and smooth market trend signals. By combining these three components, it captures the underlying market cycles, reduces noise, and produces actionable insights, making it suitable for detecting both emerging trends and confirming existing ones.
TECHNICALITIES:
>>> The Fourier Transform approximation is designed to identify dominant cyclical patterns in price action by focusing on key frequencies, while filtering out noise and less significant movements. It emphasizes the most meaningful price cycles, enabling the indicator to isolate important trends while ignoring minor fluctuations. This cyclical awareness adds an extra layer of depth to trend detection, allowing the EMAs to work with a cleaner and more reliable data set.
>>> The Kalman Filter adds dynamic noise reduction, adjusting its predictions of future price trends based on past and current data. As new price data comes in, the filter recalibrates itself to ensure that the price action remains smooth and devoid of erratic movements. This real-time adjustment is key to minimizing lag while avoiding false signals, which ensures that the EMAs react to more accurate and stable market data. The Kalman Filter’s ability to smooth price data without losing sensitivity to trend changes complements the Fourier approximation, ensuring a high level of precision in volatile and stable market environments.
>>> The EMA Crossover involves using two EMAs: a shorter EMA that reacts quickly to price movements and a longer EMA that responds more slowly. The shorter EMA is responsible for capturing immediate market shifts, detecting potential bullish or bearish trends. The longer EMA smooths out price fluctuations and provides trend confirmation, working with the shorter EMA to ensure the signals are reliable. When the shorter EMA crosses above the longer EMA, it indicates a bullish trend, likewise when it goes below the longer EMA, it signals a bearish trend. This setup provides a clear way to track market direction, with color-coded signals (green for bullish, red for bearish) for visual clarity. The flexibility of adjusting the EMA periods allows traders to fine-tune the indicator to their preferred timeframe and strategy, making it adaptable to different market conditions.
|-> A key technical aspect is that the first EMA should always be shorter than the second one. If the first EMA is longer than the second, the tool’s effectiveness is compromised because the faster EMA is designed to signal long conditions, while the longer one is made for signaling a bearish trend. Reversing their roles would lead to delayed or confused signals, reducing the indicator’s ability to detect trend shifts early and making it less efficient in volatile markets. This is the only key weakness of the indicator, failure to submit to this rule will result in confusion.
>>> These components work together like a clock to create a comprehensive and effective trend-following system. The Fourier approximation highlights key cyclical movements, the Kalman Filter refines these movements by removing noise, and the EMAs interpret the filtered data to generate actionable trend signals. Each component enhances the next, ensuring that the final output is both responsive and reliable, with minimal false signals or lag. creating an indicator using widespread concepts which haven't been combined before.
Summary
This indicator combines Fourier Transform approximation, Kalman Filtration, and two EMAs of different lengths to deliver accurate and timely trend-following signals. The Fourier approximation identifies dominant market cycles, while the Kalman Filter dynamically removes noise and refines the price data in real time. The two EMAs then use this filtered data to generate buy and sell signals based on their crossovers. The shorter EMA reacts quickly to price changes, while the longer EMA provides smoother trend confirmation. The components work in synergy to capture trends with minimal false signals or lag, ensuring traders can act promptly on market shifts. Customizable EMA periods make the tool adaptable to different market conditions, enhancing its versatility for various trading strategies.
To use the indicator, traders should adjust the EMA lengths based on their timeframe and strategy, ensuring that the shorter EMA remains shorter than the longer EMA to preserve the tool’s responsiveness. The color-coded signals offer visual clarity, making it easy to identify potential entry and exit points. This confluence of Fourier, Kalman, and EMA methodologies provides a smooth, highly effective trend-following tool that excels in both trending and ranging markets.
Adaptive MA Scalping StrategyAdaptive MA Scalping Strategy
The Adaptive MA Scalping Strategy is an innovative trading approach that merges the strengths of the Kaufman's Adaptive Moving Average (KAMA) with the Moving Average Convergence Divergence (MACD) histogram. This combination results in a momentum-adaptive moving average that dynamically adjusts to market conditions, providing traders with timely and reliable signals.
How It Works
Kaufman's Adaptive Moving Average (KAMA): Unlike traditional moving averages, KAMA adjusts its sensitivity based on market volatility. It becomes more responsive during trending markets and less sensitive during periods of consolidation, effectively filtering out market noise.
MACD Histogram Integration: The strategy incorporates the MACD histogram, a momentum indicator that measures the difference between a fast and a slow exponential moving average (EMA). By adding the MACD histogram values to the KAMA, the strategy creates a new line—the momentum-adaptive moving average (MOMA)—which captures both trend direction and momentum.
Signal Generation:
Long Entry: The strategy enters a long position when the closing price crosses above the MOMA. This indicates a potential upward momentum shift.
Exit Position: The position is closed when the closing price crosses below the MOMA, signaling a potential decline in momentum.
Cloud Calculation Detail
The MOMA is calculated by adding the MACD histogram value to the KAMA of the price. This addition effectively adjusts the KAMA based on the momentum indicated by the MACD histogram. When momentum is strong, the MACD histogram will have higher values, causing the MOMA to adjust accordingly and provide earlier entry or exit signals.
Performance on Stocks
This strategy has demonstrated excellent performance on stocks when applied to the 1-hour timeframe. Its adaptive nature allows it to respond swiftly to market changes, capturing profitable trends while minimizing the impact of false signals caused by market noise. The combination of KAMA's adaptability and MACD's momentum detection makes it particularly effective in volatile market conditions commonly seen in stock trading.
Key Parameters
KAMA Length (malen): Determines the sensitivity of the KAMA. A length of 100 is used to balance responsiveness with noise reduction.
MACD Fast Length (fast): Sets the period for the fast EMA in the MACD calculation. A value of 24 helps in capturing short-term momentum changes.
MACD Slow Length (slow): Sets the period for the slow EMA in the MACD calculation. A value of 52 smooths out longer-term trends.
MACD Signal Length (signal): Determines the period for the signal line in the MACD calculation. An 18-period signal line is used for timely crossovers.
Advantages of the Strategy
Adaptive to Market Conditions: By adjusting to both volatility and momentum, the strategy remains effective across different market phases.
Enhanced Signal Accuracy: The fusion of KAMA and MACD reduces false signals, improving the accuracy of trade entries and exits.
Simplicity in Execution: With straightforward entry and exit rules based on price crossovers, the strategy is user-friendly for traders at all experience levels

KAMA Cloud STIndicator:
Description:
The KAMA Cloud indicator is a sophisticated trading tool designed to provide traders with insights into market trends and their intensity. This indicator is built on the Kaufman Adaptive Moving Average (KAMA), which dynamically adjusts its sensitivity to filter out market noise and respond to significant price movements. The KAMA Cloud leverages multiple KAMAs to gauge trend direction and strength, offering a visual representation that is easy to interpret.
How It Works:
The KAMA Cloud uses twenty different KAMA calculations, each set to a distinct lookback period ranging from 5 to 100. These KAMAs are calculated using the average of the open, high, low, and close prices (OHLC4), ensuring a balanced view of price action. The relative positioning of these KAMAs helps determine the direction of the market trend and its momentum.
By measuring the cumulative relative distance between these KAMAs, the indicator effectively assesses the overall trend strength, akin to how the Average True Range (ATR) measures market volatility. This cumulative measure helps in identifying the trend’s robustness and potential sustainability.
The visualization component of the KAMA Cloud is particularly insightful. It plots a 'cloud' formed between the base KAMA (set at a 100-period lookback) and an adjusted KAMA that incorporates the cumulative relative distance scaled up. This cloud changes color based on the trend direction — green for upward trends and red for downward trends, providing a clear, visual representation of market conditions.
How the Strategy Works:
The KAMA Cloud ST strategy employs multiple KAMA calculations with varying lengths to capture the nuances of market trends. It measures the relative distances between these KAMAs to determine the trend's direction and strength, much like the original indicator. The strategy enhances decision-making by plotting a 'cloud' formed between the base KAMA (set to a 100-period lookback) and an adjusted KAMA that scales according to the cumulative relative distance of all KAMAs.
Key Components of the Strategy:
Multiple KAMA Layers: The strategy calculates KAMAs for periods ranging from 5 to 100 to analyze short to long-term market trends.
Dynamic Cloud: The cloud visually represents the trend’s strength and direction, updating in real-time as the market evolves.
Signal Generation: Trade signals are generated based on the orientation of the cloud relative to a smoothed version of the upper KAMA boundary. Long positions are initiated when the market trend is upward, and the current cloud value is above its smoothed average. Conversely, positions are closed when the trend reverses, indicated by the cloud falling below the smoothed average.
Suggested Usage:
Market: Stocks, not cryptocurrency
Timeframe: 1 Hour
Indicator:

KAMA CloudDescription:
The KAMA Cloud indicator is a sophisticated trading tool designed to provide traders with insights into market trends and their intensity. This indicator is built on the Kaufman Adaptive Moving Average (KAMA), which dynamically adjusts its sensitivity to filter out market noise and respond to significant price movements. The KAMA Cloud leverages multiple KAMAs to gauge trend direction and strength, offering a visual representation that is easy to interpret.
How It Works:
The KAMA Cloud uses twenty different KAMA calculations, each set to a distinct lookback period ranging from 5 to 100. These KAMAs are calculated using the average of the open, high, low, and close prices (OHLC4), ensuring a balanced view of price action. The relative positioning of these KAMAs helps determine the direction of the market trend and its momentum.
By measuring the cumulative relative distance between these KAMAs, the indicator effectively assesses the overall trend strength, akin to how the Average True Range (ATR) measures market volatility. This cumulative measure helps in identifying the trend’s robustness and potential sustainability.
The visualization component of the KAMA Cloud is particularly insightful. It plots a 'cloud' formed between the base KAMA (set at a 100-period lookback) and an adjusted KAMA that incorporates the cumulative relative distance scaled up. This cloud changes color based on the trend direction — green for upward trends and red for downward trends, providing a clear, visual representation of market conditions.
Benefits:
Dynamic Sensitivity: By adapting to the market's volatility, KAMA provides more reliable signals than traditional moving averages.
Trend Clarity: The color-coded cloud visually enhances the perception of the trend’s direction and strength, making it easier for traders to decide on their trading strategy.
Versatility: Suitable for various asset classes, including stocks, forex, commodities, and cryptocurrencies, across different timeframes.
Decision Support: Helps traders understand not just the direction but the strength of trends, aiding in more informed decision-making regarding entries, exits, and risk management.
Usage:
The KAMA Cloud is ideal for traders who need a robust trend-following tool that adjusts according to market dynamics. It can be used as a standalone indicator or in conjunction with other technical analysis tools to enhance trading strategies. Look for the cloud’s color shifts as potential signals for trend reversals or continuations, and consider the cloud’s thickness as an indication of trend strength.
Whether you are a day trader, swing trader, or long-term investor, the KAMA Cloud offers a unique approach to understanding market trends, helping you navigate the complexities of various market conditions with confidence.
