MTF K-Means Price Regimes [matteovesperi] ⚠️ The preview uses a custom example to identify support/resistance zones. due to the fact that this identifier clusterizes, this is possible. this example was set up "in a hurry", therefore it has a possible inaccuracy. When setting up the indicator, it is extremely important to select the correct parameters and double-check them on the selected history.
📊 OVERVIEW
Purpose
MTF K-Means Price Regimes is a TradingView indicator that automatically identifies and classifies the current market regime based on the K-Means machine learning algorithm. The indicator uses data from a higher timeframe (Multi-TimeFrame, MTF) to build stable classification and applies it to the working timeframe in real-time.
Key Features
✅ Automatic market regime detection — the algorithm finds clusters of similar market conditions
✅ Multi-timeframe (MTF) — clustering on higher TF, application on lower TF
✅ Adaptive — model recalculates when a new HTF bar appears with a rolling window
✅ Non-Repainting — classification is performed only on closed bars
✅ Visualization — bar coloring + information panel with cluster characteristics
✅ Flexible settings — from 2 to 10 clusters, customizable feature periods, HTF selection
━━━━━━━━━━━━━━━━━━━━━━━━━━━━━━━━━━━━━━━━━━━━━━━━━━━━━━━━━━━━━━━━━
🔬 TECHNICAL DETAILS
K-Means Clustering Algorithm
What is K-Means?
K-Means is one of the most popular clustering algorithms (unsupervised machine learning). It divides a dataset into K groups (clusters) so that similar elements are within each cluster, and different elements are between clusters.
Algorithm objective:
Minimize within-cluster variance (sum of squared distances from points to their cluster center).
How Does K-Means Work in Our Indicator?
Step 1: Data Collection
The indicator accumulates history from the higher timeframe (HTF):
RSI (Relative Strength Index) — overbought/oversold indicator
ATR% (Average True Range as % of price) — volatility indicator
ΔP% (Price Change in %) — trend strength and direction indicator
By default, 200 HTF bars are accumulated (clusterLookback parameter).
Step 2: Creating Feature Vectors
Each HTF bar is described by a three-dimensional vector:
Vector =
Step 3: Normalization (Z-Score)
All features are normalized to bring them to a common scale:
Normalized_Value = (Value - Mean) / StdDev
This is critically important, as RSI is in the range 0-100, while ATR% and ΔP% have different scales. Without normalization, one feature would dominate over others.
Step 4: K-Means++ Centroid Initialization
Instead of random selection of K initial centers, an improved K-Means++ method is used:
First centroid is randomly selected from the data
Each subsequent centroid is selected with probability proportional to the square of the distance to the nearest already selected centroid
This ensures better initial centroid distribution and faster convergence
Step 5: Iterative Optimization (Lloyd's Algorithm)
Repeat until convergence (or maxIterations):
1. Assignment step:
For each point find the nearest centroid and assign it to this cluster
2. Update step:
Recalculate centroids as the average of all points in each cluster
3. Convergence check:
If centroids shifted less than 0.001 → STOP
Euclidean distance in 3D space is used:
Distance = sqrt((RSI1 - RSI2)² + (ATR1 - ATR2)² + (ΔP1 - ΔP2)²)
Step 6: Adaptive Update
With each new HTF bar:
The oldest bar is removed from history (rolling window method)
New bar is added to history
K-Means algorithm is executed again on updated data
Model remains relevant for current market conditions
Real-Time Classification
After building the model (clusters + centroids), the indicator works in classification mode:
On each closed bar of the current timeframe, RSI, ATR%, ΔP% are calculated
Feature vector is normalized using HTF statistics (Mean/StdDev)
Distance to all K centroids is calculated
Bar is assigned to the cluster with minimum distance
Bar is colored with the corresponding cluster color
Important: Classification occurs only on a closed bar (barstate.isconfirmed), which guarantees no repainting .
Data Architecture
Persistent variables (var):
├── featureVectors - Normalized HTF feature vectors
├── centroids - Cluster center coordinates (K * 3 values)
├── assignments - Assignment of each HTF bar to a cluster
├── htfRsiHistory - History of RSI values from HTF
├── htfAtrHistory - History of ATR values from HTF
├── htfPcHistory - History of price changes from HTF
├── htfCloseHistory - History of close prices from HTF
├── htfRsiMean, htfRsiStd - Statistics for RSI normalization
├── htfAtrMean, htfAtrStd - Statistics for ATR normalization
├── htfPcMean, htfPcStd - Statistics for Price Change normalization
├── isCalculated - Model readiness flag
└── currentCluster - Current active cluster
All arrays are synchronized and updated atomically when a new HTF bar appears.
Computational Complexity
Data collection: O(1) per bar
K-Means (one pass):
- Assignment: O(N * K) where N = number of points, K = number of clusters
- Update: O(N * K)
- Total: O(N * K * I) where I = number of iterations (usually 5-20)
Example: With N=200 HTF bars, K=5 clusters, I=20 iterations:
200 * 5 * 20 = 20,000 operations (executes quickly)
━━━━━━━━━━━━━━━━━━━━━━━━━━━━━━━━━━━━━━━━━━━━━━━━━━━━━━━━━━━━━━━━━
📖 USER GUIDE
Quick Start
1. Adding the Indicator
TradingView → Indicators → Favorites → MTF K-Means Price Regimes
Or copy the code from mtf_kmeans_price_regimes.pine into Pine Editor.
2. First Launch
When adding the indicator to the chart, you'll see a table in the upper right corner:
┌─────────────────────────┐
│ Status │ Collecting HTF │
├─────────────────────────┤
│ Collected│ 15 / 50 │
└─────────────────────────┘
This means the indicator is accumulating history from the higher timeframe. Wait until the counter reaches the minimum (default 50 bars for K=5).
3. Active Operation
After data collection is complete, the main table with cluster information will appear:
┌────┬──────┬──────┬──────┬──────────────┬────────┐
│ ID │ RSI │ ATR% │ ΔP% │ Description │Current │
├────┼──────┼──────┼──────┼──────────────┼────────┤
│ 1 │ 68.5 │ 2.15 │ 1.2 │ High Vol,Bull│ │
│ 2 │ 52.3 │ 0.85 │ 0.1 │ Low Vol,Flat │ ► │
│ 3 │ 35.2 │ 1.95 │ -1.5 │ High Vol,Bear│ │
└────┴──────┴──────┴──────┴──────────────┴────────┘
The arrow ► indicates the current active regime. Chart bars are colored with the corresponding cluster color.
Customizing for Your Strategy
Choosing Higher Timeframe (HTF)
Rule: HTF should be at least 4 times higher than the working timeframe.
| Working TF | Recommended HTF |
|------------|-----------------|
| 1 min | 15 min - 1H |
| 5 min | 1H - 4H |
| 15 min | 4H - D |
| 1H | D - W |
| 4H | D - W |
| D | W - M |
HTF Selection Effect:
Lower HTF (closer to working TF): More sensitive, frequently changing classification
Higher HTF (much larger than working TF): More stable, long-term regime assessment
Number of Clusters (K)
K = 2-3: Rough division (e.g., "uptrend", "downtrend", "flat")
K = 4-5: Optimal for most cases (DEFAULT: 5)
K = 6-8: Detailed segmentation (requires more data)
K = 9-10: Very fine division (only for long-term analysis with large windows)
Important constraint:
clusterLookback ≥ numClusters * 10
I.e., for K=5 you need at least 50 HTF bars, for K=10 — at least 100 bars.
Clustering Depth (clusterLookback)
This is the rolling window size for building the model.
50-100 HTF bars: Fast adaptation to market changes
200 HTF bars: Optimal balance (DEFAULT)
500-1000 HTF bars: Long-term, stable model
If you get an "Insufficient data" error:
Decrease clusterLookback
Or select a lower HTF (e.g., "4H" instead of "D")
Or decrease numClusters
Color Scheme
Default 10 colors:
Red → Often: strong bearish, high volatility
Orange → Transition, medium volatility
Yellow → Neutral, decreasing activity
Green → Often: strong bullish, high volatility
Blue → Medium bullish, medium volatility
Purple → Oversold, possible reversal
Fuchsia → Overbought, possible reversal
Lime → Strong upward momentum
Aqua → Consolidation, low volatility
White → Undefined regime (rare)
Important: Cluster colors are assigned randomly at each model recalculation! Don't rely on "red = bearish". Instead, look at the description in the table (RSI, ATR%, ΔP%).
You can customize colors in the "Colors" settings section.
━━━━━━━━━━━━━━━━━━━━━━━━━━━━━━━━━━━━━━━━━━━━━━━━━━━━━━━━━━━━━━━━━
⚙️ INDICATOR PARAMETERS
Main Parameters
Higher Timeframe (htf)
Type: Timeframe selection
Default: "D" (daily)
Description: Timeframe on which the clustering model is built
Recommendation: At least 4 times larger than your working TF
Clustering Depth (clusterLookback)
Type: Integer
Range: 50 - 2000
Default: 200
Description: Number of HTF bars for building the model (rolling window size)
Recommendation:
- Increase for more stable long-term model
- Decrease for fast adaptation or if there's insufficient historical data
Number of Clusters (K) (numClusters)
Type: Integer
Range: 2 - 10
Default: 5
Description: Number of market regimes the algorithm will identify
Recommendation:
- K=3-4 for simple strategies (trending/ranging)
- K=5-6 for universal strategies
- K=7-10 only when clusterLookback ≥ 100*K
Max K-Means Iterations (maxIterations)
Type: Integer
Range: 5 - 50
Default: 20
Description: Maximum number of algorithm iterations
Recommendation:
- 10-20 is sufficient for most cases
- Increase to 30-50 if using K > 7
Feature Parameters
RSI Period (rsiLength)
Type: Integer
Default: 14
Description: Period for RSI calculation (overbought/oversold feature)
Recommendation:
- 14 — standard
- 7-10 — more sensitive
- 20-25 — more smoothed
ATR Period (atrLength)
Type: Integer
Default: 14
Description: Period for ATR calculation (volatility feature)
Recommendation: Usually kept equal to rsiLength
Price Change Period (pcLength)
Type: Integer
Default: 5
Description: Period for percentage price change calculation (trend feature)
Recommendation:
- 3-5 — short-term trend
- 10-20 — medium-term trend
Visualization
Show Info Panel (showDashboard)
Type: Checkbox
Default: true
Description: Enables/disables the information table on the chart
Cluster Color 1-10
Type: Color selection
Description: Customize colors for visual cluster distinction
Recommendation: Use contrasting colors for better readability
━━━━━━━━━━━━━━━━━━━━━━━━━━━━━━━━━━━━━━━━━━━━━━━━━━━━━━━━━━━━━━━━━
📊 INTERPRETING RESULTS
Reading the Information Table
┌────┬──────┬──────┬──────┬──────────────┬────────┐
│ ID │ RSI │ ATR% │ ΔP% │ Description │Current │
├────┼──────┼──────┼──────┼──────────────┼────────┤
│ 1 │ 68.5 │ 2.15 │ 1.2 │ High Vol,Bull│ │
│ 2 │ 52.3 │ 0.85 │ 0.1 │ Low Vol,Flat │ ► │
│ 3 │ 35.2 │ 1.95 │ -1.5 │ High Vol,Bear│ │
│ 4 │ 45.0 │ 1.20 │ -0.3 │ Low Vol,Bear │ │
│ 5 │ 72.1 │ 3.05 │ 2.8 │ High Vol,Bull│ │
└────┴──────┴──────┴──────┴──────────────┴────────┘
"ID" Column
Cluster number (1-K). Order doesn't matter.
"RSI" Column
Average RSI value in the cluster (0-100):
< 30: Oversold zone
30-45: Bearish sentiment
45-55: Neutral zone
55-70: Bullish sentiment
> 70: Overbought zone
"ATR%" Column
Average volatility in the cluster (as % of price):
< 1%: Low volatility (consolidation, narrow range)
1-2%: Normal volatility
2-3%: Elevated volatility
> 3%: High volatility (strong movements, impulses)
Compared to the average volatility across all clusters to determine "High Vol" or "Low Vol".
"ΔP%" Column
Average price change in the cluster (in % over pcLength period):
> +0.05%: Bullish regime
-0.05% ... +0.05%: Flat (sideways movement)
< -0.05%: Bearish regime
"Description" Column
Automatic interpretation:
"High Vol, Bull" → Strong upward momentum, high activity
"Low Vol, Flat" → Consolidation, narrow range, uncertainty
"High Vol, Bear" → Strong decline, panic, high activity
"Low Vol, Bull" → Slow growth, low activity
"Low Vol, Bear" → Slow decline, low activity
"Current" Column
Arrow ► shows which cluster the last closed bar of your working timeframe is in.
Typical Cluster Patterns
Example 1: Trend/Flat Division (K=3)
Cluster 1: RSI=65, ATR%=2.5, ΔP%=+1.5 → Bullish trend
Cluster 2: RSI=50, ATR%=0.8, ΔP%=0.0 → Flat/Consolidation
Cluster 3: RSI=35, ATR%=2.3, ΔP%=-1.4 → Bearish trend
Strategy: Open positions when regime changes Flat → Trend, avoid flat.
Example 2: Volatility Breakdown (K=5)
Cluster 1: RSI=72, ATR%=3.5, ΔP%=+2.5 → Strong bullish impulse (high risk)
Cluster 2: RSI=60, ATR%=1.5, ΔP%=+0.8 → Moderate bullish (optimal entry point)
Cluster 3: RSI=50, ATR%=0.7, ΔP%=0.0 → Flat
Cluster 4: RSI=40, ATR%=1.4, ΔP%=-0.7 → Moderate bearish
Cluster 5: RSI=28, ATR%=3.2, ΔP%=-2.3 → Strong bearish impulse (panic)
Strategy: Enter in Cluster 2 or 4, avoid extremes (1, 5).
Example 3: Mixed Regimes (K=7+)
With large K, clusters can represent condition combinations:
High RSI + Low volatility → "Quiet overbought"
Neutral RSI + High volatility → "Uncertainty with high activity"
Etc.
Requires individual analysis of each cluster.
Regime Changes
Important signal: Transition from one cluster to another!
Trading situation examples:
Flat → Bullish trend → Buy signal
Bullish trend → Flat → Take profit, close longs
Flat → Bearish trend → Sell signal
Bearish trend → Flat → Close shorts, wait
You can build a trading system based on the current active cluster and transitions between them.
━━━━━━━━━━━━━━━━━━━━━━━━━━━━━━━━━━━━━━━━━━━━━━━━━━━━━━━━━━━━━━━━━
💡 USAGE EXAMPLES
Example 1: Scalping with HTF Filter
Task: Scalping on 5-minute charts, but only enter in the direction of the daily regime.
Settings:
Working TF: 5 min
HTF: D (daily)
K: 3 (simple division)
clusterLookback: 100
Logic:
IF current cluster = "Bullish" (ΔP% > 0.5)
→ Look for long entry points on 5M
IF current cluster = "Bearish" (ΔP% < -0.5)
→ Look for short entry points on 5M
IF current cluster = "Flat"
→ Don't trade / reduce risk
Example 2: Swing Trading with Volatility Filtering
Task: Swing trading on 4H, enter only in regimes with medium volatility.
Settings:
Working TF: 4H
HTF: D (daily)
K: 5
clusterLookback: 200
Logic:
Allowed clusters for entry:
- ATR% from 1.5% to 2.5% (not too quiet, not too chaotic)
- ΔP% with clear direction (|ΔP%| > 0.5)
Prohibited clusters:
- ATR% > 3% → Too risky (possible gaps, sharp reversals)
- ATR% < 1% → Too quiet (small movements, commissions eat profit)
Example 3: Portfolio Rotation
Task: Managing a portfolio of multiple assets, allocate capital depending on regimes.
Settings:
Working TF: D (daily)
HTF: W (weekly)
K: 4
clusterLookback: 100
Logic:
For each asset in portfolio:
IF regime = "Strong trend + Low volatility"
→ Increase asset weight in portfolio (40-50%)
IF regime = "Medium trend + Medium volatility"
→ Standard weight (20-30%)
IF regime = "Flat" or "High volatility without trend"
→ Minimum weight or exclude (0-10%)
Example 4: Combining with Other Indicators
MTF K-Means as a filter:
Main strategy: MA Crossover
Filter: MTF K-Means on higher TF
Rule:
IF MA_fast > MA_slow AND Cluster = "Bullish regime"
→ LONG
IF MA_fast < MA_slow AND Cluster = "Bearish regime"
→ SHORT
ELSE
→ Don't trade (regime doesn't confirm signal)
This dramatically reduces false signals in unsuitable market conditions.
━━━━━━━━━━━━━━━━━━━━━━━━━━━━━━━━━━━━━━━━━━━━━━━━━━━━━━━━━━━━━━━━━
📈 OPTIMIZATION RECOMMENDATIONS
Optimal Settings for Different Styles
Day Trading
Working TF: 5M - 15M
HTF: 1H - 4H
numClusters: 4-5
clusterLookback: 100-150
Swing Trading
Working TF: 1H - 4H
HTF: D
numClusters: 5-6
clusterLookback: 150-250
Position Trading
Working TF: D
HTF: W - M
numClusters: 4-5
clusterLookback: 100-200
Scalping
Working TF: 1M - 5M
HTF: 15M - 1H
numClusters: 3-4
clusterLookback: 50-100
Backtesting
To evaluate effectiveness:
Load historical data (minimum 2x clusterLookback HTF bars)
Apply the indicator with your settings
Study cluster change history:
- Do changes coincide with actual trend transitions?
- How often do false signals occur?
Optimize parameters:
- If too much noise → increase HTF or clusterLookback
- If reaction too slow → decrease HTF or increase numClusters
Combining with Other Techniques
Regime-Based Approach:
MTF K-Means (regime identification)
↓
+---+---+---+
| | | |
v v v v
Trend Flat High_Vol Low_Vol
↓ ↓ ↓ ↓
Strategy_A Strategy_B Don't_trade
Examples:
Trend: Use trend-following strategies (MA crossover, Breakout)
Flat: Use mean-reversion strategies (RSI, Bollinger Bands)
High volatility: Reduce position sizes, widen stops
Low volatility: Expect breakout, don't open positions inside range
━━━━━━━━━━━━━━━━━━━━━━━━━━━━━━━━━━━━━━━━━━━━━━━━━━━━━━━━━━━━━━━━━
📞 SUPPORT
Report an Issue
If you found a bug or have a suggestion for improvement:
Describe the problem in as much detail as possible
Specify your indicator settings
Attach a screenshot (if possible)
Specify the asset and timeframe where the problem is observed
Kmeans

Lorentzian Key Support and Resistance Level Detector [mishy]🧮 Lorentzian Key S/R Levels Detector
Advanced Support & Resistance Detection Using Mathematical Clustering
The Problem
Traditional S/R indicators fail because they're either subjective (manual lines), rigid (fixed pivots), or break when price spikes occur. Most importantly, they don't tell you where prices actually spend time, just where they touched briefly.
The Solution: Lorentzian Distance Clustering
This indicator introduces a novel approach by using Lorentzian distance instead of traditional Euclidean distance for clustering. This is groundbreaking for financial data analysis.
Data Points Clustering:
🔬 Why Euclidean Distance Fails in Trading
Traditional K-means uses Euclidean distance:
• Formula: distance = (price_A - price_B)²
• Problem: Squaring amplifies differences exponentially
• Real impact: One 5% price spike has 25x more influence than a 1% move
• Result: Clusters get pulled toward outliers, missing real support/resistance zones
Example scenario:
Prices: ← flash spike
Euclidean: Centroid gets dragged toward 150
Actual S/R zone: Around 100 (where prices actually trade)
⚡ Lorentzian Distance: The Game Changer
Our approach uses Lorentzian distance:
• Formula: distance = log(1 + (price_difference)² / σ²)
• Breakthrough: Logarithmic compression keeps outliers in check
• Real impact: Large moves still matter, but don't dominate
• Result: Clusters focus on where prices actually spend time
Same example with Lorentzian:
Prices: ← flash spike
Lorentzian: Centroid stays near 100 (real trading zone)
Outlier (150): Acknowledged but not dominant
🧠 Adaptive Intelligence
The σ parameter isn't fixed,it's calculated from market disturbance/entropy:
• High volatility: σ increases, making algorithm more tolerant of large moves
• Low volatility: σ decreases, making algorithm more sensitive to small changes
• Self-calibrating: Adapts to any instrument or market condition automatically
Why this matters: Traditional methods treat a 2% move the same whether it's in a calm or volatile market. Lorentzian adapts the sensitivity based on current market behavior.
🎯 Automatic K-Selection (Elbow Method)
Instead of guessing how many S/R levels to draw, the indicator:
• Tests 2-6 clusters and calculates WCSS (tightness measure)
• Finds the "elbow" - where adding more clusters stops helping much
• Uses sharpness calculation to pick the optimal number automatically
Result: Perfect balance between detail and clarity.
How It Works
1. Collect recent closing prices
2. Calculate entropy to adapt to current market volatility
3. Cluster prices using Lorentzian K-means algorithm
4. Auto-select optimal cluster count via statistical analysis
5. Draw levels at cluster centers with deviation bands
📊 Manual K-Selection Guide (Using WCSS & Sharpness Analysis)
When you disable auto-selection, use both WCSS and Sharpness metrics from the analysis table to choose manually:
What WCSS tells you:
• Lower WCSS = tighter clusters = better S/R levels
• Higher WCSS = scattered clusters = weaker levels
What Sharpness tells you:
• Higher positive values = optimal elbow point = best K choice
• Lower/negative values = poor elbow definition = avoid this K
• Measures the "sharpness" of the WCSS curve drop-off
Decision strategy using both metrics:
K=2: WCSS = 150.42 | Sharpness = - | Selected =
K=3: WCSS = 89.15 | Sharpness = 22.04 | Selected = ✓ ← Best choice
K=4: WCSS = 76.23 | Sharpness = 1.89 | Selected =
K=5: WCSS = 73.91 | Sharpness = 1.43 | Selected =
Quick decision rules:
• Pick K with highest positive Sharpness (indicates optimal elbow)
• Confirm with significant WCSS drop (30%+ reduction is good)
• Avoid K values with negative or very low Sharpness (<1.0)
• K=3 above shows: Big WCSS drop (41%) + High Sharpness (22.04) = Perfect choice
Why this works:
The algorithm finds the "elbow" where adding more clusters stops being useful. High Sharpness pinpoints this elbow mathematically, while WCSS confirms the clustering quality.
Elbow Method Visualization:
Traditional clustering problems:
❌ Price spikes distort results
❌ Fixed parameters don't adapt
❌ Manual tuning is subjective
❌ No way to validate choices
Lorentzian solution:
☑️ Outlier-resistant distance metric
☑️ Entropy-based adaptation to volatility
☑️ Automatic optimal K selection
☑️ Statistical validation via WCSS & Sharpness
Features
Visual:
• Color-coded levels (red=highest resistance, green=lowest support)
• Optional deviation bands showing cluster spread
• Strength scores on labels: Each cluster shows a reliability score.
• Higher scores (0.8+) = very strong S/R levels with tight price clustering
• Lower scores (0.6-0.7) = weaker levels, use with caution
• Based on cluster tightness and data point density
• Clean line extensions and labels
Analytics:
• WCSS analysis table showing why K was chosen
• Cluster metrics and statistics
• Real-time entropy monitoring
Control:
• Auto/manual K selection toggle
• Customizable sample size (20-500 bars)
• Show/hide bands and metrics tables
The Result
You get mathematically validated S/R levels that focus on where prices actually cluster, not where they randomly spiked. The algorithm adapts to market conditions and removes guesswork from level selection.
Best for: Traders who want objective, data-driven S/R levels without manual chart analysis.
Credits: This script is for educational purposes and is inspired by the work of @ThinkLogicAI and an amazing mentor @DskyzInvestments . It demonstrates how Lorentzian geometrical concepts can be applied not only in ML classification but also quite elegantly in clustering.

Trend Matrix - XTrend Matrix - X: Advanced Market Trend Analysis
Introduction: Trend Matrix - X is a powerful indicator designed to provide a comprehensive view of market trends, state transitions, and dynamics. By integrating advanced algorithms, statistical methods, and smoothing techniques, it identifies Bullish, Bearish, or Ranging market states while offering deep insights into trend behavior.
This indicator is ideal for traders seeking a balance between noise reduction and real-time responsiveness, with configurations that adapt dynamically to market conditions.
How It Works?
The indicator combines K-Median Clustering, Kalman Filtering, Fractal Dimension Analysis, and various regression techniques to provide actionable insights.
Market State Detection
- Divides data into three clusters: Bullish, Bearish, and Ranging.
- Uses K-Median Clustering to partition data based on medians, ensuring robust state classification even in volatile markets.
- Slope-Based Trend Analysis: Calculates trend slopes using Linear, Polynomial, or Exponential Regression. The slope represents the trend direction and strength, updated dynamically based on market conditions. It can apply Noise Reduction with Kalman Filter to balance stability and sensitivity
Dynamic Lookback Adjustment
- Automatically adjusts the analysis window length based on market stability, volatility, skewness, and kurtosis.
- This feature ensures the indicator remains responsive in fast-moving markets while providing stability in calmer conditions.
Fractal Dimension Measurement
- Calculates Katz Fractal Dimension to assess market roughness and choppiness.
- Helps identify periods of trend consistency versus noisy, range-bound markets.
Why Use Trend Matrix - X?
- Actionable Market States: Quickly determine whether the market is Bullish, Bearish, or Ranging.
- Advanced Smoothing: Reduces noise while maintaining trend-following precision.
- Dynamic Adaptation: Automatically adjusts to market conditions for consistent performance across varying environments.
- Customization: Configure regression type, lookback dynamics, and smoothing to suit your trading style.
- Integrated Visualization: Displays trend states, fractal dimensions, and cluster levels directly on the chart.
Configuration Options
Matrix Type (Raw or Filtered)
- Raw shows the unfiltered slope for real-time precision.
- Filtered applies Kalman smoothing for long-term trend clarity.
Regression Type
- Choose Linear, Polynomial, or Exponential Regression to calculate slopes based on your market strategy.
Dynamic Lookback Adjustment
- Enable Gradual Adjustment to smoothly adapt lookback periods in response to market volatility.
Noise Smoothing
- Toggle Smooth Market Noise to apply advanced filtering, balancing stability with responsiveness.
Cluster State Detection
- Visualize the current state of the market by coloring the candles to match the detected state.
How to Use the Trend Matrix - X Indicator
Step-by-Step Guide
Add the Indicator to Your Chart
- Once applied, it will display: Trend line (Trend Matrix) for identifying market direction, A state table showing the current market state (Bullish, Bearish, or Ranging), Cluster levels (High, Mid, and Low) for actionable price areas, Fractal dimension metrics to assess market choppiness or trend consistency.
Configure Your Settings
- Matrix Source (Raw vs. Filtered): Raw Matrix : Displays real-time, unsmoothed slope values for immediate precision. Ideal for fast-moving markets where rapid changes need to be tracked. Filtered Matrix : Applies advanced smoothing (Kalman Filter) for a clearer trend representation. Recommended for longer-term analysis or noisy markets
- Regression Type (Choose how the trend slope is calculated): Linear Regression : Tracks the average linear rate of change. Best for stable, straightforward trends. Polynomial Regression : Captures accelerating or decelerating trends with a curved fit. Ideal for dynamic, cyclical markets. Exponential Regression : Highlights compounding growth or decay rates. Perfect for parabolic trends or exponential moves.
- Market Noise Smoothing: Applies an adaptive (no lag) smoothing technique to the Matrix Source.
- Gradual Lookback Adjustment: Enable "Gradually Adjust Lookback" to allow the indicator to dynamically adapt its analysis window. (Indicator already does an automatic window, this just refines it).
Read the Outputs
- Trend Matrix Line: Upward Line (Bullish): Market is trending upward; look for buy opportunities. Downward Line (Bearish): Market is trending downward; look for sell opportunities.
- Cluster Levels: High Level (Cluster 0): Represents the upper bound of the trend, often used as a resistance level. Mid Level (Cluster 2): Serves as a key equilibrium point in the trend. Low Level (Cluster 1): Indicates the lower bound of the trend, often used as a support level.
- Market State Table: Displays the current state of the market. Bullish State: Strong upward trend, suitable for long positions. Bearish State: Strong downward trend, suitable for short positions. Ranging State: Sideways market, suitable for range-bound strategies.
- Fractal Dimension Analysis: Low Fractal Dimension (< 1.6): Indicates strong trend behavior; look for trend-following setups. High Fractal Dimension (> 1.6): Suggests choppy, noisy markets; focus on range-trading strategies.
Advanced Usage
- Adaptive Clustering: The indicator uses K-Median Clustering to dynamically identify Bullish, Bearish, and Ranging states based on market data. For traders interested in state transitions, monitor the cluster levels and the state table for actionable changes.
Trading Strategies
- Trend-Following: Use the Filtered Matrix and Fractal Dimension (< 1.6) to identify and follow strong trends. Enter long positions in Bullish States and short positions in Bearish States.
Disclaimer
I am not a professional market analyst, financial advisor, or trading expert. This indicator, Trend Matrix - X, is the result of personal research and development, created with the intention of contributing something that the trading community might find helpful.
It is important to note that this tool is experimental and provided "as-is" without any guarantees of accuracy, profitability, or suitability for any particular trading strategy. Trading involves significant financial risk, and past performance is not indicative of future results.
Users should exercise caution and use their own discretion when incorporating this indicator into their trading decisions. Always consult with a qualified financial advisor before making any financial or trading decisions.
By using this indicator, you acknowledge and accept full responsibility for your trading activities and outcomes. This tool is intended for educational and informational purposes only.

Adaptive SuperTrend Oscillator [AlgoAlpha]Adaptive SuperTrend Oscillator 🤖📈
Introducing the Adaptive SuperTrend Oscillator , an innovative blend of volatility clustering and SuperTrend logic designed to identify market trends with precision! 🚀 This indicator uses K-Means clustering to dynamically adjust volatility levels, helping traders spot bullish and bearish trends. The oscillator smoothly tracks price movements, adapting to market conditions for reliable signals. Whether you're scalping or riding long-term trends, this tool has got you covered! 💹✨
🔑 Key Features:
📊 Volatility Clustering with K-Means: Segments volatility into three levels (high, medium, low) using a K-Means algorithm for precise trend detection.
📈 Normalized Oscillator : Allows for customizable smoothing and normalization, ensuring the oscillator remains within a fixed range for easy interpretation.
🔄 Heiken Ashi Candles : Optionally visualize smoothed trends with Heiken Ashi-style candlesticks to better capture market momentum.
🔔 Alert System : Get notified when key conditions like trend shifts or volatility changes occur.
🎨 Customizable Appearance : Fully customizable colors for bullish/bearish signals, along with adjustable smoothing methods and lengths.
📚 How to Use:
⭐ Add the indicator to favorites by pressing the star icon. Customize settings to your preference:
👀 Watch the chart for trend signals and reversals. The oscillator will change color when trends shift, offering visual confirmation.
🔔 Enable alerts to be notified of critical trend changes or volatility conditions
⚙️ How It Works:
This script integrates SuperTrend with volatility clustering by analyzing ATR (Average True Range) to dynamically identify high, medium, and low volatility clusters using a K-Means algorithm . The SuperTrend logic adjusts based on the assigned volatility level, creating adaptive trend signals. These signals are then smoothed and optionally normalized for clearer visual interpretation. The Heiken Ashi transformation adds an additional layer of smoothing, helping traders better identify the market's true momentum. Alerts are set to notify users of key trend shifts and volatility changes, allowing traders to react promptly.

Correlation Clusters [LuxAlgo]The Correlation Clusters is a machine learning tool that allows traders to group sets of tickers with a similar correlation coefficient to a user-set reference ticker.
The tool calculates the correlation coefficients between 10 user-set tickers and a user-set reference ticker, with the possibility of forming up to 10 clusters.
🔶 USAGE
Applying clustering methods to correlation analysis allows traders to quickly identify which set of tickers are correlated with a reference ticker, rather than having to look at them one by one or using a more tedious approach such as correlation matrices.
Tickers belonging to a cluster may also be more likely to have a higher mutual correlation. The image above shows the detailed parts of the Correlation Clusters tool.
The correlation coefficient between two assets allows traders to see how these assets behave in relation to each other. It can take values between +1.0 and -1.0 with the following meaning
Value near +1.0: Both assets behave in a similar way, moving up or down at the same time
Value close to 0.0: No correlation, both assets behave independently
Value near -1.0: Both assets have opposite behavior when one moves up the other moves down, and vice versa
There is a wide range of trading strategies that make use of correlation coefficients between assets, some examples are:
Pair Trading: Traders may wish to take advantage of divergences in the price movements of highly positively correlated assets; even highly positively correlated assets do not always move in the same direction; when assets with a correlation close to +1.0 diverge in their behavior, traders may see this as an opportunity to buy one and sell the other in the expectation that the assets will return to the likely same price behavior.
Sector rotation: Traders may want to favor some sectors that are expected to perform in the next cycle, tracking the correlation between different sectors and between the sector and the overall market.
Diversification: Traders can aim to have a diversified portfolio of uncorrelated assets. From a risk management perspective, it is useful to know the correlation between the assets in your portfolio, if you hold equal positions in positively correlated assets, your risk is tilted in the same direction, so if the assets move against you, your risk is doubled. You can avoid this increased risk by choosing uncorrelated assets so that they move independently.
Hedging: Traders may want to hedge positions with correlated assets, from a hedging perspective, if you are long an asset, you can hedge going long a negatively correlated asset or going short a positively correlated asset.
Grouping different assets with similar behavior can be very helpful to traders to avoid over-exposure to those assets, traders may have multiple long positions on different assets as a way of minimizing overall risk when in reality if those assets are part of the same cluster traders are maximizing their risk by taking positions on assets with the same behavior.
As a rule of thumb, a trader can minimize risk via diversification by taking positions on assets with no correlations, the proposed tool can effectively show a set of uncorrelated candidates from the reference ticker if one or more clusters centroids are located near 0.
🔶 DETAILS
K-means clustering is a popular machine-learning algorithm that finds observations in a data set that are similar to each other and places them in a group.
The process starts by randomly assigning each data point to an initial group and calculating the centroid for each. A centroid is the center of the group. K-means clustering forms the groups in such a way that the variances between the data points and the centroid of the cluster are minimized.
It's an unsupervised method because it starts without labels and then forms and labels groups itself.
🔹 Execution Window
In the image above we can see how different execution windows provide different correlation coefficients, informing traders of the different behavior of the same assets over different time periods.
Users can filter the data used to calculate correlations by number of bars, by time, or not at all, using all available data. For example, if the chart timeframe is 15m, traders may want to know how different assets behave over the last 7 days (one week), or for an hourly chart set an execution window of one month, or one year for a daily chart. The default setting is to use data from the last 50 bars.
🔹 Clusters
On this graph, we can see different clusters for the same data. The clusters are identified by different colors and the dotted lines show the centroids of each cluster.
Traders can select up to 10 clusters, however, do note that selecting 10 clusters can lead to only 4 or 5 returned clusters, this is caused by the machine learning algorithm not detecting any more data points deviating from already detected clusters.
Traders can fine-tune the algorithm by changing the 'Cluster Threshold' and 'Max Iterations' settings, but if you are not familiar with them we advise you not to change these settings, the defaults can work fine for the application of this tool.
🔹 Correlations
Different correlations mean different behaviors respecting the same asset, as we can see in the chart above.
All correlations are found against the same asset, traders can use the chart ticker or manually set one of their choices from the settings panel. Then they can select the 10 tickers to be used to find the correlation coefficients, which can be useful to analyze how different types of assets behave against the same asset.
🔶 SETTINGS
Execution Window Mode: Choose how the tool collects data, filter data by number of bars, time, or no filtering at all, using all available data.
Execute on Last X Bars: Number of bars for data collection when the 'Bars' execution window mode is active.
Execute on Last: Time window for data collection when the `Time` execution window mode is active. These are full periods, so `Day` means the last 24 hours, `Week` means the last 7 days, and so on.
🔹 Clusters
Number of Clusters: Number of clusters to detect up to 10. Only clusters with data points are displayed.
Cluster Threshold: Number used to compare a new centroid within the same cluster. The lower the number, the more accurate the centroid will be.
Max Iterations: Maximum number of calculations to detect a cluster. A high value may lead to a timeout runtime error (loop takes too long).
🔹 Ticker of Reference
Use Chart Ticker as Reference: Enable/disable the use of the current chart ticker to get the correlation against all other tickers selected by the user.
Custom Ticker: Custom ticker to get the correlation against all the other tickers selected by the user.
🔹 Correlation Tickers
Select the 10 tickers for which you wish to obtain the correlation against the reference ticker.
🔹 Style
Text Size: Select the size of the text to be displayed.
Display Size: Select the size of the correlation chart to be displayed, up to 500 bars.
Box Height: Select the height of the boxes to be displayed. A high height will cause overlapping if the boxes are close together.
Clusters Colors: Choose a custom colour for each cluster.

Machine Learning Adaptive SuperTrend [AlgoAlpha]📈🤖 Machine Learning Adaptive SuperTrend - Take Your Trading to the Next Level! 🚀✨
Introducing the Machine Learning Adaptive SuperTrend , an advanced trading indicator designed to adapt to market volatility dynamically using machine learning techniques. This indicator employs k-means clustering to categorize market volatility into high, medium, and low levels, enhancing the traditional SuperTrend strategy. Perfect for traders who want an edge in identifying trend shifts and market conditions.
What is K-Means Clustering and How It Works
K-means clustering is a machine learning algorithm that partitions data into distinct groups based on similarity. In this indicator, the algorithm analyzes ATR (Average True Range) values to classify volatility into three clusters: high, medium, and low. The algorithm iterates to optimize the centroids of these clusters, ensuring accurate volatility classification.
Key Features
🎨 Customizable Appearance: Adjust colors for bullish and bearish trends.
🔧 Flexible Settings: Configure ATR length, SuperTrend factor, and initial volatility guesses.
📊 Volatility Classification: Uses k-means clustering to adapt to market conditions.
📈 Dynamic SuperTrend Calculation: Applies the classified volatility level to the SuperTrend calculation.
🔔 Alerts: Set alerts for trend shifts and volatility changes.
📋 Data Table Display: View cluster details and current volatility on the chart.
Quick Guide to Using the Machine Learning Adaptive SuperTrend Indicator
🛠 Add the Indicator: Add the indicator to favorites by pressing the star icon. Customize settings like ATR length, SuperTrend factor, and volatility percentiles to fit your trading style.
📊 Market Analysis: Observe the color changes and SuperTrend line for trend reversals. Use the data table to monitor volatility clusters.
🔔 Alerts: Enable notifications for trend shifts and volatility changes to seize trading opportunities without constant chart monitoring.
How It Works
The indicator begins by calculating the ATR values over a specified training period to assess market volatility. Initial guesses for high, medium, and low volatility percentiles are inputted. The k-means clustering algorithm then iterates to classify the ATR values into three clusters. This classification helps in determining the appropriate volatility level to apply to the SuperTrend calculation. As the market evolves, the indicator dynamically adjusts, providing real-time trend and volatility insights. The indicator also incorporates a data table displaying cluster centroids, sizes, and the current volatility level, aiding traders in making informed decisions.
Add the Machine Learning Adaptive SuperTrend to your TradingView charts today and experience a smarter way to trade! 🌟📊

RSI K-Means Clustering [UAlgo]The "RSI K-Means Clustering " indicator is a technical analysis tool that combines the Relative Strength Index (RSI) with K-means clustering techniques. This approach aims to provide more nuanced insights into market conditions by categorizing RSI values into overbought, neutral, and oversold clusters.
The indicator adjusts these clusters dynamically based on historical RSI data, allowing for more adaptive and responsive thresholds compared to traditional fixed levels. By leveraging K-means clustering, the indicator identifies patterns in RSI behavior, which can help traders make more informed decisions regarding market trends and potential reversals.
🔶 Key Features
K-means Clustering: The indicator employs K-means clustering, an unsupervised machine learning technique, to dynamically determine overbought, neutral, and oversold levels based on historical RSI data.
User-Defined Inputs: You can customize various aspects of the indicator's behavior, including:
RSI Source: Select the data source used for RSI calculation (e.g., closing price).
RSI Length: Define the period length for RSI calculation.
Training Data Size: Specify the number of historical RSI values used for K-means clustering.
Number of K-means Iterations: Set the number of iterations performed by the K-means algorithm to refine cluster centers.
Overbought/Neutral/Oversold Levels: You can define initial values for these levels, which will be further optimized through K-means clustering.
Alerts: The indicator can generate alerts for various events, including:
Trend Crossovers: Alerts for when the RSI crosses above/below the neutral zone, signaling potential trend changes.
Overbought/Oversold: Alerts when the RSI reaches the dynamically determined overbought or oversold thresholds.
Reversals: Alerts for potential trend reversals based on RSI crossing above/below the calculated overbought/oversold levels.
RSI Classification: Alerts based on the current RSI classification (ranging, uptrend, downtrend).
🔶 Interpreting Indicator
Adjusted RSI Value: The primary plot represents the adjusted RSI value, calculated based on the relative position of the current RSI compared to dynamically adjusted overbought and oversold levels. This value provides an intuitive measure of the market's momentum. The final overbought, neutral, and oversold levels are determined by K-means clustering and are displayed as horizontal lines. These levels serve as dynamic support and resistance points, indicating potential reversal zones.
Classification Symbols : The "RSI K-Means Clustering " indicator uses specific symbols to classify the current market condition based on the position of the RSI value relative to dynamically determined clusters. These symbols provide a quick visual reference to help traders understand the prevailing market sentiment. Here's a detailed explanation of each classification symbol:
Ranging Classification ("R")
This symbol appears when the RSI value is closest to the neutral threshold compared to the overbought or oversold thresholds. It indicates a ranging market, where the price is moving sideways without a clear trend direction. In this state, neither buyers nor sellers are in control, suggesting a period of consolidation or indecision. This is often seen as a time to wait for a breakout or reversal signal before taking a position.
Up-Trend Classification ("↑")
The up-trend symbol, represented by an upward arrow, is displayed when the RSI value is closer to the overbought threshold than to the neutral or oversold thresholds. This classification suggests that the market is in a bullish phase, with buying pressure outweighing selling pressure. Traders may consider this as a signal to enter or hold long positions, as the price is likely to continue rising until the market reaches an overbought condition.
Down-Trend Classification ("↓")
The down-trend symbol, depicted by a downward arrow, appears when the RSI value is nearest to the oversold threshold. This indicates a bearish market condition, where selling pressure dominates. The market is likely experiencing a downward movement, and traders might view this as an opportunity to enter or hold short positions. This symbol serves as a warning of potential further declines, especially if the RSI continues to move toward the oversold level.
Bullish Reversal ("▲")
This signal occurs when the RSI value crosses above the oversold threshold. It indicates a potential shift from a downtrend to an uptrend, suggesting that the market may start to move higher. Traders might use this signal as an opportunity to enter long positions.
Bearish Reversal ("▼")
This signal appears when the RSI value crosses below the overbought threshold. It suggests a possible transition from an uptrend to a downtrend, indicating that the market may begin to decline. This signal can alert traders to consider entering short positions or taking profits on long positions.
These classification symbols are plotted near the adjusted RSI line, with their positions adjusted based on the standard deviation and a distance multiplier. This placement helps in visualizing the classification's strength and ensuring clarity in the indicator's presentation. By monitoring these symbols, traders can quickly assess the market's state and make more informed trading decisions.
🔶 Disclaimer
Use with Caution: This indicator is provided for educational and informational purposes only and should not be considered as financial advice. Users should exercise caution and perform their own analysis before making trading decisions based on the indicator's signals.
Not Financial Advice: The information provided by this indicator does not constitute financial advice, and the creator (UAlgo) shall not be held responsible for any trading losses incurred as a result of using this indicator.
Backtesting Recommended: Traders are encouraged to backtest the indicator thoroughly on historical data before using it in live trading to assess its performance and suitability for their trading strategies.
Risk Management: Trading involves inherent risks, and users should implement proper risk management strategies, including but not limited to stop-loss orders and position sizing, to mitigate potential losses.
No Guarantees: The accuracy and reliability of the indicator's signals cannot be guaranteed, as they are based on historical price data and past performance may not be indicative of future results.

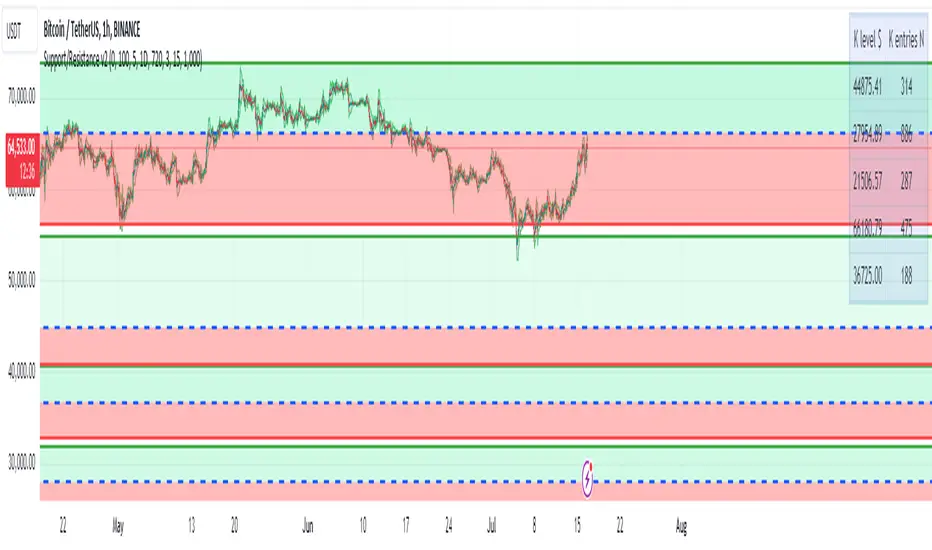
Support/Resistance v2 (ML) KmeanKmean with Standard Deviation Channel
1. Description of Kmean
Kmean (or K-means) is a popular clustering algorithm used to divide data into K groups based on their similarity. In the context of financial markets, Kmean can be applied to find the average price values over a specific period, allowing the identification of major trends and levels of support and resistance.
2. Application in Trading
In trading, Kmean is used to smooth out the price series and determine long-term trends. This helps traders make more informed decisions by avoiding noise and short-term fluctuations. Kmean can serve as a baseline around which other analytical tools, such as channels and bands, are constructed.
3. Description of Standard Deviation (stdev)
Standard deviation (stdev) is a statistical measure that indicates how much the values of data deviate from their mean value. In finance, standard deviation is often used to assess price volatility. A high standard deviation indicates strong price fluctuations, while a low standard deviation indicates stable movements.
4. Combining Kmean and Standard Deviation to Predict Short-Term Price Behavior
Combining Kmean and standard deviation creates a powerful tool for analyzing market conditions. Kmean shows the average price trend, while the standard deviation channels demonstrate the boundaries within which the price can fluctuate. This combination helps traders to:
Identify support and resistance levels.
Predict potential price reversals.
Assess risks and set stop-losses and take-profits.
Should you have any questions about code, please reach me at Tradingview directly.
Hope you find this script helpful!
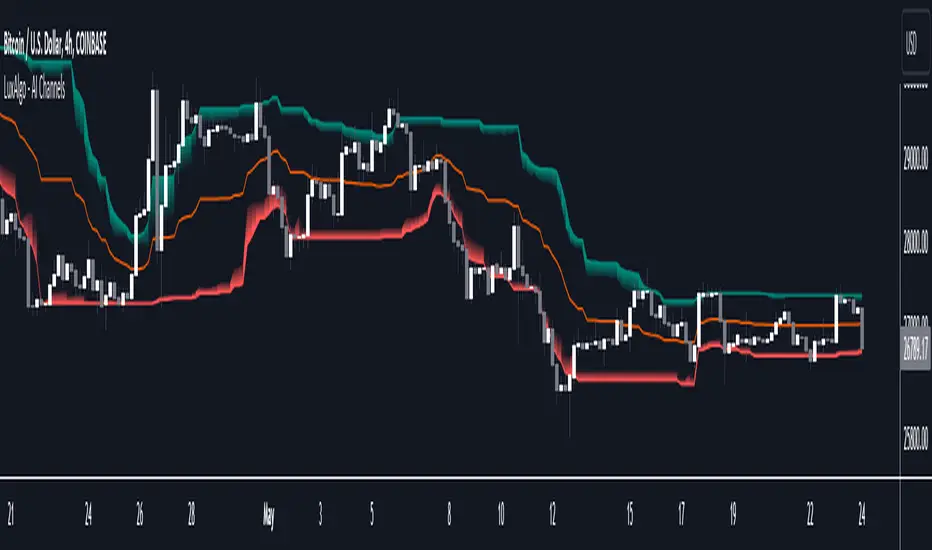
AI Channels (Clustering) [LuxAlgo]The AI Channels indicator is constructed based on rolling K-means clustering, a common machine learning method used for clustering analysis. These channels allow users to determine the direction of the underlying trends in the price.
We also included an option to display the indicator as a trailing stop from within the settings.
🔶 USAGE
Each channel extremity allows users to determine the current trend direction. Price breaking over the upper extremity suggesting an uptrend, and price breaking below the lower extremity suggesting a downtrend. Using a higher Window Size value will return longer-term indications.
The "Clusters" setting allows users to control how easy it is for the price to break an extremity, with higher values returning extremities further away from the price.
The "Denoise Channels" is enabled by default and allows to see less noisy extremities that are more coherent with the detected trend.
Users who wish to have more focus on a detected trend can display the indicator as a trailing stop.
🔹 Centroid Dispersion Areas
Each extremity is made of one area. The width of each area indicates how spread values within a cluster are around their centroids. A wider area would suggest that prices within a cluster are more spread out around their centroid, as such one could say that it is indicative of the volatility of a cluster.
Wider areas around a specific extremity can indicate a larger and more spread-out amount of prices within the associated cluster. In practice price entering an area has a higher chance to break an associated extremity.
🔶 DETAILS
The indicator performs K-means clustering over the most recent Window Size prices, finding a number of user-specified clusters. See here to find more information on cluster detection.
The channel extremities are returned as the centroid of the lowest, average, and highest price clusters.
K-means clustering can be computationally expensive and as such we allow users to determine the maximum number of iterations used to find the centroids as well as the number of most historical bars to perform the indicator calculation. Do note that increasing the calculation window of the indicator as well as the number of clusters will return slower results.
🔶 SETTINGS
Window Size: Amount of most recent prices to use for the calculation of the indicator.
Clusters": Amount of clusters detected for the calculation of the indicator.
Denoise Channels: When enabled, return less noisy channels extremities, disabling this setting will return the exact centroids at each time but will produce less regular extremities.
As Trailing Stop: Display the indicator as a trailing stop.
🔹 Optimization
This group of settings affects the runtime performance of the script.
Maximum Iteration Steps: Maximum number of iterations allowed for finding centroids. Excessively low values can return a better script load time but poor clustering.
Historical Bars Calculation: Calculation window of the script (in bars).
Support & Resistance AI (K means/median) [ThinkLogicAI]█ OVERVIEW
K-means is a clustering algorithm commonly used in machine learning to group data points into distinct clusters based on their similarities. While K-means is not typically used directly for identifying support and resistance levels in financial markets, it can serve as a tool in a broader analysis approach.
Support and resistance levels are price levels in financial markets where the price tends to react or reverse. Support is a level where the price tends to stop falling and might start to rise, while resistance is a level where the price tends to stop rising and might start to fall. Traders and analysts often look for these levels as they can provide insights into potential price movements and trading opportunities.
█ BACKGROUND
The K-means algorithm has been around since the late 1950s, making it more than six decades old. The algorithm was introduced by Stuart Lloyd in his 1957 research paper "Least squares quantization in PCM" for telecommunications applications. However, it wasn't widely known or recognized until James MacQueen's 1967 paper "Some Methods for Classification and Analysis of Multivariate Observations," where he formalized the algorithm and referred to it as the "K-means" clustering method.
So, while K-means has been around for a considerable amount of time, it continues to be a widely used and influential algorithm in the fields of machine learning, data analysis, and pattern recognition due to its simplicity and effectiveness in clustering tasks.
█ COMPARE AND CONTRAST SUPPORT AND RESISTANCE METHODS
1) K-means Approach:
Cluster Formation: After applying the K-means algorithm to historical price change data and visualizing the resulting clusters, traders can identify distinct regions on the price chart where clusters are formed. Each cluster represents a group of similar price change patterns.
Cluster Analysis: Analyze the clusters to identify areas where clusters tend to form. These areas might correspond to regions of price behavior that repeat over time and could be indicative of support and resistance levels.
Potential Support and Resistance Levels: Based on the identified areas of cluster formation, traders can consider these regions as potential support and resistance levels. A cluster forming at a specific price level could suggest that this level has been historically significant, causing similar price behavior in the past.
Cluster Standard Deviation: In addition to looking at the means (centroids) of the clusters, traders can also calculate the standard deviation of price changes within each cluster. Standard deviation is a measure of the dispersion or volatility of data points around the mean. A higher standard deviation indicates greater price volatility within a cluster.
Low Standard Deviation: If a cluster has a low standard deviation, it suggests that prices within that cluster are relatively stable and less likely to exhibit sudden and large price movements. Traders might consider placing tighter stop-loss orders for trades within these clusters.
High Standard Deviation: Conversely, if a cluster has a high standard deviation, it indicates greater price volatility within that cluster. Traders might opt for wider stop-loss orders to allow for potential price fluctuations without getting stopped out prematurely.
Cluster Density: Each data point is assigned to a cluster so a cluster that is more dense will act more like gravity and
2) Traditional Approach:
Trendlines: Draw trendlines connecting significant highs or lows on a price chart to identify potential support and resistance levels.
Chart Patterns: Identify chart patterns like double tops, double bottoms, head and shoulders, and triangles that often indicate potential reversal points.
Moving Averages: Use moving averages to identify levels where the price might find support or resistance based on the average price over a specific period.
Psychological Levels: Identify round numbers or levels that traders often pay attention to, which can act as support and resistance.
Previous Highs and Lows: Identify significant previous price highs and lows that might act as support or resistance.
The key difference lies in the approach and the foundation of these methods. Traditional methods are based on well-established principles of technical analysis and market psychology, while the K-means approach involves clustering price behavior without necessarily incorporating market sentiment or specific price patterns.
It's important to note that while the K-means approach might provide an interesting way to analyze price data, it should be used cautiously and in conjunction with other traditional methods. Financial markets are influenced by a wide range of factors beyond just price behavior, and the effectiveness of any method for identifying support and resistance levels should be thoroughly tested and validated. Additionally, developments in trading strategies and analysis techniques could have occurred since my last update.
█ K MEANS ALGORITHM
The algorithm for K means is as follows:
Initialize cluster centers
assign data to clusters based on minimum distance
calculate cluster center by taking the average or median of the clusters
repeat steps 1-3 until cluster centers stop moving
█ LIMITATIONS OF K MEANS
There are 3 main limitations of this algorithm:
Sensitive to Initializations: K-means is sensitive to the initial placement of centroids. Different initializations can lead to different cluster assignments and final results.
Assumption of Equal Sizes and Variances: K-means assumes that clusters have roughly equal sizes and spherical shapes. This may not hold true for all types of data. It can struggle with identifying clusters with uneven densities, sizes, or shapes.
Impact of Outliers: K-means is sensitive to outliers, as a single outlier can significantly affect the position of cluster centroids. Outliers can lead to the creation of spurious clusters or distortion of the true cluster structure.
█ LIMITATIONS IN APPLICATION OF K MEANS IN TRADING
Trading data often exhibits characteristics that can pose challenges when applying indicators and analysis techniques. Here's how the limitations of outliers, varying scales, and unequal variance can impact the use of indicators in trading:
Outliers are data points that significantly deviate from the rest of the dataset. In trading, outliers can represent extreme price movements caused by rare events, news, or market anomalies. Outliers can have a significant impact on trading indicators and analyses:
Indicator Distortion: Outliers can skew the calculations of indicators, leading to misleading signals. For instance, a single extreme price spike could cause indicators like moving averages or RSI (Relative Strength Index) to give false signals.
Risk Management: Outliers can lead to overly aggressive trading decisions if not properly accounted for. Ignoring outliers might result in unexpected losses or missed opportunities to adjust trading strategies.
Different Scales: Trading data often includes multiple indicators with varying units and scales. For example, prices are typically in dollars, volume in units traded, and oscillators have their own scale. Mixing indicators with different scales can complicate analysis:
Normalization: Indicators on different scales need to be normalized or standardized to ensure they contribute equally to the analysis. Failure to do so can lead to one indicator dominating the analysis due to its larger magnitude.
Comparability: Without normalization, it's challenging to directly compare the significance of indicators. Some indicators might have a larger numerical range and could overshadow others.
Unequal Variance: Unequal variance in trading data refers to the fact that some indicators might exhibit higher volatility than others. This can impact the interpretation of signals and the performance of trading strategies:
Volatility Adjustment: When combining indicators with varying volatility, it's essential to adjust for their relative volatilities. Failure to do so might lead to overemphasizing or underestimating the importance of certain indicators in the trading strategy.
Risk Assessment: Unequal variance can impact risk assessment. Indicators with higher volatility might lead to riskier trading decisions if not properly taken into account.
█ APPLICATION OF THIS INDICATOR
This indicator can be used in 2 ways:
1) Make a directional trade:
If a trader thinks price will go higher or lower and price is within a cluster zone, The trader can take a position and place a stop on the 1 sd band around the cluster. As one can see below, the trader can go long the green arrow and place a stop on the one standard deviation mark for that cluster below it at the red arrow. using this we can calculate a risk to reward ratio.
Calculating risk to reward: targeting a risk reward ratio of 2:1, the trader could clearly make that given that the next resistance area above that in the orange cluster exceeds this risk reward ratio.
2) Take a reversal Trade:
We can use cluster centers (support and resistance levels) to go in the opposite direction that price is currently moving in hopes of price forming a pivot and reversing off this level.
Similar to the directional trade, we can use the standard deviation of the cluster to place a stop just in case we are wrong.
In this example below we can see that shorting on the red arrow and placing a stop at the one standard deviation above this cluster would give us a profitable trade with minimal risk.
Using the cluster density table in the upper right informs the trader just how dense the cluster is. Higher density clusters will give a higher likelihood of a pivot forming at these levels and price being rejected and switching direction with a larger move.
█ FEATURES & SETTINGS
General Settings:
Number of clusters: The user can select from 3 to five clusters. A good rule of thumb is that if you are trading intraday, less is more (Think 3 rather than 5). For daily 4 to 5 clusters is good.
Cluster Method: To get around the outlier limitation of k means clustering, The median was added. This gives the user the ability to choose either k means or k median clustering. K means is the preferred method if the user things there are no large outliers, and if there appears to be large outliers or it is assumed there are then K medians is preferred.
Bars back To train on: This will be the amount of bars to include in the clustering. This number is important so that the user includes bars that are recent but not so far back that they are out of the scope of where price can be. For example the last 2 years we have been in a range on the sp500 so 505 days in this setting would be more relevant than say looking back 5 years ago because price would have to move far to get there.
Show SD Bands: Select this to show the 1 standard deviation bands around the support and resistance level or unselect this to just show the support and resistance level by itself.
Features:
Besides the support and resistance levels and standard deviation bands, this indicator gives a table in the upper right hand corner to show the density of each cluster (support and resistance level) and is color coded to the cluster line on the chart. Higher density clusters mean price has been there previously more than lower density clusters and could mean a higher likelihood of a reversal when price reaches these areas.
█ WORKS CITED
Victor Sim, "Using K-means Clustering to Create Support and Resistance", 2020, towardsdatascience.com
Chris Piech, "K means", stanford.edu
█ ACKNOLWEDGMENTS
@jdehorty- Thanks for the publish template. It made organizing my thoughts and work alot easier.

SignalProcessingClusteringKMeansLibrary "SignalProcessingClusteringKMeans"
K-Means Clustering Method.
nearest(point_x, point_y, centers_x, centers_y) finds the nearest center to a point and returns its distance and center index.
Parameters:
point_x : float, x coordinate of point.
point_y : float, y coordinate of point.
centers_x : float array, x coordinates of cluster centers.
centers_y : float array, y coordinates of cluster centers.
@ returns tuple of int, float.
bisection_search(samples, value) Bissection Search
Parameters:
samples : float array, weights to compare.
value : float array, weights to compare.
Returns: int.
label_points(points_x, points_y, centers_x, centers_y) labels each point index with cluster index and distance.
Parameters:
points_x : float array, x coordinates of points.
points_y : float array, y coordinates of points.
centers_x : float array, x coordinates of points.
centers_y : float array, y coordinates of points.
Returns: tuple with int array, float array.
kpp(points_x, points_y, n_clusters) K-Means++ Clustering adapted from Andy Allinger.
Parameters:
points_x : float array, x coordinates of the points.
points_y : float array, y coordinates of the points.
n_clusters : int, number of clusters.
Returns: tuple with 2 arrays, float array, int array.

Function K-Means ClusteringDescription:
A Function that returns cluster centers for given data (X,Y) vector points.
Inputs:
_X: Array containing x data points.¹
_Y: Array containing y data points.¹
_number_of_clusters: number of clusters.
Note:
¹: _X and _Y size must match.
Outputs:
_centers_x: Array containing x data points.
_centers_y: Array containing y data points.
Resources:
rosettacode.org
en.wikipedia.org
