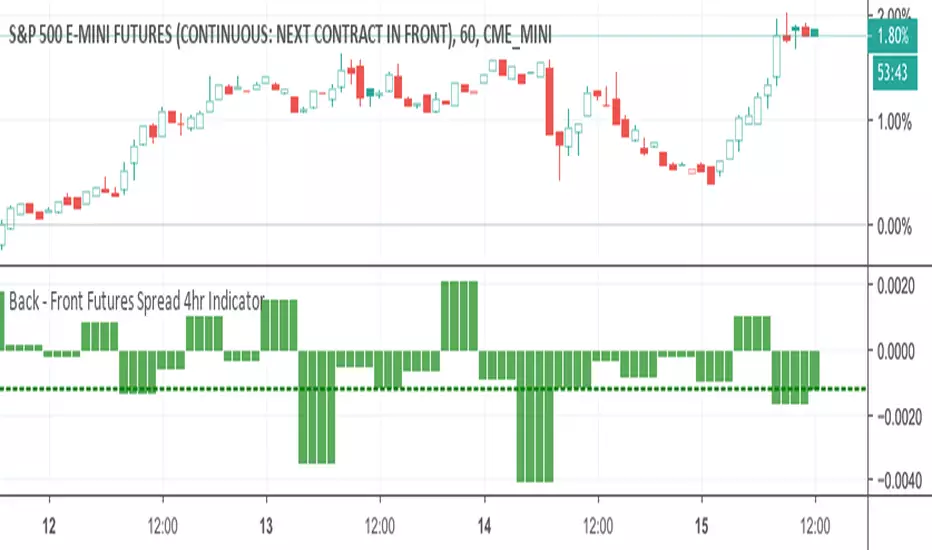
Back - Front Futures Spread 4hr IndicatorThis puts a normalized back - front spread based on the close price.
Linear Regression
Linear regression % channelThis channel is based on Linear regression by its % difference from the price
the high and the low are determine by the % from the close price . For the best fit you need to put the TF on the same min of the graph.
I put the channel to be 3 % above and bellow the price .by the same way you can add to the script more % line to make it better
this is good indicator for filtering (if you want your signal to be above or bellow the % channel) or if you want to enter at certain price and exit by the regular TV alerts so it more easy where your target for long or short exist

Dorsey InertiaThis indicator was originally developed by Donald Dorsey (Stocks & Commodities, V.13:9 (September, 1995): "Refining the Relative Volatility Index").
Inertia is based on Relative Volatility Index (RVI) smoothed using linear regression.
In physics, inertia is the tendency of an object to resist to acceleration. Dorsey chose this name because he believes that trend and inertia are related and that it takes more effort and energy to reverse the direction of a stock or market than to keep it in the same direction. He argues that the volatility is the simplest and most accurate measure of inertia.
When the indicator is below 50, it signals bearish market sentiment and when the indicator is above 50 it signals a bullish trend.
Good luck!

Kirshenbaum BandsThis indicator was originally developed by Paul Kirshenbaum, a mathematician with a Ph.D. in economics from New York University.
It uses the standard error of linear regression lines of the closing price to determine band width. This has the effect of measuring volatility around the current trend, rather than measuring volatility for changes in trend.
Good luck!

DSS Indicator V.1This is an indicator which can be used as a Decision Support System (DSS). In this version I use Heikin Ashi chart.
How to use:
1- Select the Heikin Ashi chart.
2- The default values of Length and Threshold for BTCUSDT in "1H chart" is 2 and 20 respectively. It can be changed to achieve the best performance for BTCUSDT or other symbols in arbitrary time frames.
3. When the background is green buy, and when the background is red sell.

Linear Regression of McGinley Dynamic DivergenceThis is a linear regression of McGinley Dynamic Divergence with Long and Short conditions
I've added a Threshold (editable in settings) which goes up and down with the same setting to generate more or less signals to accommodate the chosen ticker and timeframe.
The default settings have been selected to work best on BTCUSD M15 as shown above.
Green = Long Entry zone
Red = Short Entry zone

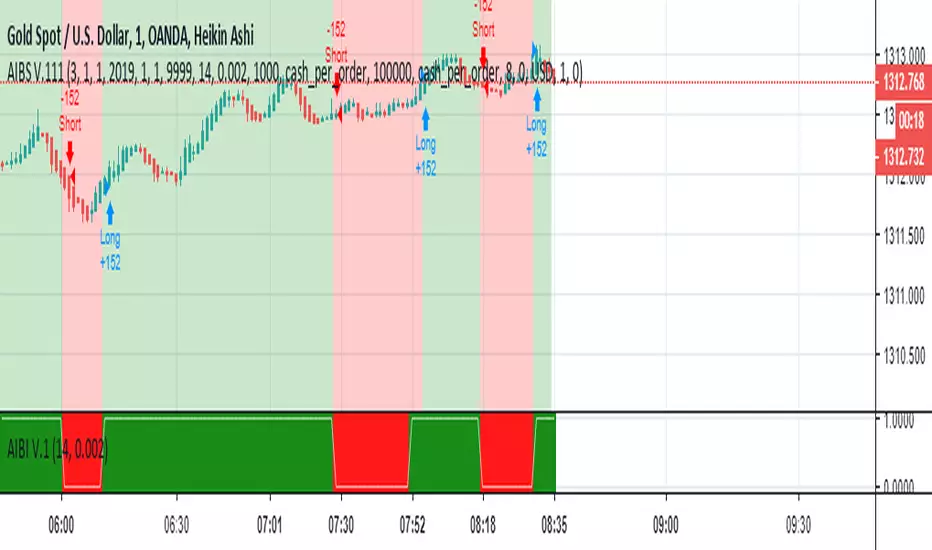
AI-Based Indicator V.1.01This is a Strategy based on Artificial Intelligence (AI) algorithms which can be used as a decision support system. In this version I use Heikin Ashi chart and reduce input parameters.
How to use:
1- Select the Heikin Ashi chart.
2- The default values of T for BTCUSD in "30m chart" is 0.12. It can be changed to achieve the best performance for BTCUSD or other tickers in arbitrary time frames.
3. When the background is green buy, and when the background is red sell.
TB!G-Scalp Strategy [Alert]Scalping Crypto Assets Made Easy
TB!G-Scalp is a TradingView based alert and accompanying strategy PineV3 Script.
Backtest vs Realtime
When designing the algorithms for this strategy our focus was primarily on ease of use.This results in a beautiful yet easy to use scalping strategy. As input it takes a chart period and only one extra parameter for fine tuning. The backtest results are an accurate representation of it’s real-time behaviour.
What makes it tick?
Over the last 2 years we collected a lot of market data regarding Bull and Bear behaviours. This previous market behaviour echo’s into the current market trend.
By recognising these echo’s we are able to anticipate an upcoming micro reversal which eventually end up being a scalping strategy.
Interested
Access is provided to a limited amount of people and for the duration that is determined by it’s Alpha Decay Rate.
This ADR is expected to become problematic after 2.3 year of usage on a lot of 150 users.

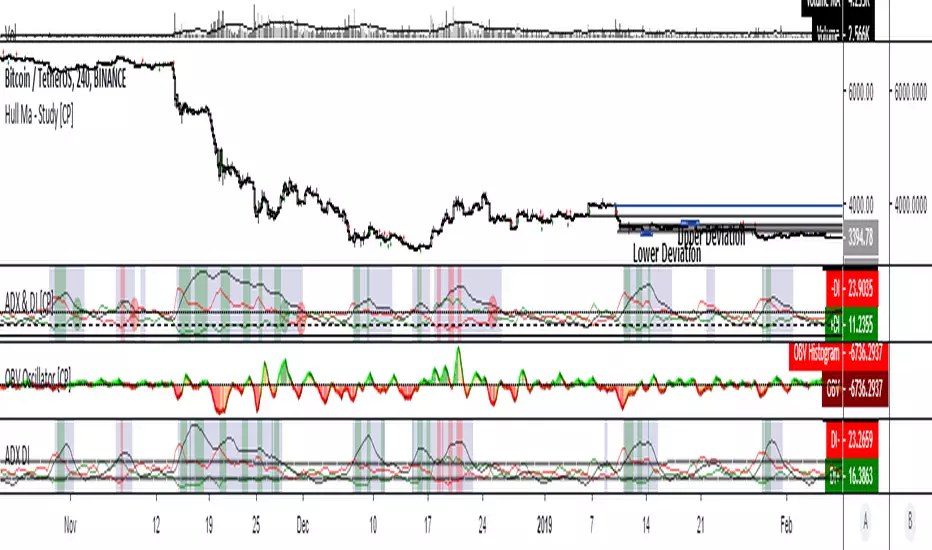
ADX & DI with Long + Short ConditionsMy version of the ADX & DI Indicator with an extra theshold and adjustable long and short conditions.
A green background (long) will appear when the ADX is rising, the DI+ is falling and the DI+ is below the (new) lower threshold.
A red background (short) will appear when the ADX is rising, the DI- is falling and the DI- is below the (new) lower treshold.
You can adjust the tolerance for the lower threshold in the settings of the indicator.
HLC Banded Quadratic RegressionHigh/Low/Close Banded Quadratic Regression is now available through this implementation, free for all to use. It's simple purpose is to plot multiple independent parabolic curvatures using a matrix equation that best fits the non-linear data sets of high, low, and close. Features include an available dark background disabled by default for the overlay chart, adjustable regression period, and a banding lines width adjustment. If you have any comments regarding this indicator, I will consider your thoughts and ideas presented below.

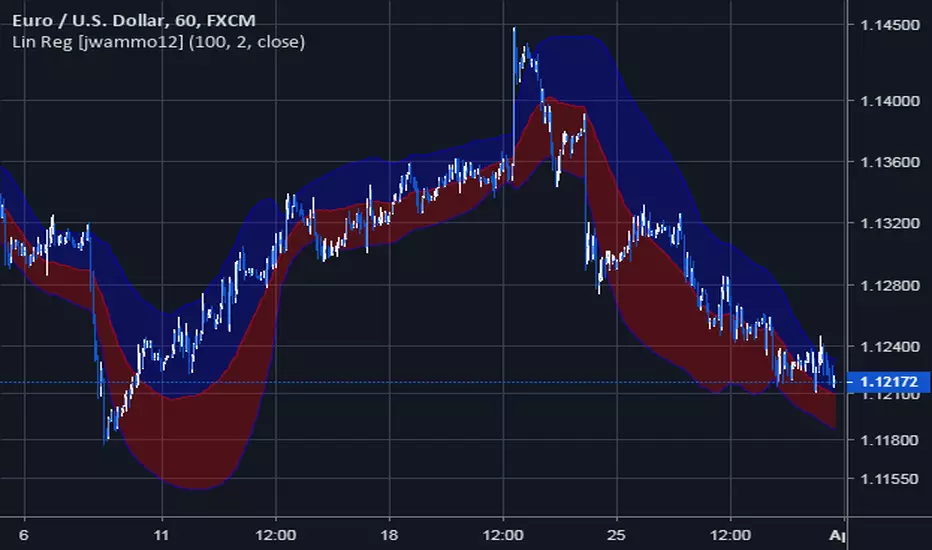
Linear Regression Channel [jwammo12]This is a non-repaint version of the built-in linear regression indicator in pine. It creates moving bands where the current bar matches the built-in Linear Regression indicator exactly (see screenshot). The key to replicating the built-in function is calculating the std deviation across the length of bars away from the current Linear Regression line, as opposed to the linear regression line that would have been calculated at the historic bar.
linreg-areas (like fib system just more accurate) So this system is a different approach to form a daily fib like system.
Its based on linear regression and its slope , we calculate the slope of the line and we put it in MTF format that is without security and non repainting (int2=1440 min)
As you in graph the coin in this case BTC has cycle from low to high similar to the fibs system.
the lowest level is bellow -0.2 , next level is -0.1 ,0,0.1 and above 0.2 is consider the highest
with this system its easy to find the highs and the lows as the coin go between the levels either up or down like the fibs system.
one can use this together with fibs system in order to make analysis more accurate.
also it easy to set signals once the slope go between levels either up or down . another advantage for this system compare to fibs system is the ability to reduce the MTF to lower frame let say 4 hour or even less and then by the same logic to create system of high and lows to the most smaller frames (but if you do that you need in code to change the levels setting numbers so it fit the best )
follow the direction of the slope and you will find the road that you wish:))

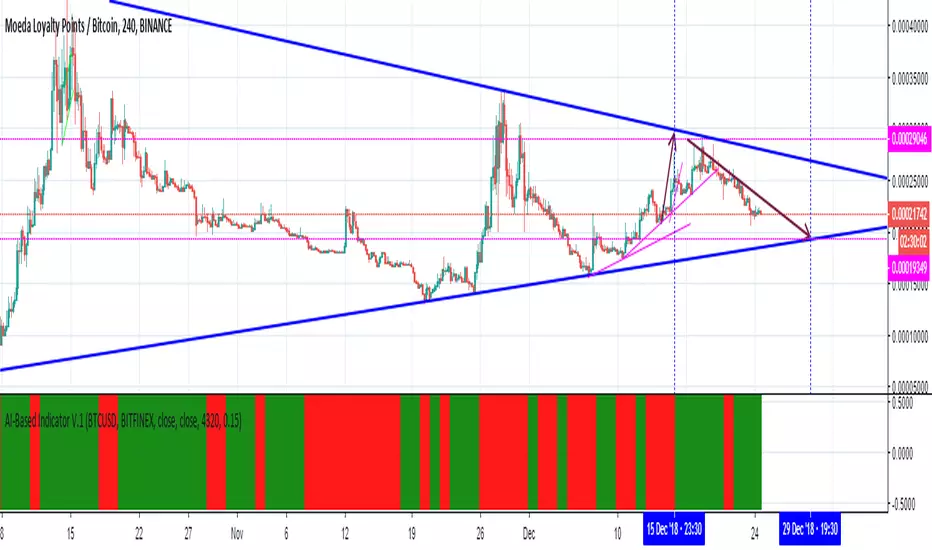
AI-Based Indicator V.1This is an indicator based on Artificial Intelligence (AI) algorithms which can be used (alone or along with other indicators) as a decision support system.
How to use:
1- The default values of Input 1, Input 2, R, and T for BTCUSD are “Close”, “Close”, 4320, and 0.15 respectively. They can be changed to achieve the best performance for BTCUSD or other tickers.
2- Use one of the time frames 4H to 15m.
3. When the background is green buy, and when the background is red sell.
24HLRThis indicator is 24 hours Linear regression line . with upper SD and lower SD (can be manipulated )
The idea is that the coin will bounce up or down around the LR line (red) when you go lower frame of 4h up to1 hour charts then you can see more easy the direction of the coin , its potential low or potential high , where the LR lead the way .
In this example we look on btc at 4hours chart and see that its in a cross road either to hell or to escape (if break the line going down upward)
and here in 1D graph

Trader Set - Trailing StopThis is the last tool for my methodology. It provides additional levels of support / resistance that you can use for trailing stop. Like every single tool in this toolbox and methodology, the formula being used is unique and totally original and you can't find it any where else.
Please don't contact me for getting access to these tools, they are only available for my students. Right now, the English version of the website and learning material is under development and soon, when they are ready I'll post a comment under every single script related to this methodology for those who are interested in participating for the course.
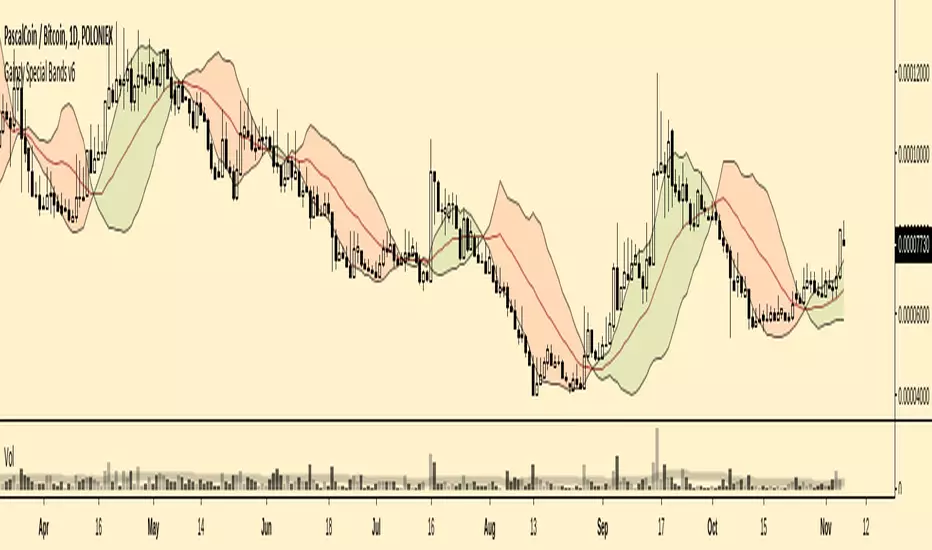
Gainzy Special Bands v6Gives entry & exit signals based on price action. Based on the idea of moving average mean reversions. Uses logarithmic linear regressions.
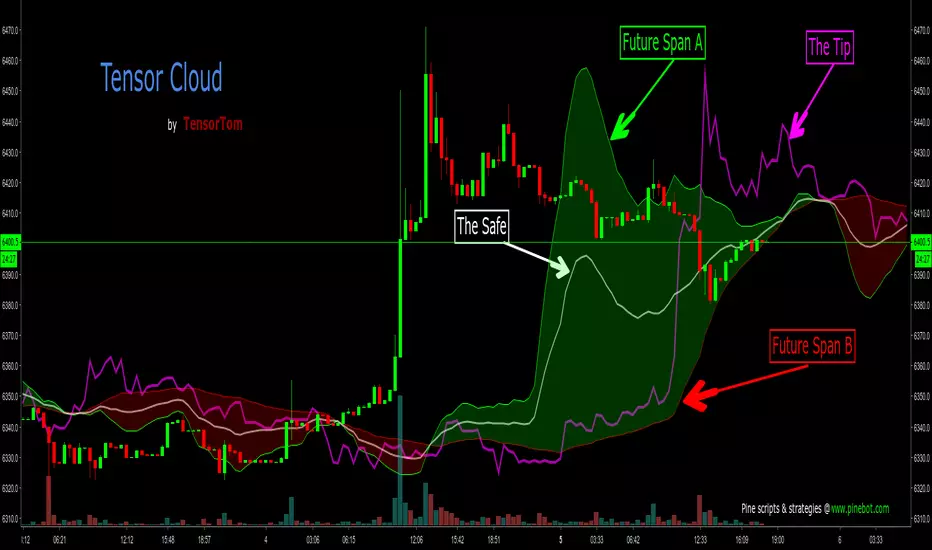
Tensor CloudIntroducing the Tensor Cloud. This is probably the best indicator I've come up with so far. I'm really proud of it. Ichimoku is a brilliant system. It's been around for over half a century and I praise Goichi Hosoda for his brilliant work. However, it's time for something new. I love math and this indicator really showcases that. The Tensor Cloud is an indicator of its own. It is not related to Ichimoku at all. The only thing they have in common is that they both form clouds. The maths in Tensor Cloud are 100% apart.
The Tensor Cloud is mostly comprised of some special forms of linear regression. Let's do a rundown.
Future Span A (Green)
This is one predictor using a linear regression technique. Future Span A is one of the two lines that makes up a Tensor Cloud. From here on out it will traditionally be colored green. It can be used as both a predictor on its own and comprising the Tensor Cloud. This can also be viewed as sort of a long signal when crossing up Future Span B. This line can also be used to help identify levels of support and resistance.
Future Span B (Red)
This is another form of linear regression meant specifically to work alongside Future Span A. This is the second line that comprises a Tensor Cloud. From here on out it will traditionally be colored red. It can be used both as a predictor on its own and comprising the Tensor Cloud. This can also be viewed as sort of a short signal when crossing down through Future Span A. This line can also be used to help identify levels of support and resistance.
Safe (White)
The Safe is a moving average taken of Future Span A and Future Span B. It is highly predictive. From here on out it will traditionally be colored white.
Tip (Fuchsia)
This is yet another form of regression and is highly predictive. The Tip can also be used to help judge trend strength and probability of reversal. More study is of course needed. More on that later in this description. From here on out it will traditionally be colored fuchsia. This line can also be used to help identify levels of support and resistance.
The Tensor Cloud
The space between Future Span A and Future Span B is shaded in green or red, depending on which Future Span is on top. If Future Span A is on top, the Tensor Cloud will be green. This is considered a long signal. If Future Span B is on top, the Tensor Cloud will be colored red. This is a short signal. Attention should also be given to other factors such as:
The position of price in relation to the Tensor Cloud (Under, inside or above).
The position of Tip in relation to the Tensor Cloud.
Crosses of Future Span A and Future Span B.
Tensor Twist
Whenever Future Span A and Future Span B cross (In either direction), this is called a Tensor Twist. If Future Span A is crossing up, this is a long Tensor Twist. If Future Span B is crossing up, this is a short Tensor Twist.
Closing Summary
Much study needs to be done. This is a brand new technique. It's up to all of you to help figure out the best ways to use it. I may still add other components to this indicator but it's pretty solid as is. You will notice that the two integer inputs are set to 27. Twenty-seven is a very important number in mathematics. The details of that are beyond the scope of this description but from here on out, the traditional setting for those will be 27. You will notice that I am not yet releasing the source code to this indicator. For now, it will remain protected. Once I have enough feedback and we're all happy with the final result, I will release the code for the world to have. I have no wish of keeping this closed-source (As profitable as that might be). I just want it to help as many people as possible.
Please share this on social media so we can attract as many testers to give feedback as possible. For publishing this for free, that's all I ask in return. That way it will be as solid as possible when I release the source code.
Enjoy!
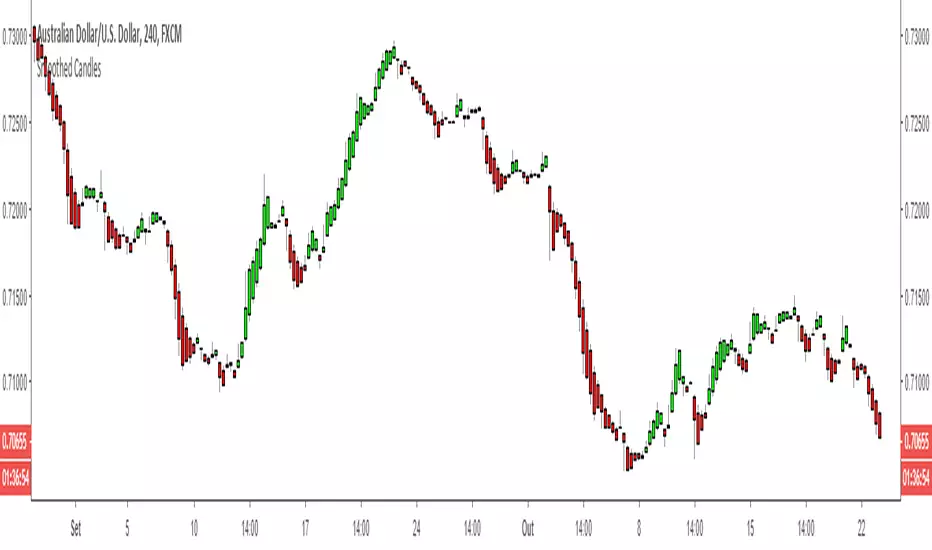
Smoothed CandlesIt is a graphical indicator used to identify trends and pullbacks. Through it, it is possible to eliminate the noises and clearly see the smoothed pattern.
How should I use it ? This is just a example to be used with this indicator.
Let's assume that we are looking for sell opportunities.
step 1: identify some (at least 3) positives (green) candles with a good volume, excluding consolidation regions.
step 2: wait for negative (red) candles with a good volume and also all previous candles must be by majority green.
step 3: wait for pullback with high volume or consolidation region to close the position.
FX:AUDUSD
The example can be better described in the image below:
FX:EURUSD
Another example os use, displayed in the image below:
FX:EURJPY
Look how makes it easy to identify tops and bottoms.
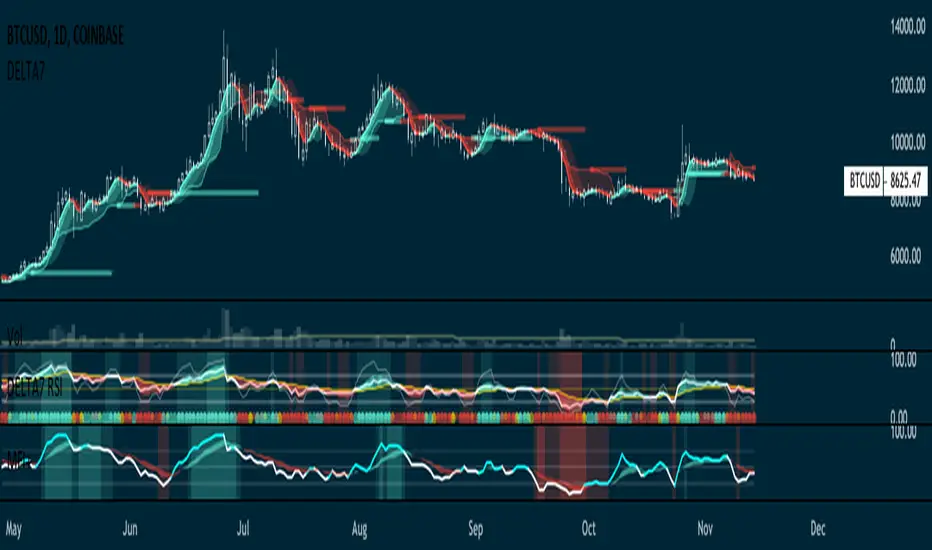
BITFINEX:BTCUSD
Very easy to indetify trends:
OANDA:GBPUSD
Very easy to indetify pullbacks:
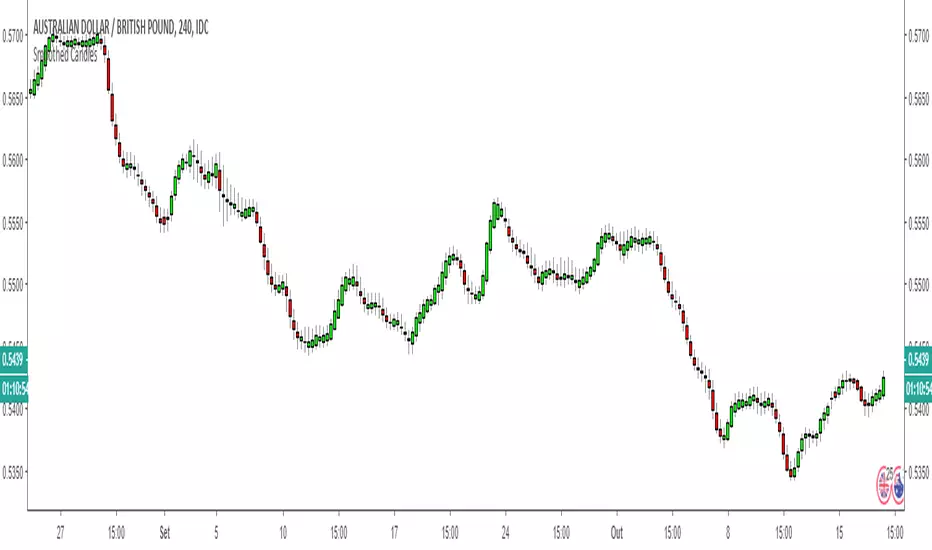
FX_IDC:AUDGBP
It can be used with almost of pairs!
You can buy the script here:
502a96d9.ngrok.io
Smoothed CandlesIt is a graphical indicator used to identify trends and pullbacks. Through it, it is possible to eliminate the noises and clearly see the smoothed pattern.
How should I use it ? This is just a example to be used with this indicator.
Let's assume that we are looking for sell opportunities.
step 1: identify some (at least 3) positives (green) candles with a good volume, excluding consolidation regions.
step 2: wait for negative (red) candles with a good volume and also all previous candles must be by majority green.
step 3: wait for pullback with high volume or consolidation region to close the position.
FX:AUDUSD
The example can be better described in the image below:
FX:EURUSD
Another example os use, displayed in the image below:
FX:EURJPY
Look how makes it easy to identify tops and bottoms.
BITFINEX:BTCUSD
Very easy to indetify trends:
OANDA:GBPUSD
Very easy to indetify pullbacks:
FX_IDC:AUDGBP
It can be used with almost of pairs!
If you are interested in purchase, access the link below:
2450ca2f.ngrok.io
CMF+CMF+ is a CMF study enhanced with a linear regression moving average.
Default Settings:
CMF: 13
Linear Regression of CMF: 34
Activate Vertical Bar Highlights and/or Signal Flags for:
- CMF Oversold/Overbought. (Default: Highlight Bar)
- CMF Extended Oversold/Overbought. (Default: Highlight Bar)
- CMF crossing its Linear Regression . (Default: Signal Flag)
Users can also do extra tuning in Style Section of Format options.
To use this indicator we need to observe the market's behaviour and identify which settings are fit for the timeframe and type market you trading.
Recommended suggested settings
CMF: 13/14
Linear Regression of CMF: 34/21
The market behaves differently when the pacing changes, volatility change and, when it trends or when it ranges. Develop an understanding of it with the help of this study.
Avoid risking more than 1% per trade. Be responsible for always making a priority about protecting capital and managing risk.

MFI+MFI+ is a MFI study enhanced with a linear regression moving average.
Default Settings:
MFI: 13
Linear Regression of MFI: 34
Activate Vertical Bar Highlights and/or Signal Flags for:
- MFI Oversold/Overbought. (Default: Highlight Bar)
- MFI Extended Oversold/Overbought. (Default: Highlight Bar)
- MFI crossing its Linear Regression. (Default: Signal Flag)
Users can also do extra tuning in Style Section of Format options.
To user this indicator we need to observe the market's behaviour and identify which settings are fit for the timeframe and type market you trading.
Recommended suggested settings
RSI: 13/14
Linear Regression of RSI: 34/21
The market behaves differently when the pacing changes, volatility change and, when it trends or when it ranges. Develop an understanding of it with the help of this study.
Avoid risking more than 1% per trade. Be responsible for always making a priority about protecting capital and managing risk.
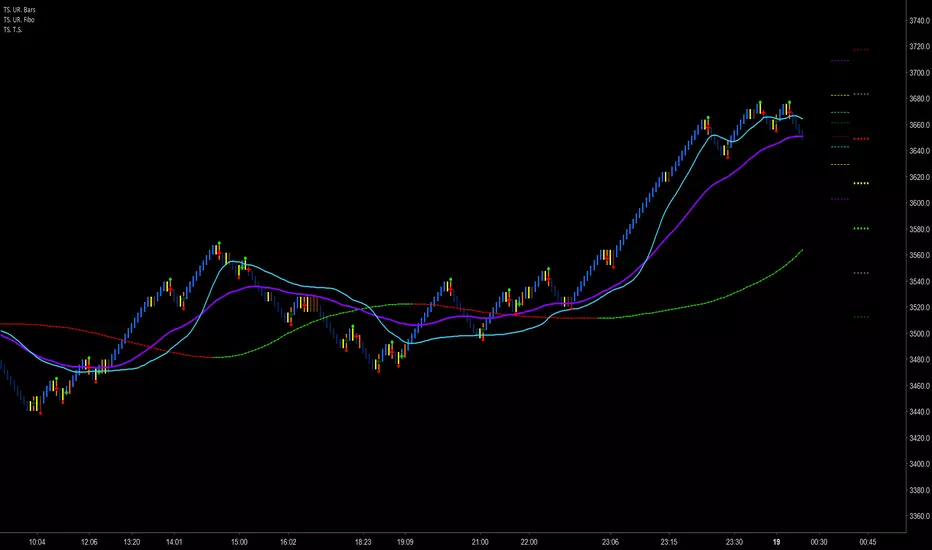
B3 Least Squares Regression - "Price Leading MovAvg"B3 Least Squares Regression or "LSR" is very similar to the mid-line at the end of a linear regression channel, except that in a linear regression you cannot see the history of the regression well. There is also the linear regression and least squares curves in some platforms, and this would also be a similar indicator. The smoothness of my indicator and the back-to-basics approach to the mathematics sets it apart from the others. The look of this MA on a chart speaks for itself.
Some people like the flow of this indicator, as it will actually shoot out ahead of price. Most moving averages trail the price action; this one doesn't do that for long before it catches price or begins to lead price. It isn't necessarily a future price predictor; think of it as a slope stylist. The slope of this indicator determines all painting and signals for the strategy. There are two available versions: with or without order placement.

Chande Kroll R-Squared IndexChande Kroll R-Squared Index script.
This indicator was originally developed by Tushar S. Chande and Stanley Kroll (see their book `The New Technical Trader`, Chapter 2: `Linear Regression Analysis`).
