[HLTTM] Hiubris Long-Term Trend MeterThis is a FREE script meant to be used as an auxiliary Indicator to confirm your entries, but it is as good on it's own.
HOW IT WORKS
The indicator consists of 3 different Trend meters, ranked from top to bottom, according to their Trend detection accuracy. The bottom Meter is using 3 different candle lengths in order to enhance it's displayed accuracy.
HOW TO USE
1. When the majority of all three meters turn green, it is a sign the market is heading up.
2. When the majority of all three meters turn red, it is a sign the market is going down.
- The indicator also has the ability to setup Alerts when all three meters turn green or red. This feature is also signaled by the red or green vertical lines.
- It has 2 Trend Length Settings, that you can adjust depending on your trading style
NOTES
We used the best combination of indicators so you can be sure that, no matter what ticker you're trading (Forex, Stocks or Crypto) - when you get a full green, or full red meter, the price is 100% trending in that direction!
- This indicator does NOT Repaint! In fact, none of my published indicators repaint!
Long-term

🔗Blockchain Fundamentals - PUELL MULTIPLE! by Cryptorhythms🔗Blockchain Fundamentals - PUELL MULTIPLE! by Cryptorhythms
Intro
The PUELL MULTIPLE! is a way to gauge market cycles from a mining profitability / compulsory sellers' perspective. It takes total miner revenue and adjusts by its yearly moving average. Calculation = mining revenue / 365-day simple moving average of mining revenue.
(The indicator is written that way in all caps at the request of its Creator David Puell)
Still over half a dozen blockchain based indicators to come (follow me and dont miss them!)
IS THE BOTTOM IN ?
The PUELL MULTIPLE! seems to suggest it is. With an insanely accurate call history this is a long term bitcoin maximalists dream indicator. You're welcome!
Extras
As usual we took care of you with some selectable options for the MA type and length so you can experiment.
Want more information?
For a better write up that I could do, check out this thread here: medium.com
👍 Enjoying this indicator or find it useful? Please give me a like and follow! I post crypto analysis, price action strategies and free indicators regularly.
💬 Questions? Comments? Want to get access to an entire suite of proven trading indicators? Come visit us on telegram and chat, or just soak up some knowledge. We make timely posts about the market, news, and strategy everyday. Our community isn't open only to subscribers - everyone is welcome to join.
For Trialers & Chat: t.me


🔮 Mayer Multiple w/ MA Selection by Cryptorhythms🔮 Mayer Multiple w/ MA Selection by Cryptorhythms
Description
Introduced by Trace Mayer as a way to gauge the current price of Bitcoin against its long range historical price movements (200 day SMA by default), the Mayer Multiple highlights when Bitcoin is overbought or oversold in the context of longer time frames.
It`s worth noting as the market becomes larger and less volatile, the peaks are becoming less exaggerated. This is because a 200 day moving average baseline is a static yardstick against an ever growing, more stable, Bitcoin market. We should eventually recalibrate what constitutes the overbought/oversold extremes on this chart accordingly.
Additional Features
I added a heatmap based coloring and background highlighting of configurable overbought and oversold zones.
In my testing I observed anecdotal evidence that a value of >1 signaled bull market sentiment and a value of <1 signaled bear sentiment. So I added the dashed line at that value.
I also added secondary zones for experimentation on other timeframes or just plain tinkering.
Lastly I added the ability to substitute the SMA for a few different types of moving averages.
Default Settings
The defaults zones are > 2.4 is overvalued and < 0.5 is undervalued. Default timeframe is daily
Default MA is SMA and default length is 200
Suggested MA length for weekly chart is 28
👍Enjoying this indicator or find it useful? Please give me a like and follow! I post crypto analysis, price action strategies and free indicators regularly.
💬Questions? Comments? Want to get access to an entire suite of proven trading indicators? Come visit us on telegram and chat, or just soak up some knowledge. We make timely posts about the market, news, and strategy everyday. Our community isnt open only to subscribers - everyone is welcome to join.

ElanStrategy v2.0A trend-following strategy with a twist.
I worked on the premise that Bitcoin price swings can not be predicted properly, since it's such a heavily manipulated market. Therefore, I chose to work with following the trend instead of predicting reversals.
It uses a weighted average of short, medium, and long range MA's.
This is the second version (see link below for v1.0), The main difference is that this new version uses a less binary position - it will change the position more gradually.
This one will automatically correct for bar duration, and works well from 1 to 4 hour charts. (1 hour chart seems to have data going back to only 2018/01/01 at the moment of writing, so I recommend using the 2H chart or higher)
Previous version:

Dumb Indicator 9 - Bitfinex Shorts X LongsThis is a way to study how the crypto market is going on Bitfinex, you can see the diference between the Long and Short terms on most popular pairs.

BadaBing IchimokuUses a combination of entry parameters to define a very strict entry criterion
Uses a simple criteria to close trades
Intended for long-term trending trades

UNKNOWN1Designed for BTC only but with proper settings, I believe it can be used for other markets as well, at the end, it is a trend following strategy. Best TF to use - 1H

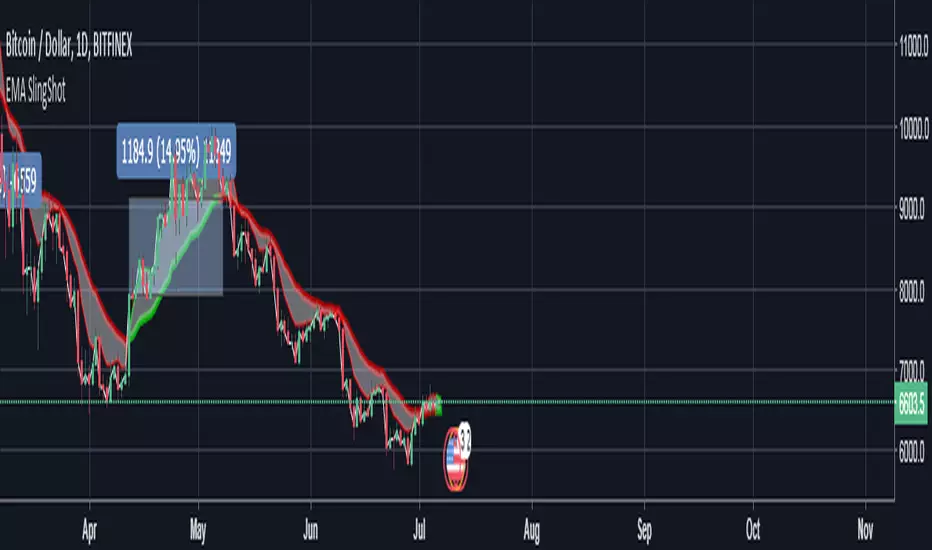
EMA SlingShotUsing ema for close and high, provides optimal entry and exit point. Work best for 1 day period.
ElanStrategy v1.0A trend-following strategy with a twist.
I worked on the premise that Bitcoin price swings can not be predicted properly, since it's such a heavily manipulated market. Therefore, I chose to work with following the trend instead of predicting reversals.
The basis of this strategy is a fairly simple medium-term MA-crossover, but it adds nuance using a long-term MA for deciding on the size of the position.
LONG TERM INVESTMENT TECHNICAL STRATEGY SCRIPT200 - WEEKLY MOVING AVERAGE
GREEN LINE IS 200 WEEKS MOVING AVERAGE OF CLOSE
BLUE LINE IS 200 WEEKS MOVING AVERAGE OF LOW MULTIPLIED BY 0.90
RED LINE IS 100 WEEKS MOVING AVERAGE OF CLOSE
CONDITION: GREEN LINE SHOULD BE ABOVE RED LINE AND PRICE SHOULD BE ABOVE GREEN LINE
BUY ONCE THE PRICE IS ABOVE GREEN LINE AND FULFILLS THE CONDITION.
TARGET 1 FOR TIME FRAME 1 YEAR= 2 X GREEN LINE VALUE WHEN PRICE CROSSED IT
TARGET 2 FOR TIME FRAME 3 YEARS= 3 X GREEN LINE VALUE WHEN PRICE CROSSED IT
TARGET 3 FOR TIME FRAME 5 YEARS= 5 X GREEN LINE VALUE WHEN PRICE CROSSED IT
TARGET 4 FOR TIME FRAME 10 YEARS= 10 X GREEN LINE VALUE WHEN PRICE CROSSED IT
STOP LOSS IS TRAILING TO BLUE LINE

Revistochmanic StrategyRevistochmanic Wave is a stock tracking trends indicator & strategy for medium & long term investing.
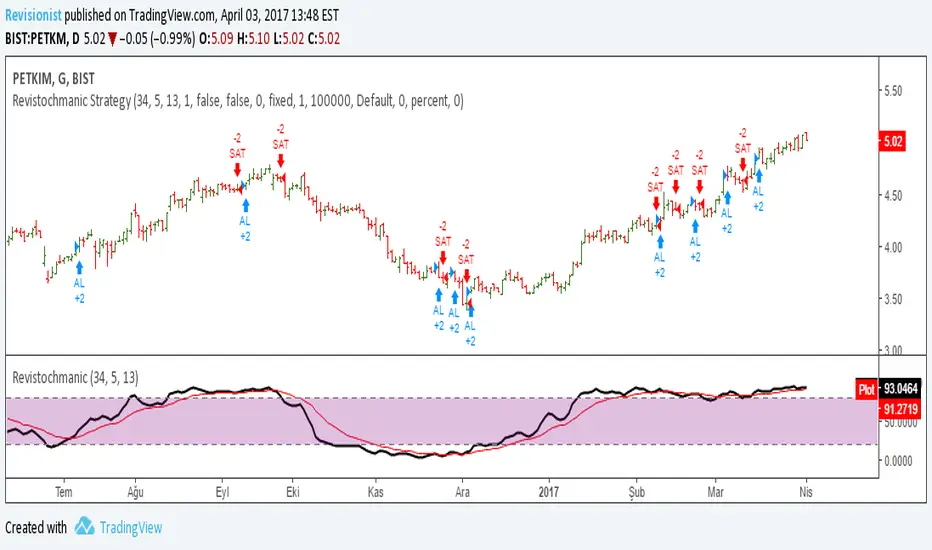
Revistochmanic Wave İndicator Revistochmanic Wave is a stock tracking trends indicator & strategy for medium & long term investing.
Stochastic 34 period
smoothK 5 period (ema/red line)
smoothD 13 period (stochastic/black line)

Simple RSI-MA Algo Beats DOW By Huge Margin Over Past 100 Years!This simple RSI-MA long/short algorithm beats the Dow by a FREAKING HUGE margin over the past century (excluding dividends and trading costs).
The algorithm uses a fast SMA of the RSI as a buy/cover signal and a slow SMA of the RSI as a sell/short signal.
Backtest period = 09/17/1916 - 11/02/2015
Dow = 98 --> 17,830 = +18,094% = 5.38% CAGR
Algorithm = net profit + open P/L = +43,349% = 6.31% CAGR
Notice how the algorithm dodged both the 30s' Great Depression and the 2008 Crisis. Pretty cool huh? :)
ALGORITHM'S FORMULA (use weekly chart):
Buy/Cover = MA10(RSI10) cross> 50
Sell/Short = MA50(RSI10) cross< 50
STRATEGY TESTER'S SETTINGS:
- Initial cash = $10,000
- Pyramiding disabled
- Re-investment enabled (order size = 100% of equity )
- Trade re-calculations disabled
DISCLAIMER: None of my ideas and posts are investment advice. Past performance is not an indication of future results. This strategy was constructed with the benefit of hindsight and its future performance cannot be guaranteed.
