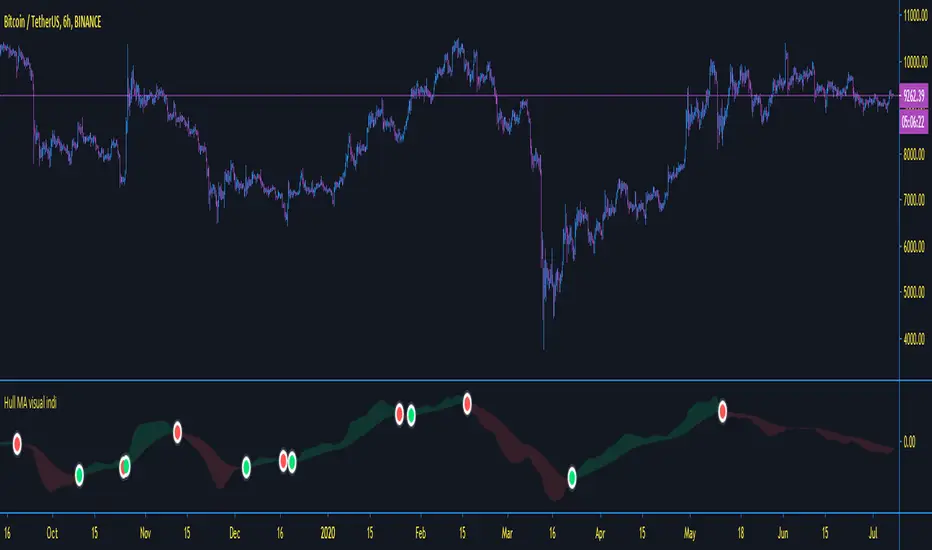
Moving Average Indicator - TradingSargentThis indicator is based on Hull Moving averages, and works best for signals on the 6 hour and above timeframe with standard settings - as always, fully adjustable from settings...
simple to use as another confirmation on your strategies -
Green = buy
red = sell
DM for access rules
LONG
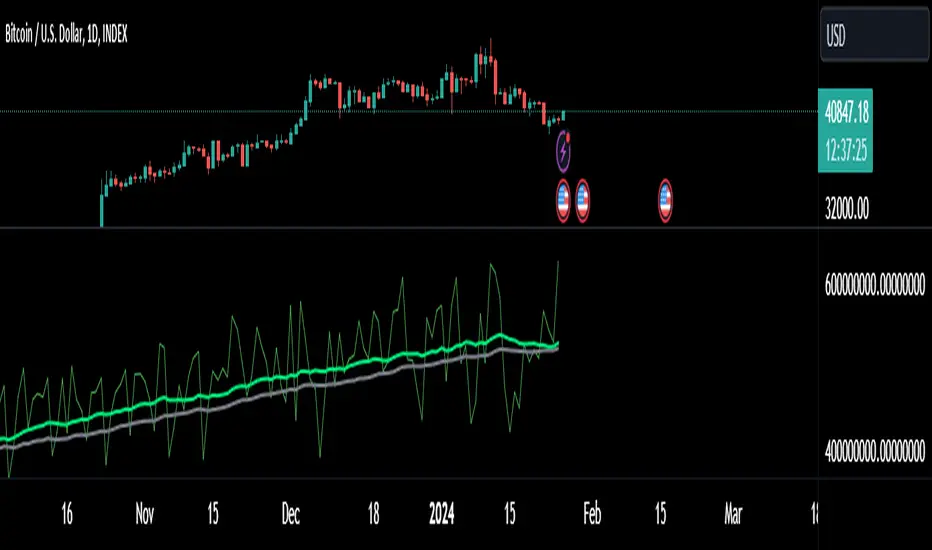
Bitcoin1% : High Leverage Indicator______________________________________________________________________________________________________________________
NOTE: Bitcoin1% is designed to work EXCLUSIVELY on BYBIT BTCUSD PERPETUAL CONTRACT chart on 1min TimeFrame on regular Candles
______________________________________________________________________________________________________________________
Bitcoin1% is a specialised indicator suite designed to catch 1% Bitcoin moves in either direction for High Leverage Trading.
Example: At 10x leverage catching 1% Bitcoin move will yield 10% profit
__________________________________________________________
Mechanism Of Action:
1. Identify trend: The script observers multiple parameters on higher timeframes to identify general trend & strength.
2. Take position: Once the trend is identified the script intends to take high probability positions for a 1% move in the direction of the trend. Currently there are 21 conditions that use bespoke datasets, along with conventional datasets like RSI , MA, VWAP to filter & identify high probability entries.
3. Take profits: There are total 4 conditions for exits. Partial Exit & Total Exit for both Longs & Shorts. Although we recommend you book profit at 1% change in price of BTCUSD these 4 conditions will offer high volatility exits along the way, should you choose to hold for longer.
4. Evolving: We learn from mistakes when they happen, bad trades are dissected & studied. New conditions get added & bad trades get filtered out through updates. This keeps the script in sync with the market.
__________________________________________________________
Insight: The script performs best in trending markets, so it avoids trading structureless or sideways movement & expects reasonable judgement on the user's part to avoid trading unusual & directionless market conditions.
Trading Mindset: When Bitcoin1% indicates a long trade, it basically says "BTC is more likely to move up 1% than go down 1% form here" : The script only indicates direction of the next 1% which is all you need for High Leverage Trading. You can set target & stop at 1% & try different variations with experience.
Have Questions? Feel free to PM me on TradingView

[astropark] Volume that mattersDear Followers,
does volume say something about market makers and what will happen in near future?
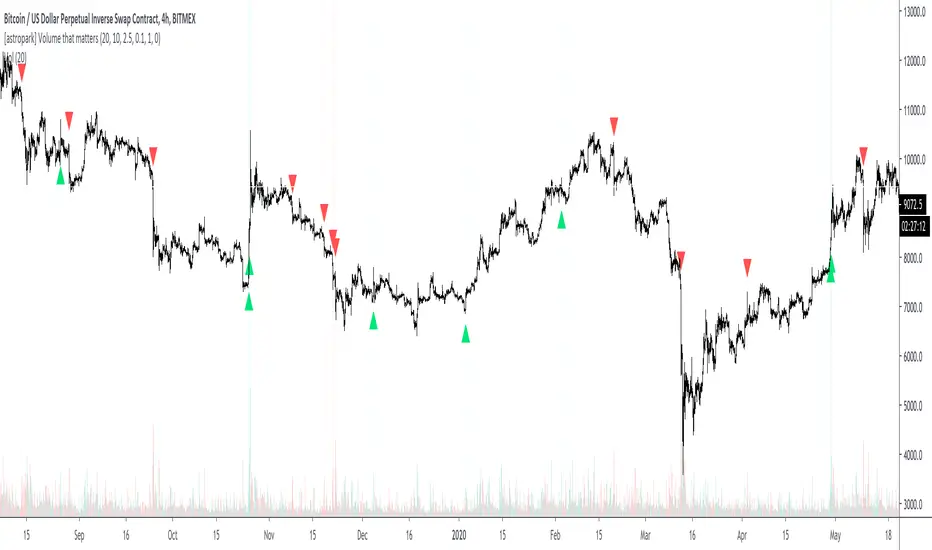
Today a new Price Action Tool , the "Volume that matters" indicator.
When a Market Maker executes his/her orders, there is no way he/she can do it without giving us some footprints: volume!
Specific Volume spikes happen as
reactions at support or resistance range , as well as at supply and demand zones
market makers' actions
trend switching in short-term and mid-term future
They can be both bullish or bearish , but the real problem is that not all, but only a few volume candle matters ! And this tool will filter them for you.
This indicator works
on every timeframe (eg. 15m, 30m, 1h, 2h, 4h, 6h, 1D, ...), the higher, the better!
on cryptocurrencies (eg. XBTUSD, ETHUSD, ETHBTC, both USDT and BTC markets, ...)
on forex (eg. EURUSD, GPBUSD, JPYUSD, ...)
on stocks (eg. AMZN, FB, TSLA, GOOG, NFLX, ...)
on commodities (eg. GOLD, SILVER, OIL, ...)
This indicator has following options:
edit volume filter and period analysis
edit filter based on fixed or percentage volatility change
edit filter based on candle value size
show a suggestion of possible entries and stoploss
You can enhance your trading by using it together with my "Engulfing that matters", my "Pinbar that matters" and my "Breaker Blocks (BB) and Supply/Demand Order Blocks (OB)" indicators, so you can easily spot confluences and have more confidence in trades.
Here my Engulfing that matters indicator
Here my Pinbar that matters indicator
Here my Breaker Blocks (BB) and Supply/Demand Order Blocks (OB) indicator
Here below some examples on how to use the indicator.
BTCUSDT 1D
ETHUSD 4h
LINKBTC 1h
EURUSD 4h
AMZN 1h
XAUUSD 4h
Here below an example of suggested entries and stoploss
This is a premium indicator , so send me a private message in order to get access to this script .
MACD Trend [VK]This strategy shows the trend using MACD
Use higher TF for better view
Combine MTF -RSI for entry points and use both indicators together to better understand the trend
THANK YOU

[astropark] Pinbar that mattersDear Followers,
today a new Price Action Tool , the "Pinbar that matters" , also known as Hammer (bullish case) and Inverted Hammer (bearish case).
Everybody knows the importance of pinbar to highlight
reaction at support or resistance range , as well as at supply and demand zones
market makers' actions
trend switching in short-term and mid-term future
They can be both bullish or bearish , but the real problem is that not all, but only a few pinbar matters ! And this tool will filter them for you.
This indicator works
on every timeframe (eg. 5m, 15m, 30m, 1h, 2h, 4h, 6h, 1D, ...)
on cryptocurrencies (eg. XBTUSD, ETHUSD, ETHBTC, both USDT and BTC markets, ...)
on forex (eg. EURUSD, GPBUSD, JPYUSD, ...)
on stocks (eg. AMZN, FB, TSLA, GOOG, NFLX, ...)
on commodities (eg. GOLD, SILVER, OIL, ...)
This indicator has following options:
edit filter based on fixed or percentage volatility change
edit filter based on candle value size
show a suggestion of possible entries and stoploss
Be sure to edit both fixed and percentage volatility options in order to have a correct filter on your chart and timeframe.
You can enhance your trading by using it together with my "Engulfing that matters" and my "Breaker Blocks (BB) and Supply/Demand Order Blocks (OB)" indicators, so you can easily spot important points where to start a short or a long trade.
Here my Engulfing that matters indicator
Here my Breaker Blocks (BB) and Supply/Demand Order Blocks (OB) indicator
Here below some examples on how to use the indicator.
XBTUSD 5m
ETHUSD 15m
BNBBTC 1h
ETHBTC 12h
EURUSD 1h
JPYUSD 4h
AMZN 5m
FB 4h
XAUUSD 15m
Copper Futures 1h
Here below an example of suggested entries and stoploss
This is a premium indicator , so send me a private message in order to get access to this script .

[astropark] VWAP Crosses [alarms]Dear Followers,
today a new Swing and Scalping Strategy based on WVAP , mainly designed for Bitcoin and High-Cap Cryptocurrencies, like Ethereum. It works also on Forex and Stocks.
It works great since 15m and above till 1D. I suggest you to use it on 15m, 30m or 1h timeframes .
VWAP or "Volume Weighted Average Price" is a volume-based indicator similar to a moving average.
This trading indicator is used to identify market resistance and support levels and is represented as a weighted average price for the treaded volumes.
My strategy will help you identify main support-resistance level to be careful of and it will trigger a buy or a sell depending on how price will intereact with vwaps.
green means we are in a bullish trend, in fact it start with a "buy" signal
red means we are in a bearish trend, in fact it start with a "sell" signal
blue means we are in a moment where trend may change, so be careful and always remember that taking profits is awesome and have a stoploss is a must in trading
The user who wants to use this strategy, especially via an automated bot, must always set a stoploss (example 150$ from entry on bitcoin) or use a proper risk management strategy .
This is not the "Holy Grail", so use it with caution. It's highly suggested to use a proper money management .
This script will let you set all notifications you may need in order to be alerted on each triggered signals.
The one for backtesting purpose can be found here below:
This is a premium indicator , so send me a private message in order to get access to this script.

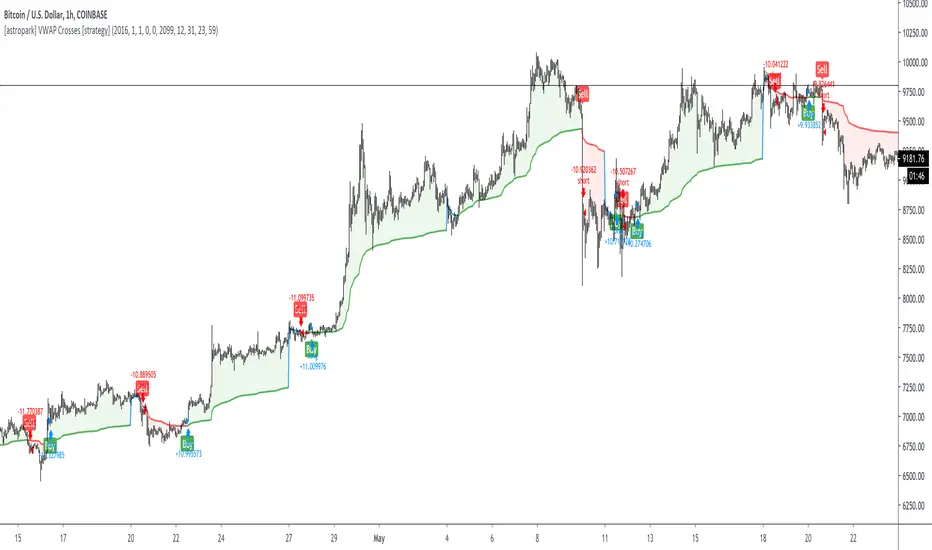
[astropark] VWAP Crosses [strategy]Dear Followers,
today a new Swing and Scalping Strategy based on WVAP , mainly designed for Bitcoin and High-Cap Cryptocurrencies, like Ethereum. It works also on Forex and Stocks.
It works great since 15m and above till 1D. I suggest you to use it on 15m, 30m or 1h timeframes .
VWAP or "Volume Weighted Average Price" is a volume-based indicator similar to a moving average.
This trading indicator is used to identify market resistance and support levels and is represented as a weighted average price for the treaded volumes.
My strategy will help you identify main support-resistance level to be careful of and it will trigger a buy or a sell depending on how price will intereact with vwaps.
green means we are in a bullish trend, in fact it start with a "buy" signal
red means we are in a bearish trend, in fact it start with a "sell" signal
blue means we are in a moment where trend may change, so be careful and always remember that taking profits is awesome and have a stoploss is a must in trading
The user who wants to use this strategy, especially via an automated bot, must always set a stoploss (example 150$ from entry on bitcoin) or use a proper risk management strategy .
This is not the "Holy Grail", so use it with caution. It's highly suggested to use a proper money management .
This script will let you backtest this script and check profitability on your preferred market.
The alarms version of this indicator, which will let you set all notifications you may need in order to be alerted on each triggered signals, can be found by searching for astropark "VWAP Crosses"
This is a premium indicator , so send me a private message in order to get access to this script.
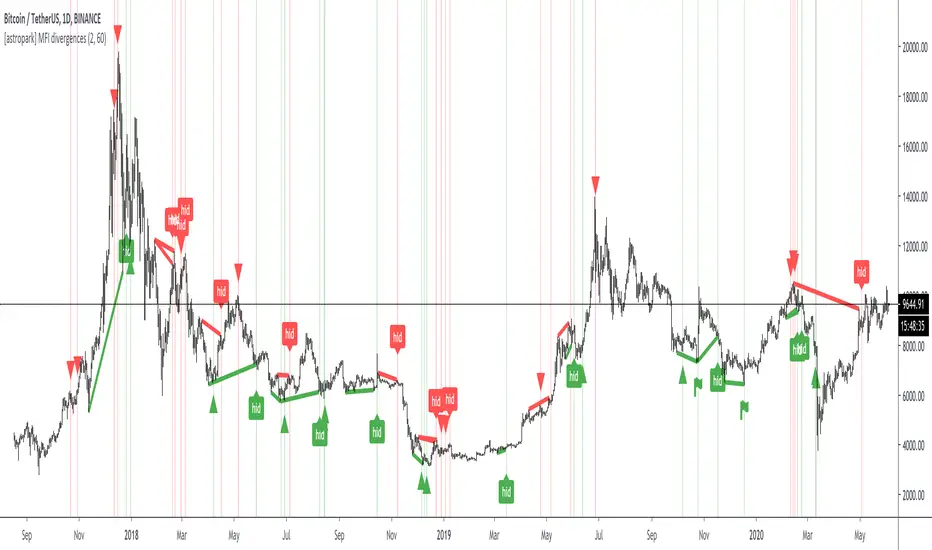
[astropark] MFI divergencesDear Followers,
today a new great Scalper Tool , based on a custom version of Money Flow (MFI) oscillator, which works on both Candlesticks, Heiking Ashi and Renko charts , from 1 second Renko chart and above (on non Renko charts, the higher, the better of course!), both on FOREX, Cryptocurrencies, Stocks and Commodities!
This tool has some cool features:
it works on all timeframes , on both Renko, Heikin Ashi and Candlesticks chart
it shows you both bullish and bearish divergences with a triangle up or down respectively
when it finds a strong bullish/bearish divergence , a flag will be displayed instead of a triangle
it shows you both hidden bullish and bearish divergences with a label "hid"
This script will let you set all notifications you may need in order to be alerted on each triggered divergence.
You may like to use it together with my Renko OBV Divergences indicator (which works on Candlesticks and Heiking Ashi too)
and my Renko RSI Divergences indicator (which works on Candlesticks and Heiking Ashi too)
On Bitmex/ByBit/Binance Bitcoin/USD chart best Renko settings is Traditional Renko chart with 11$ box size, while 0.5$ box size is suggested on Ethereum/USD pair.
This is a premium indicator , so send me a private message in order to get access to this script.
[astropark] Fair Value GapsDear Followers,
today a new epic tool, the "Fair Value Gap (FVG) Finder" .
Fair Value Gaps are quite important to trade, as they represent both volume and trading unfilled gaps, which most of the time are filled and then price reverse .
This indicator will let you set alerts on when a new FVG is found and when it is filled.
Traded together with Breaker Blocks (BB) and Supply/Demand Order Blocks (OB) , you can easily spot important points where to start a short or a long trade.
Here my Breaker Blocks (BB) and Supply/Demand Order Blocks (OB) indicator
Here below some examples on how to use the indicator.
On Bitcoin
On EURUSD


TSI CCI Hull with profit$$$This is a modified version of @SeaSide420 TSI CCI Hull with profits exit on long and short order
ORIGINAL SCRIPT:
/// /// feel free to edit/improve and comment

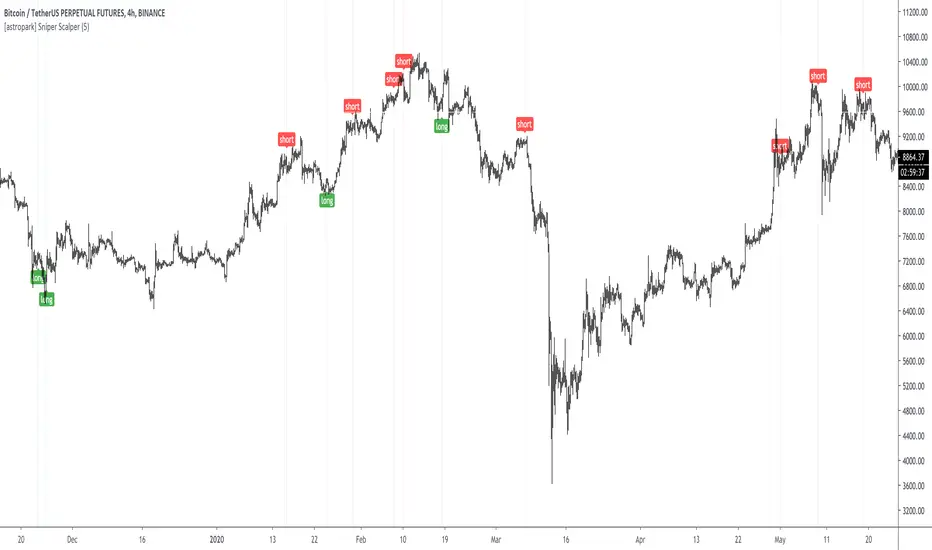
[astropark] Sniper ScalperDear Followers,
today a new Scalper Tool , which works great on all timeframes , from 1 minute to 1 month!
Keep in mind that this is a Scalper, so it's always a good idea to take or lock your profits, despite you may use it also for swing trading.
This tool has some cool features:
it works on all timeframes , from 1 minute to 1 month!
you can change a filter option from 1 (lowest) to 7 (highest)
Here some examples on how it performs on many timeframes and charts.
EURUSD 15m chart
AMZN 1h chart
Bitmex XBTUSD 4h chart
Bitfinex ETHUSD 1h chart
Binance Chainlink LINKBTC 1h chart
Binance Ethereum ETHBTC 1h chart
GOLD XAUUSD 15m chart
The user who wants to use this strategy, especially via an automated bot, must always manage to set a take profit and stoploss, as well as use a proper money and risk management strategies .
This is not the "Holy Grail", so use it with caution.
This is a premium indicator , so send me a private message in order to get access to this script.
Systematic Momentum strategy v 1.0Systematic Momentum strategy v 1.0
This is a long-only strategy optimized taking into consideration the underlying's momentum and volatily.
Long story short it opens positions when the momentum is highest and the risk is lowest and closes the same position when the risk-to-reward is no longer optimal.
How to use:
-> To be used on an Index or a tracker ETF
-> Position sizing should be set up to 100% of the portfolio

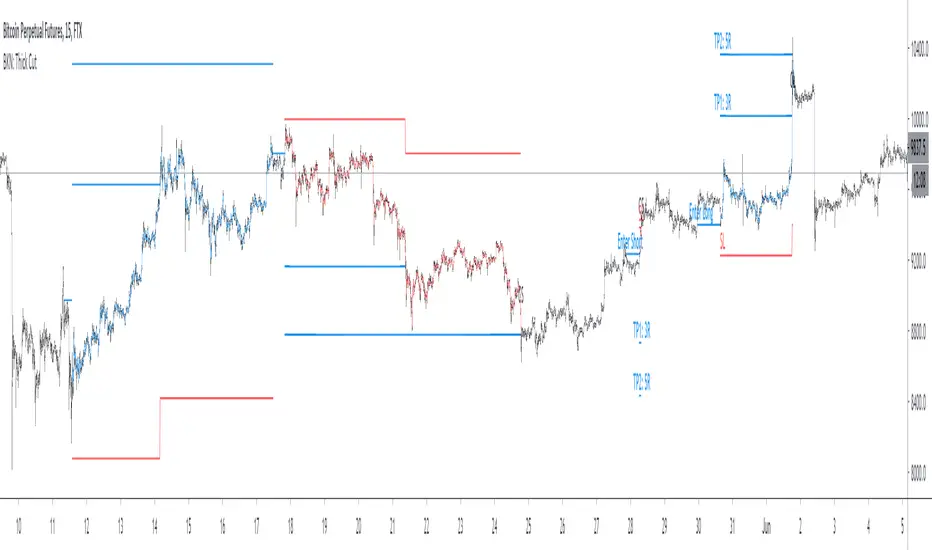
BKN: Thick CutThick Cut is the juiciest BKN yet. This indicator is created to take a profitable trading strategy and turn it into an automated system. We've built in several pieces that professional traders use every day and turned it into an algo that produces on timeframes as low as 1, 3, and 5 minutes!
Limit Order Entries: When criteria is met, an alert is signaled that will send a value to enter a position at a limit price.
Built in Stop Loss: A stop is built in and the value can be sent to your bot using the {{plot}} function or you can rely on a TradingView alert when the stop is hit.
Built in Take Profits: We've built in two separate take profits and the ability to move your stop loss to breakeven after the first take profit is hit. Even if you take 50% profit at 1R and move your stop loss, you already have a profitable trade. Test results show 50% profits at 2R and the remainder at higher returns result in exceptional results.
Position Sizing: We've built in a position size based on your own predetermined risk. Want to risk $100 per trade? Great, put in 100 in the inputs and reference a quantity of {{plot("Position Size")}} in your alert to send a position size to the bot. You can also reference {{plot("Partial Close")}} to pull 50% of the position size closing 50% at TP1 and 50% at TP2.
Backtest results shown are very short term since we are viewing a 15m chart. This can be a profitable strategy on many timeframes, but lower timeframes will maximize results.
A unique script with incredible results. Further forward testing is live.
***IMPORTANT***
For access, please do not comment below. Comments here will not be replied to. Please send a DM here or on my linked Twitter . At this time, this strategy is considered a Beta release as we continue to fine tune settings and more. Expecting 2 weeks of beta with official release around June 6.
BKN: Thick Cut StrategyThick Cut is the juiciest BKN yet. This indicator is created to take a profitable trading strategy and turn it into an automated system. We've built in several pieces that professional traders use every day and turned it into an algo that produces on timeframes as low as 1, 3, and 5 minutes!
Limit Order Entries: When criteria is met, an alert is signaled that will send a value to enter a position at a limit price.
Built in Stop Loss: A stop is built in and the value can be sent to your bot using the {{plot}} function or you can rely on a TradingView alert when the stop is hit.
Built in Take Profits: We've built in two separate take profits and the ability to move your stop loss to breakeven after the first take profit is hit. Even if you take 50% profit at 1R and move your stop loss, you already have a profitable trade. Test results show 50% profits at 2R and the remainder at higher returns result in exceptional results.
Position Sizing: We've built in a position size based on your own predetermined risk. Want to risk $100 per trade? Great, put in 100 in the inputs and reference a quantity of {{plot("Position Size")}} in your alert to send a position size to the bot. You can also reference {{plot("Partial Close")}} to pull 50% of the position size closing 50% at TP1 and 50% at TP2.
Backtest results shown are very short term since we are viewing a 15m chart. This can be a profitable strategy on many timeframes, but lower timeframes will maximize results.
A unique script with incredible results. Further forward testing is live.
***IMPORTANT***
For access, please do not comment below. Comments here will not be replied to. Please send a DM here or on my linked Twitter. At this time, this strategy is considered a Beta release as we continue to fine tune settings and more. Expecting 2 weeks of beta with official release around June 6.

ATR Stop Loss LONG/SHORT by melihgulerYou can monitor the stop loss level according to ATR in 2 ways (Long/Short).

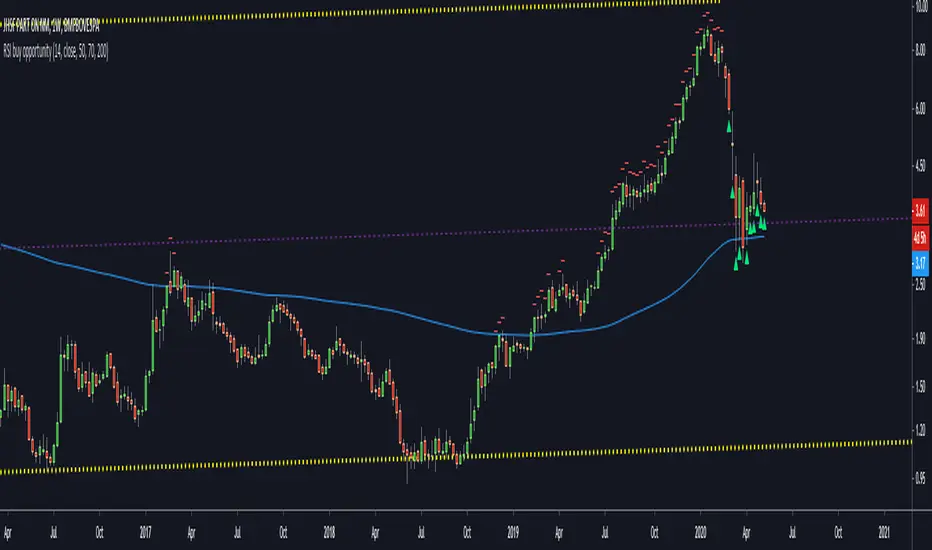
RSI buy opportunityRSI buy opportunity is an indicator to look for the best entries on weekly charts.
It depends on each stock and the values should change to optimize the entry.
Buy when green triangle shows up.
Never buy when red signal appears.
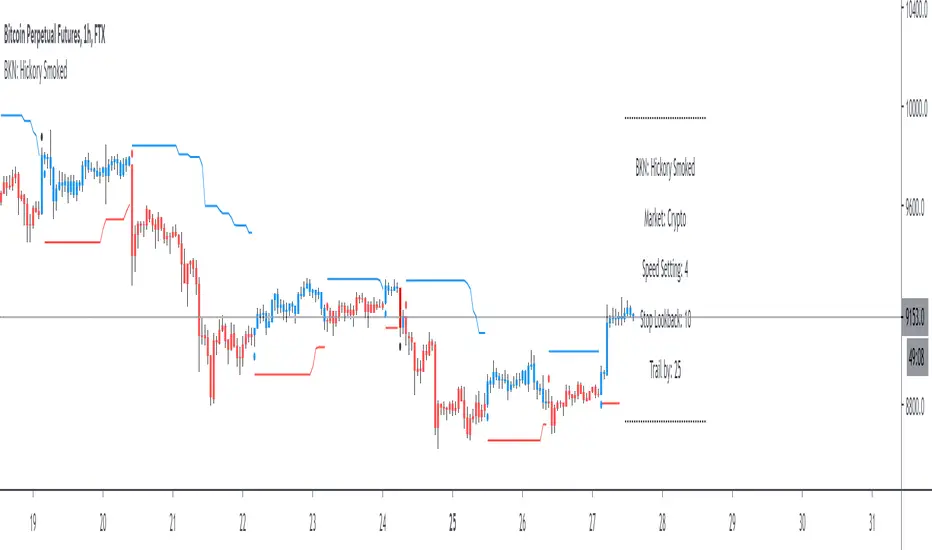
BKN: Hickory SmokedWelcome to the BKN: Hickory Smoked Indicator. This is an algorithmic indicator that thrives in trending environments. We've included settings for crypto and forex and speed options for lower timeframe entries.
The script offers a stop loss or trailing stop loss that will trigger when an entry is triggered. You can also choose to use it as long or short only.
This indicator is automation ready with alerts for both opening and closing positions.
***IMPORTANT***
For access, please do not comment below. Instead, send a DM here on TradingView or on my linked Twitter account.
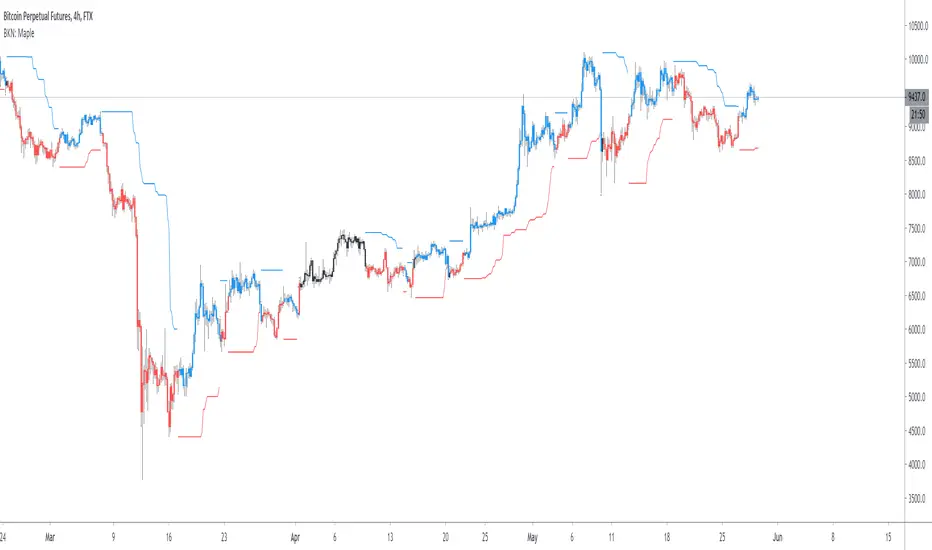
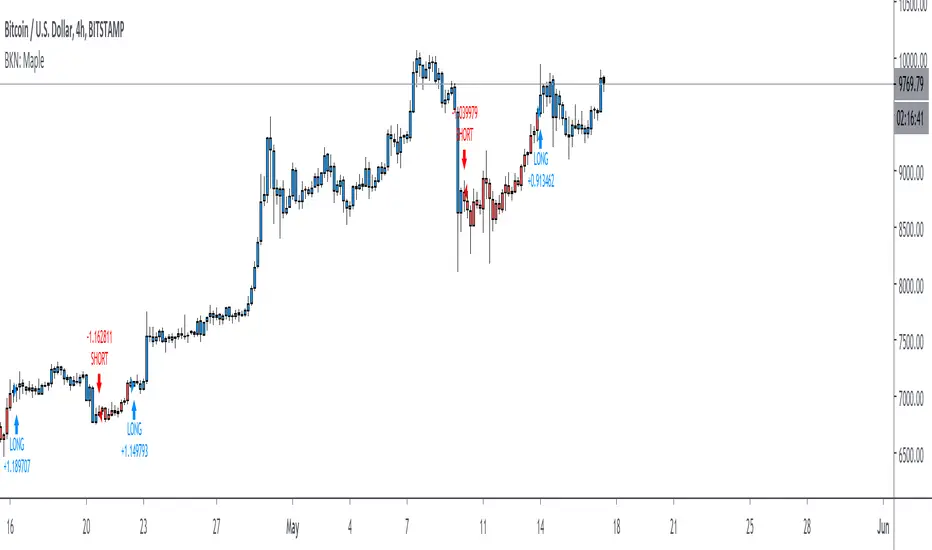
BKN: MapleThis strategy is tied to the BKN: Maple indicator which is an automation ready algo for entering/exiting trades. The script comes prepared with a stop loss and trailing stop loss so that you don't have to host your stop on the exchange and can also optimize trade entries and exits.
We've released optimizations for Forex and Crypto on multiple timeframes, but the script shines on the one and four hour charts.
***IMPORTANT***
For access, please do not comment below. Access requests in the comments will not be responded to.
Instead, please send a DM or reach out to my linked Twitter account.
Kitsune's Long/Short Support v1.0.0After reviewing all feedback and questions I got from the users of my previously published script (Kitsune Indicator Collection), I decided to publish a new one which is easier to interpret and use. Therefore the script is as clean as possible thereby minimizing visual clutter (or at least I tried ).
This script is an evolution of my precious script and is still a combination of the following items:
- High-Low detector
- Parabolic SAR (Stop and Reversal) setups and triggers
- Ehlers Instantaneous Trendline (EIT) indicator
- Range detector
- Support and Resistance detector
- Daily/Weekly/Monthly open visualization
The script uses the SAR and EIT to detect long/short signals.
-----------------------------------------------------------------------------------------------------------------------------------------------
A signal is decided to be STRONG when SAR trigger coincides with trend reversal of the EIT.
A STRONG long signal is painted (i.e. blue label with L+) when:
- SAR long trigger (blue arrow) coincides with an EIT crossover (blue line crosses over the red line).
A STRONG short signal is painted (i.e. red label with S+) when:
- SAR short trigger (red arrow) coincides with an EIT cross-under (blue line crosses under red line).
A STRONG signal will always result in entering (if not in any position) or flipping a long/short position.
-----------------------------------------------------------------------------------------------------------------------------------------------
A signal is decided to be WEAK when not in a long or short position and a SAR trigger appears.
A WEAK long signal is painted (i.e. blue label with L-) when:
- Not in a position (gray bars) and a SAR long trigger (blue arrow) appears but not coinciding with an EIT crossover.
A WEAK short signal is painted (i.e. red label with S-) when:
- Not in a position (gray bars) and a SAR short trigger (red arrow) appears but not coinciding with an EIT cross-under.
A WEAK signal will only result in a long/short position when not in any position.
-----------------------------------------------------------------------------------------------------------------------------------------------
A long/short position is exited on a trend reversal of the EIT.
A short position is exited (i.e. red x-cross) when:
- A crossover of the EIT happens (blue line crosses over the red line).
A long position is exited (i.e. blue x-cross) when:
- A cross-under of the EIT happens (blue line crosses under the red line).
-----------------------------------------------------------------------------------------------------------------------------------------------
Color of the bars are depend on position type:
- Blue = Long position
- Red = Short position
- Gray = No position
-----------------------------------------------------------------------------------------------------------------------------------------------
Enjoy using the script. I hope it is of value to you!
If you have any questions, don't hesitate to contact me.
With kind regards,
Kitsune (L3F03X)

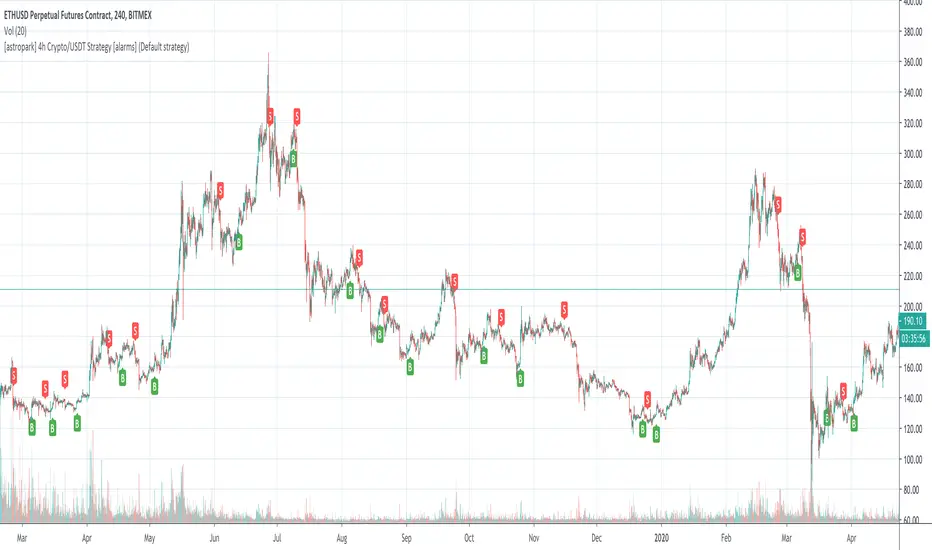
[astropark] 4h Crypto/USDT Strategy [alarms]Dear Followers,
today a new Swing and Scalper Tool , which works great for Cryptocurrencies on the USDT market on 4h timeframe .
This tool has some cool features:
it works on many timeframes, but best one is 4H timeframe : so you can enjoy both manual and bot trading by using a 24/7 running bot;
it comes in three working mode : default, alternative and high frequency ;
auto-stoploss: you can enable an stoploss in trade, bot will follow
It's always suggested to use a proper money and risk management in trades. This is not the "Holy Grail", it does not exist.
Strategy results are calculated from the beginning of 2018 till now, so more than 2 years, using 10000$ as initial capital and working at 1x leverage (no leverage at all!) and 0.1% trading fee already applied.
You can always DM me if you need any help to configure it on your preferred chart or if you want a customization of this bot for a specific pair.
This script will let you set all notification alerts you may need in order to be alerted on each triggered signals.
The one for backtesting purpose can be found by searching for the astropark's "4h Crypto/USDT Strategy" and then choosing the indicator with "strategy" suffix in the name, or you can find here below
This is a premium indicator , so send me a private message in order to get access to this script.
Hash Ribbons Backtest - Bitcoin Beats YT
Hello Hello Hello and welcome back to Bitcoin Beats!
This is a script written by capriole_charles
Go check out the original!
I have added leverage and stoploss % but also made it a strategy so we can look back at past trades to see patterns and profit.
Personally I feel this is not enough data to trade off as BTC is such a young asset. However I have seen other models similar to this for other assets that hold strong.
Trade safe!
Good bye from bitcoin beats!
Not Meant For The 1H! My Bad! higher timeframes are better!
The "Spring" is the confirmed Miner capitulation period:
The 1st "gray" circle is the start of Capitulation (1 month Hash Rate crosses UNDER 2 month Hash Rate)
Last "green" circle is the end of Capitulation (1 month Hash Rate crosses OVER 2 month Hash Rate)
The "greener" the spring gets (up until blue) represents Hash Rate recovery (it is increasing)
The "blue" circle is the first instance of positive momentum following recovery of Hash Rate (1m HR > 2m HR). This is historically a rewarding place to buy with limited downside.