Cerber Strategy ETH/BTC Cerber Strategy: High-Precision Crypto Trend Follower
The Cerber Strategy is a low-frequency, high-conviction trend following system designed to capture massive quarterly crypto moves while
filtering out 90% of consolidation noise. It combines a momentum-based "Sniper Entry" (entering only on verified breakouts) with a
"Trend Confirmation" filter (Weekly DEMA) to ensure capital is only deployed during macro bull runs.
Usage:
* Timeframe: Daily (1D) mandatory.
* Assets: Optimized for BTC and ETH, works on high-volatility alts.
* Style: Position Trading (holding for weeks/months).
* Risk: Extremely high efficiency (high Profit Factor), very low drawdown compared to Buy & Hold. Perfect for a "Set and Forget"
portfolio allocation.
Longsetup

Entry Scanner Conservative Option AKeeping it simple,
Trend,
RSI,
Stoch RSI,
MACD, checked.
Do not have entry where there is noise on selection, look for cluster of same entry signals.
If you can show enough discipline, you will be profitable.
CT

Oscillator Matrix ScreenerOscillator Matrix Screener
Oscillator Matrix Screener is a multi asset, multi timeframe dashboard that lets you quickly compare momentum, money flow, and exhaustion conditions across up to 10 symbols in a single table. It is designed as a visual screener so you can spot strength, weakness, reversals, and confluence at a glance without flipping charts.
Core Logic
For each enabled ticker and timeframe the script calculates:
Money Flow
Uses MFI to estimate buying vs selling pressure relative to volume and price movement.
HyperWave Oscillator
Uses RSI to classify the market into regimes such as Overbought Down, Oversold Up, and intermediate up or down states.
Overflow Oscillator
Uses Stochastic to show how extended price is within its recent range.
Reversal Signals
Detects potential bullish and bearish reversal events using RSI crossovers around key zones.
Strong Reversal Up
Reversal Up
Strong Reversal Down
Reversal Down
Divergence
Flags simple bullish or bearish divergence between price and RSI.
Composite Rating and Confluence
Combines multiple components into a single rating:
Strong Bullish
Bullish
Neutral
Bearish
Strong Bearish
That rating is then translated into a confluence label such as Strong, Weak or Mixed to summarize overall pressure.
Table Layout
All results are displayed in a compact table:
Ticker
Last price
Volume
Percent change from the current daily open
Absolute change from the current daily open
Rating
HyperWave signal text
Money Flow value
Overflow value
HyperWave value
Reversal status
Divergence status
Confluence status
Rows alternate background colors for readability, and key cells use context based coloring. For example:
HyperWave cell background shifts between red and green families depending on overbought or oversold states.
Percent change and change columns are green for positive moves and red for negative moves.
Bullish and bearish conditions use distinct color accents so you can scan quickly.
Filters and Controls
You can tailor what appears in the table with several filters:
Rating Filter
Show only symbols that match a chosen rating band such as Strong Bullish, Any Bullish, Bearish, or Strong Bearish.
Money Flow Filter
Restrict results to Money Flow values above, below, or very close to a chosen level.
Ticker and Timeframe Selection
Enable or disable up to 10 tickers, each with its own timeframe input. Examples of lists could be any of these for example:
Same symbol across multiple timeframes
A watchlist of different symbols on the same timeframe
Mixed layout that matches your personal workflow
Display Settings
Choose table position, text size, background and header colors to fit your chart layout.
How to Use
Add your preferred tickers and timeframes.
Optionally apply rating or money flow filters to focus on only the strongest or weakest setups.
Use the table as a top down scanner to:
Find symbols with strong bullish or bearish confluence.
Spot reversals that align with oversold or overbought zones.
Identify divergence backed by supportive money flow or overflow readings.
Oscillator Matrix Screener is intended as a decision support tool. It does not generate direct buy or sell signals by itself. Always combine it with your own technical knowledge and risk mitigation skills

Indicator setupDescription of the "Setup Indicator"
Setup Indicator is a multifunctional trading tool that combines the power of a modified ATR indicator for trend determination and a classic ZigZag for identifying key market structures. It is designed to automatically detect reversal patterns "LL to HH" (bullish) and "HH to LL" (bearish), project target levels based on Fibonacci retracements, and visualize trading zones.
🎯 Philosophy and Utility
The indicator is built on the concept that significant price movements begin with the breakout of the previous structure (a higher low in an uptrend or a lower high in a downtrend). It helps the trader to:
- Objectively identify reversal points: Automatically detects "Lower Low -> Higher High" (LL->HH) formations for long positions and "Higher High -> Lower Low" (HH->LL) for short positions.
- Determine entry zones: Visualizes a "box" between key Fibonacci levels (38.2% and 60.6%), which serves as a potential area for trade entry.
- Project targets: Calculates and displays three target levels (0.84, 1.306, 1.618 for long and 0.16, -0.306, -0.618 for short) based on the magnitude of the initial impulse.
- Manage risk: Clearly marks the "structure break" level, upon reaching which the initial trading idea is invalidated.
⚙️ Operating Principle and Logic
1. ATR Trend (Base):
- Builds dynamic support and resistance levels based on the Average True Range (ATR) multiplied by a specified coefficient.
- Trend direction is determined by the position of the closing price relative to these levels. This is the main filter for the entire indicator.
2. ZigZag (Structure):
- Leaves only significant extremes (peaks and troughs) on the chart, filtering out market noise. The ZigZag length determines sensitivity.
3. Signal Filtering (The Heart of the System):
- A signal is considered valid only if it is confirmed by the ATR trend.
- For Long (LL to HH): The lower low (LL) must be formed in a downtrend according to the ATR, and the subsequent higher high (HH) — in an uptrend.
- For Short (HH to LL): The higher high (HH) must be formed in an uptrend according to the ATR, and the subsequent lower low (LL) — in a downtrend.
- This dual verification significantly improves signal quality.
🛠️ Indicator Settings
1. "ATR Trend Settings" Group
- ATR Period: Period for calculating the ATR. Smaller values make the trend more sensitive.
- Source: Price source used for calculation (default is hl2 - the average of High and Low).
- ATR Multiplier: Coefficient for expanding/narrowing the ATR bands. The higher the value, the less frequently the trend changes.
- Change ATR Calculation Method: Switches the ATR calculation between the standard method (ta.atr) and the SMA method (ta.sma(ta.tr)).
- Show ATR Support/Resistance Lines: Shows/hides the ATR trend lines on the chart.
2. "ZigZag Settings" Group
- ZigZag Length: Defines the minimum distance between extremes. Increase the value to find larger and more significant structures.
- Show ZigZag: Shows the ZigZag line.
- Show Only Current Structure (in the "Display Settings" group): A key setting. When enabled, the indicator removes all previous structures and displays only the most recent one, preventing chart clutter.
3. Visualization Settings
- Show Boxes: Shows the trading zone (between 38.2% and 60.6%).
- Box Length: The width of the box and all accompanying lines in bars.
- Show Targets: Shows the target lines and labels.
- Show Structure Break: Shows the structure break level line and label.
- Show HH/LL Labels: Shows "HH" and "LL" labels on the corresponding extremes.
- Show Connection Lines: Draws a line connecting the HH and LL extremes.
📊 Signal Interpretation
Bullish Signal (Long Setup)
1. Formation: A structure appears: LL (Lower Low), followed by HH (Higher High).
2. Visualization:
- Green Zone (Box): The area between 38.2% and 60.6% of the move from LL to HH. Considered as an area for entering long positions.
- Structure Break Level: The price level of the LL. A stop-loss is typically placed below this level.
- Targets: Three lines calculated based on Fibonacci extensions (0.84, 1.306, 1.618). Serve as potential take-profit levels.
Bearish Signal (Short Setup)
1. Formation: A structure appears: HH (Higher High), followed by LL (Lower Low).
2. Visualization:
- Red Zone (Box): The area between 38.2% and 60.6% of the move from HH to LL. Considered as an area for entering short positions.
- Structure Break Level: The price level of the HH. A stop-loss is typically placed above this level.
- Targets: Three lines calculated based on Fibonacci extensions (0.16, -0.306, -0.618).
⚡ Alerts
The indicator has built-in conditions for creating alerts in TradingView:
"LONG Signal" - Triggers when a bullish LL->HH structure appears.
"SHORT Signal" - Triggers when a bearish HH->LL structure appears.
💎 Conclusion and Usage Tips
Setup Indicator is not just an indicator, but a complete system for finding and trading structural reversals.
- For conservative traders: Use larger values for ZigZag Length and ATR Multiplier to find only the most significant and confirmed market moves.
- For active traders: Adjust the parameters for lower timeframes to find more trade setups.
- Always use the "Structure Break" level for risk management. This is an integral part of the system.
- Combine signals with the overall market context and support/resistance levels to increase the probability of success.
Disclaimer: This tool is intended to assist in analysis and is not a direct trading recommendation. All trading decisions are made independently and at your own risk.

The Bear & Bull TieWhat it does:
Bear & Bull Tie is a moving average crossover indicator that identifies trend reversals and generates entry/exit signals based on the relationship between price and three simple moving averages (SMA 21, SMA 55, SMA 89). The indicator combines these three MAs into an Average Moving Average (AMA) to confirm directional bias, then uses ATR (Average True Range) volatility measurement for dynamic position sizing and stop-loss placement.
How it works:
The indicator operates on a simple but effective principle: it enters a bullish trend when price closes above all three moving averages simultaneously, and enters a bearish trend when price closes below all three MAs simultaneously. This "three MA alignment" approach filters out noise and confirms genuine trend changes. The indicator then plots:
Entry levels at the highest MA during uptrends or lowest MA during downtrends
Stop-loss zones calculated using 2x ATR distance from entry prices
Trend confirmation fill between price and the Average Moving Average, color-coded blue for bullish and red for bearish
The ATR-based stop-loss sizing adapts to market volatility, making it suitable for different market conditions and timeframes.
How to use it:
Monitor the filled zones to visually confirm your trend bias
Watch for alerts when new long or short setups form; entry prices and ATR-based stops are displayed on the chart
Trade the zones between your entry level and stop-loss zone, adjusting position size based on your risk tolerance
Exit when colors reverse to indicate trend termination
The indicator works best on higher timeframes (1H and above) where trend clarity is stronger and false signals are reduced.
Alerts: FOR AUTOMATION / NOTIFICATION's (create an alert for B/B tie (2, 4) that uses Any Alert / Function Call )
Long Positions:
entries ---> "Bull Tie on NVDA | Entry : 100.5 | ATR Stop : 99.5"
exits ------> "Bull Tie on NVDA | Exit : 110.1"
Short Positions:
entries ---> "Bear Tie on NVDA | Entry : 120.05 | ATR Stop : 85.05"
exits -----> "Bear Tie on NVDA | Exit : 100"
Credits:
This script incorporates concepts and code portions from @LOKEN94 with his explicit permission. Special thanks for the foundational logic that inspired this development.
Disclaimer:
This indicator is for educational and analytical purposes. It is not financial advice. Past performance does not guarantee future results. Always manage risk properly and use stops. Test thoroughly on historical data before live trading.

Profitsmaxx DayProfitProfitsMaxx DayProfit is the ultimate all-in-one indicator designed for traders who want consistent, high-quality trade signals across any coin and any timeframe. Built for day traders, it delivers precise entry and exit alerts that adapt seamlessly to market conditions — whether you’re trading crypto, forex, or indices.
Powered by advanced algorithms that combine market structure, momentum, and trend analysis, ProfitsMaxx Day Profit helps traders capture profitable moves while minimizing false signals. It’s trusted by both beginners and experienced traders as a reliable tool for daily trading success.
With its clear visuals, intuitive interface, and multi-market compatibility, Day Profit stands as the all-time best ProfitsMaxx indicator — giving you the edge to trade smarter, react faster, and grow your profits with confidence.
👉 Available now at www.profitsmaxx.com

TrendIsYourFriend Strategy (SPY,IWM,VYM,XLK,SPXL,BTC,GOLD,VT...)Personal disclaimer
Don’t trust this strategy. Don’t trust any other model either just because of its author or a backtest curve. Overfitting is an easy trap, and beginners often fall into it. This script isn’t meant to impress you. It’s meant to survive reality. If it does, maybe it will raise questions and you’ll remember it.
Legal disclaimer
Educational purposes only. Not financial advice. Past performance is not indicative of future results.
Strategy description
Long-only, trend-based logic with two entry types (trend continuation or excess-move reversion), dynamic stop-losses, and a VIX filter to avoid turbulent markets.
Minimal number of parameters with enough trades to support robustness.
For backtest, each trade is sized at $10,000 flat (no compounding, to focus on raw model quality and the regularity of its results over time).
Fees = $0 (neutral choice, as brokers differ).
Slippage = $0, deliberate choice: most entries occur on higher timeframes, and some assets start their history on charts at very low prices, which would otherwise distort results.
What makes this script original
Beyond a classical trend calculation, both excess-move entries and dynamic stop-loss exits also rely on trend logic. Except for the VIX filter, everything comes from trend functions, with very few parameters.
Pre-configurations are fixed in the code, allowing sincere performance tracking across a dozen cases over the medium to long term.
Allowed
SPY (ARCA) — 2-hour chart: S&P 500 ETF, most liquid equity benchmark
IWM (ARCA) — Daily chart: Russell 2000 ETF, US small caps
VYM (ARCA) — Daily chart: Vanguard High Dividend Yield ETF
XLK (ARCA) — Daily chart: Technology Select Sector SPDR
SPXL (ARCA) — Daily chart: 3× leveraged S&P 500 ETF
BTCUSD (COINBASE) — 4-hour chart: Bitcoin vs USD
GOLD (TVC) — Daily chart: Gold spot price
VT (ARCA) — Daily chart: Vanguard Total World Stock ETF
PG (NYSE) — Daily chart: Procter & Gamble Co.
CQQQ (ARCA) — Daily chart: Invesco China Technology ETF
EWC (ARCA) — Daily chart: iShares MSCI Canada ETF
EWJ (ARCA) — Daily chart: iShares MSCI Japan ETF
How to use and form an opinion on it
Works only on the pairs above.
Feel free to modify the input parameters (slippage, fees, order size, margins, …) to see how the model behaves under your own conditions
Compare it with a simple Buy & Hold (requires an order size of 100% equity).
You may also want to look at its time-in-market — the share of time your capital is actually at risk.
Finally, let me INSIST on this : let it run live for months before forming an opinion!
Share your thoughts in the comments 🚀 if you’d like to discuss its live performance.

CNagda Anchor2EntryCNagda Anchor2Entry Pine Script v6 overlay indicator pulls higher-timeframe (HTF) signal events to define anchor high/low levels and then projects visual entry labels on the lower-timeframe (LTF). It also draws auto-oriented Fibonacci retracement/extension levels for context, but it does not execute orders, stops, or targets—only visual guidance.
Inputs
Key inputs include Lookback Length for HTF scanning and a Signal Timeframe used with request.security to import HTF events onto the active chart.
Entry behavior can be set to “Confirm only” or “Wait candle,” trade side can be restricted to Buy/Sell/Both, and individual strategies (Buy WAIT/S1; Sell REV/S1/S2/S3) can be toggled.
HTF logic
The script defines WAIT/BUY setup and confirmation, SELL reversal on breaking the WAIT BUY low, and several volume/candle-based patterns (Sell S1/S2/S3, Buy S1).
It captures the associated highs/lows at those events with ta.valuewhen and imports them via request.security to form anchors (anc_hi/anc_lo) and “new trigger” booleans that gate label creation on the LTF.
Flip entries
When enabled, “Flip entries” generate contrarian labels based on breaking or confirming HTF anchors: crossing above anc_hi can trigger a flip-to-sell label, and crossing below anc_lo can trigger a flip-to-buy label.
The flip mode supports Immediate (on cross) or Confirm (on sustained break) to control how strict the trigger is.
Fibonacci drawing
User-specified Fib levels are parsed from a string, safely converted to floats, and drawn as dotted horizontal lines only when they fall inside an approximate visible viewport. Orientation (up or down) is decided automatically from pending signal direction and a simple context score (candle bias, trend, and price vs. mid), with efficient redraw/clear guards to avoid clutter.
Dynamic anchors
If HTF anchors are missing or too far from current price (checked with an ATR-based threshold), the script falls back to local swing highs/lows to keep the reference range relevant. This dynamic switch helps Fib levels and labels remain close to current market structure without manual intervention.
Signal labels
Labels are created only on confirmed bars to avoid repainting noise, with one “latest” label kept by deleting the previous one. The script places BUY/SELL labels for WAIT/CONFIRM, direct HTF patterns (Buy S1, Sell S1/S2/S3), and contrarian flip events, offset slightly from highs/lows with clear coloring and configurable sizes.
Visual context
Bars are softly colored (lime tint for bullish, orange tint for bearish) for quick context, and everything renders as an overlay on the price chart. Fib labels include a Δ readout (distance from current close), and line extension length, label sizes, and viewport padding are adjustable.
How to use
Set the Signal Timeframe and Lookback Length to establish which HTF structures and ranges will drive the anchors and entry conditions. Choose entry flow (Wait vs Confirm), enable Flip if contrarian triggers are desired, select the trade side, toggle strategies, and customize Fibonacci levels plus dynamic-anchor fallback for practical on-chart guidance.
Notes
This is a visual decision-support tool; it does not place trades, stops, or targets and should be validated on charts before live use. It is written for Pine Script v6 and relies heavily on request.security for HTF-to-LTF transfer of signals and anchors.

EdgeFlow Pullback [CHE]EdgeFlow Pullback \ — Icon & Visual Guide (Deep Dive)
TL;DR (1-minute read)
⏳ Hourglass = Pending verdict. A countdown runs from the signal bar until your Evaluation Window ends.
✔ Checkmark (green) = OK. After the evaluation window, price (HLC3) is on the correct side of the EMA144 for that signal’s direction.
✖ Cross (red) = Fail. After the evaluation window, price (HLC3) is on the wrong side of the EMA144.
▲ / ▼ Triangles = the actual PB Long/Short signal bar (sequence completed in time).
Small lime/red crosses = visual markers when HLC3 crosses EMA144 (context, not trade signals).
Orange line = EMA144 (baseline/trend filter).
T3 line color = Context signal: green when T3 is below HLC3, red when T3 is above HLC3.
Icon Glossary (What each symbol means)
1) ⏳ Hourglass — “Pending / Countdown”
Appears immediately when a PB signal fires (Long or Short).
Shows `⏳ currentBars / EvaluationBars` (e.g., `⏳ 7/30`).
The label stays anchored at the signal bar and its original price level (it does not drift with price).
During ⏳ you get no verdict yet. It’s simply the waiting period before grading.
2) ✔ Checkmark (green) — “Condition met”
Appears after the Evaluation Window completes.
Logic:
Long signal: HLC3 (typical price) is above EMA144 → ✔
Short signal: HLC3 is below EMA144 → ✔
The label turns green and text says “✔ … Condition met”.
This is rules-based grading, not PnL. It tells you if the post-signal structure behaved as expected.
3) ✖ Cross (red) — “Condition failed”
Appears after the Evaluation Window completes if the condition above is not met.
Label turns red with “✖ … Condition failed”.
Again: rules-based verdict, not a guarantee of profit or loss.
4) ▲ “PB Long” triangle (below bar)
Marks the exact bar where the 4-step Long sequence completed within the allowed window.
That bar is your signal bar for Long setups.
5) ▼ “PB Short” triangle (above bar, red)
Same as above, for Short setups.
6) Lime/Red “+” crosses (tiny cross markers)
Lime cross (below bar): HLC3 crosses above EMA144 (crossover).
Red cross (above bar): HLC3 crosses below EMA144 (crossunder).
These crosses are context markers; they’re not entry signals by themselves.
The Two Clocks (Don’t mix them up)
There are two different time windows at play:
1. Signal Window — “Max bars for full sequence”
A pullback signal (Long or Short) only fires if the 4-step sequence completes within this many bars.
If it takes too long: reset (no signal, no triangle, no label).
Purpose: avoid stale setups.
2. Evaluation Window — “Evaluation window after signal (bars)”
Starts after the signal bar. The label shows an ⏳ countdown.
When it reaches the set number of bars, the indicator checks whether HLC3 is on the correct side of EMA144 for the signal direction.
Then it stamps the signal with ✔ (OK) or ✖ (Fail).
Timeline sketch (Long example):
```
→ ▲ PB Long at bar t0
Label shows: ⏳ 0/EvalBars
t0+1, t0+2, ... t0+EvalBars-1 → still ⏳
At t0+EvalBars → Check HLC3 vs EMA144
Result → ✔ (green) or ✖ (red)
(Label remains anchored at t0 / signal price)
```
What Triggers the PB Signal (so you know why triangles appear)
LONG sequence (4 steps in order):
1. T3 falling (the pullback begins)
2. HLC3 crosses under EMA144
3. T3 rising (pullback ends)
4. HLC3 crosses over EMA144 → PB Long triangle
SHORT sequence (mirror):
1. T3 rising
2. HLC3 crosses over EMA144
3. T3 falling
4. HLC3 crosses under EMA144 → PB Short triangle
If steps 1→4 don’t complete in time (within Max bars for full sequence), the sequence is abandoned (no signal).
Lines & Colors (quick interpretation)
EMA144 (orange): your baseline trend filter.
T3 (green/red):
Green when T3 < HLC3 (price above the smoothed path; often supportive in up-moves)
Red when T3 > HLC3 (price below the smoothed path; often pressure in down-moves)
HLC3 (gray): the typical price the logic uses ( (H+L+C)/3 ).
Label Behavior (anchoring & cleanup)
Each signal creates one label at the signal bar with ⏳.
The label is position-locked: it stays at the same bar index and y-price it was born at.
After the evaluation check, the label text and color update to ✔/✖, but position stays fixed.
The indicator keeps only the last N labels (your “Show only the last N labels” input). Older ones are deleted to reduce clutter.
What You Can (and Can’t) Infer from ✔ / ✖
✔ OK: Structure behaved as intended during the evaluation window (HLC3 finished on the correct side of EMA144).
Inference: The pullback continued in the expected direction post-signal.
✖ Fail: Structure ended up opposite the expectation.
Inference: The pullback did not continue cleanly (chop, reversal, or insufficient follow-through).
> Important: ✔/✖ is not profit or loss. It’s an objective rule check. Use it to identify market regimes where your entries perform best.
Input Settings — How they change the visuals
T3 length:
Shorter → faster turns, more signals (and more noise).
Longer → smoother turns, fewer but cleaner sequences.
T3 volume factor (0–1, default 0.7):
Higher → more curvature/smoothing.
Typical sweet spot: 0.5–0.9.
EMA length (baseline) default 144:
Smaller → faster baseline, more cross events, more aggressive signals.
Larger → slower, stricter trend confirmation.
Max bars for full sequence (signal window):
Smaller → only fresh, snappy pullbacks can signal.
Larger → allows slower pullbacks to complete.
Evaluation window (after signal):
Smaller → verdict arrives quickly (less tolerance).
Larger → gives the trade more time to prove itself structurally.
Show only the last N labels:
Controls chart clutter. Increase for more history, decrease for focus.
(FYI: The “Debug” toggle exists but doesn’t draw extra overlays in this version.)
Practical Reading Flow (how to use visuals in seconds)
1. Triangles catch your eye: ▲ for Long, ▼ for Short. That’s the setup completion.
2. ⏳ label starts—don’t judge yet; let the evaluation run.
3. Watch EMA slope and T3 color for context (trend + pressure).
4. After the window: ✔/✖ stamps the outcome. Log what the market was like when you got ✔.
Common “Why did…?” Questions
Q: Why did I get no triangle even though T3 turned and EMA crossed?
A: The 4 steps must happen in order and within the Signal Window. If timing breaks, the sequence resets.
Q: Why did my label stay ⏳ for so long?
A: That’s by design until the Evaluation Window completes. The verdict only happens at the end of that window.
Q: Why is ✔/✖ different from my PnL?
A: It’s a structure check, not a profit check. It doesn’t know your entries/exits/stops.
Q: Do the small lime/red crosses mean buy/sell?
A: No. They’re context markers for HLC3↔EMA crosses, useful inside the sequence but not standalone signals.
Pro Tips (turn visuals into decisions)
Entry: Use the ▲/▼ triangle as your trigger, in trend direction (check EMA slope/market structure).
Stop: Behind the pullback swing around the signal bar.
Exit: Structure levels, R-multiples, or a reverse HLC3↔EMA cross as a trailing logic.
Tuning:
Intraday/volatile: shorter T3/EMA + tighter Signal Window.
Swing/slow: default 144 EMA + moderate windows.
Learn quickly: Filter your chart to show only ✔ or only ✖ windows in your notes; see which sessions, assets, and volatility regimes suit the system.
Disclaimer
No indicator guarantees profits. Sweep2Trade Pro \ is a decision aid; always combine with solid risk management and your own judgment. Backtest, forward test, and size responsibly.
The content provided, including all code and materials, is strictly for educational and informational purposes only. It is not intended as, and should not be interpreted as, financial advice, a recommendation to buy or sell any financial instrument, or an offer of any financial product or service. All strategies, tools, and examples discussed are provided for illustrative purposes to demonstrate coding techniques and the functionality of Pine Script within a trading context.
Any results from strategies or tools provided are hypothetical, and past performance is not indicative of future results. Trading and investing involve high risk, including the potential loss of principal, and may not be suitable for all individuals. Before making any trading decisions, please consult with a qualified financial professional to understand the risks involved.
By using this script, you acknowledge and agree that any trading decisions are made solely at your discretion and risk.
Enhance your trading precision and confidence 🚀
Happy trading
Chervolino

Sweep2Trade Pro [CHE]Sweep2Trade Pro \ — Liquidity Sweep → Trend → Confirmation
Sweep2Trade Pro \ helps you catch high-probability reversals or continuations that start with a liquidity sweep, align with the T3 trend, and finalize with a structure confirmation (BOS). It’s designed to reduce noise, time your entries, and keep you out of weak, chop-driven signals.
What’s a “sweep”?
A liquidity sweep happens when price briefly breaks a prior swing high/low (where many stops sit), triggers those stops, and then snaps back. This “stop-hunt” creates liquidity for bigger players and often precedes a sharp move in the opposite direction if the break fails, or fuels continuation if structure actually shifts.
What’s a BOS (Break of Structure)?
A BOS is a price action event where the market takes out a recent swing level in the trend’s direction, signaling continuation and confirming that structure has shifted (bullish BOS through a recent swing high, bearish BOS through a recent swing low).
How the indicator works (at a glance)
1. Regime Filter (T3 + R²)
T3 Moving Average: A smoother, faster-responding moving average that aims to reduce lag while filtering noise, so trend direction changes are clearer.
R² (Coefficient of Determination): Measures how “linear” the recent price path is (0→1). Higher values = stronger, cleaner trend; lower values = more chop. Used here to allow trades only when trend quality exceeds a user-set threshold.
2. Sweep Detection
Bullish sweep: price pokes below a prior swing low and closes back above it.
Bearish sweep: price pokes above a prior swing high and closes back below it.
Lookback length is configurable.
3. Sequence Lock (built-in FSM)
The script manages state in phases so you don’t jump the gun:
Phase 1: Sweep detected → wait for T3 to turn in the corresponding direction.
Phase 2: T3 direction confirmed → show “SWEEP OK” and wait for final confirmation.
Trade Signal: Only fires if confirmation arrives before a timeout.
4. Confirmation Layer
BOS via wick or close (you choose),
Strong close toward the signal (top/bottom quartile of the candle),
Optional “close above/below T3” condition.
These checks help avoid weak sweeps that immediately fade.
5. Alerts & Visuals
“SWEEP OK” markers show when the sweep + T3 direction align.
Final BUY/SELL arrows appear only when the confirmation layer passes.
Ready-made alert conditions for automation.
What you can do with it
Time reversals after sweeps: Enter when a stop-hunt fades and structure confirms.
Ride continuations: Use BOS with the T3 trend to pyramid or re-enter with structure on your side.
Filter chop: Let R² gate entries to periods with cleaner directional drift.
Automate: Use the included alerts with your platform or webhook setup.
Inputs (key settings)
Regime Filter
T3 Length / Volume Factor: Controls smoothness and responsiveness. Smaller length → faster, more sensitive; higher volume factor → smoother curve.
R² Lookback & Threshold: Length of the linear fit window and the minimum “trend quality” required. Higher thresholds mean fewer, cleaner signals.
Sweep / Sequence
Swing Lookback: How far back to define the “reference” high/low for sweeps.
Timeout: Maximum bars allowed between phases to keep signals fresh.
Restart timeout on Phase 2: Optional safety so entries don’t go stale.
Confirmation
BOS Lookback: Micro-pivot window for structure breaks.
Wick vs Close BOS: Conservative traders may prefer close.
Require close above/below T3: Tightens confirmation with trend alignment.
Practical guide (quick start)
1. Timeframe & markets: Works across majors, indices, and crypto. Start with 5m–1h intraday or 1h–4h swing; adjust R² threshold upward on noisier pairs.
2. Entry recipe (Long):
Bullish sweep of a prior low → T3 turns up → BOS/strong close.
Optional: enable “close above T3” for extra confirmation.
3. Entry recipe (Short): Mirror the above.
4. Stops: Common choices are just beyond the sweep wick (tighter) or past the BOS invalidation (safer).
5. Targets: Previous structural levels, measured move, or a T3 trail (exit when price closes back through T3).
6. Avoid low-quality contexts: If R² is very low, market is likely ranging erratically—skip or widen filters.
Tips & best practices
Context first: The same sweep means different things in a strong trend vs. flat regime; that’s why the T3+R² filter exists.
BOS choice: Wick-based BOS is earlier but noisier; close-based BOS is slower but cleaner. Tune per market.
Backtest -> Forward test: Validate settings per symbol/timeframe; then paper trade before going live.
Risk: Fixed fractional risk with asymmetric R\:R (e.g., 1:1.5–1:3) generally performs better than “all-in” discretionary sizing.
Behind the scenes (for the curious)
T3 is a multi-stage EMA construction that produces a smooth curve with reduced lag versus simple/standard EMAs.
R² is the square of correlation (0–1). Here it’s used as a moving gauge of how well price aligns to a linear path—our “trend quality” dial.
Stop-hunts / sweeps are a recognized microstructure phenomenon where clustered stops provide the liquidity that fuels the next move.
Disclaimer
No indicator guarantees profits. Sweep2Trade Pro \ is a decision aid; always combine with solid risk management and your own judgment. Backtest, forward test, and size responsibly.
The content provided, including all code and materials, is strictly for educational and informational purposes only. It is not intended as, and should not be interpreted as, financial advice, a recommendation to buy or sell any financial instrument, or an offer of any financial product or service. All strategies, tools, and examples discussed are provided for illustrative purposes to demonstrate coding techniques and the functionality of Pine Script within a trading context.
Any results from strategies or tools provided are hypothetical, and past performance is not indicative of future results. Trading and investing involve high risk, including the potential loss of principal, and may not be suitable for all individuals. Before making any trading decisions, please consult with a qualified financial professional to understand the risks involved.
By using this script, you acknowledge and agree that any trading decisions are made solely at your discretion and risk.
Enhance your trading precision and confidence 🚀
Happy trading
Chervolino

PROFIT ZONE PRO Profit Zone Pro:
ProfitZone Pro is a risk-reward indicator that helps traders identify trade setups, manage risk, and set profit targets. Designed for simplicity, this free tool generates entry, stop-loss, and take-profit levels based on support and resistance, Trailing Stoploss and built in automated alerts, with additional features to enhance trade planning, Along with a learning mode based on successful trades made
Features
Trade Setup Identification: Detects potential buy (long) or sell (short) entries using support and resistance levels, with an optional trend filter based on a 50-period SMA.
Risk-Reward Zones: Displays entry (yellow), stop-loss (red), and take-profit (green) levels, with shaded risk (red) and reward (green) zones.
Position Sizing: Calculates position size based on user-defined risk percentage and account balance.
Breakeven and Trailing Stop: Includes a breakeven feature to move the stop-loss to the entry price at a user-defined percentage of the take-profit distance, and an optional trailing stop to lock in profits.
Confidence Score: Provides a volatility-based confidence score (0-100%) to assess setup reliability.
Learning Adjustment: Adjusts stop-loss distances based on the number of successful trades entered by the user.
Info Label: Shows position size, risk, reward, direction, confidence score, ATR, trend direction (if enabled), and trailing stop status.
Alerts: Sends notifications for entry, stop-loss, take-profit, breakeven, trailing stop, and theme changes.
Customizable Display: Offers options for zone opacity, line styles (solid, circles, dotted), zone labels, and color themes (Light, Dark, Custom).
Long Mode Feature:
Short Mode Feature:
Trend Filter Feature:
Auto Trading Mode:
Usage Instructions
Add the indicator to your chart.
Adjust settings in the indicator’s properties:
Set Risk % of Account and Account Balance to define your risk and position size.
Choose Trade Direction (Auto, Long, or Short) to filter setups.
Enable Trend Filter to align trades with the market trend.
Turn on Trailing Stop and set Trailing Stop % of Reward to lock in profits.
Customize visuals (zone opacity, line style, colors) as needed.
Monitor the chart for entry (yellow), stop-loss (red), and take-profit (green) levels.
Use the info label to view position size, risk, reward, confidence score, and other details.
Set alerts for entry, stop-loss, take-profit, breakeven, and trailing stop events.
After a successful trade, increment Number of Successful Trades to adjust future stop-loss distances.
This Script is to help you have a better idea on those famous questions we ask ourselves:
Entry
Take Profit
Stoploss
The confidence score, R:R calculator, Trend Filter, Learning Mode further helps to zone in on accuracy
Happy Trading
- EZ ALGO

TO THE MOON by ZdormanThe indicator "TO THE MOON by Zdorman" is written in Pine Script version 5 and is designed for volatility analysis, detection of abnormal volumes, and generation of trading signals.
The indicator operates in a separate panel below the chart.
Parameters:
length: The period for calculating volatility.
threshold: The threshold value for volatility. If volatility exceeds this value, the indicator highlights it on the chart.
volume_threshold_multiplier: A multiplier for determining abnormal volumes. The average volume is multiplied by this factor to determine the threshold for abnormal volume.
annualize: An option to annualize volatility. If enabled, volatility is multiplied by the square root of 252 (the number of trading days in a year).
Daily Return Calculation:
The daily return is calculated as the percentage change in the closing price of the current bar relative to the previous bar.
Volatility Calculation:
Volatility is calculated as the standard deviation of daily returns over the specified period.
The ta.stdev function is used to compute the standard deviation.
If volatility exceeds the threshold value, the histogram bars are colored yellow. Otherwise, they are colored blue.
Histogram:
The histogram displays the volatility value.
The display style is columns.
A horizontal line corresponding to the volatility threshold is displayed on the chart.
The line is red and has a dashed style.
Conditions for a "Long" Signal:
Volatility exceeds the threshold value.
The closing price is higher than the opening price.
The volume is abnormal (exceeds the average volume by the specified multiplier).
The indicator supports the creation of alerts for "Long" signals. The alert triggers when all conditions for the signal are met.
Parameter Configuration:
Set the volatility period according to your trading strategy.
Configure the volatility threshold and volume multiplier to filter signals. It is recommended to use the default settings.
Signal Interpretation:
Yellow histogram bars indicate increased volatility.
"Long" signals appear when all conditions are met and can be used as entry points for a position.
The "TO THE MOON by Zdorman" indicator is a powerful tool for volatility analysis and finding market entry points. Its logic is based on a combination of volatility, volume, and price movements, making it useful for traders operating in various markets. Happy trading!

Whale Buy Activity Detector (Real-Time)Whale Buy Activity Detector (Real-Time)
This indicator helps to identify abnormal spikes in the volume of purchases, which may indicate the activity of large players ("whales"). It analyzes the volume of purchases and compares it with the average volume over a certain period of time. If the volume of purchases exceeds a set threshold, the indicator marks this as potential whale activity.
Basic parameters:
Volume Threshold (x Average): The coefficient by which the current purchase volume must exceed the average volume in order to be considered abnormal. The default value is 2.0, which means that the purchase volume should be 2 times the average volume for the selected time period. This parameter can be adjusted in the range from 1.0 and higher in increments of 0.1.
Example: If you set the value to 1.5, the indicator will mark situations when the volume of purchases exceeds the average volume by 1.5 times.
Lookback Period: The time period used to calculate the average purchase volume. The default value is 20, which means that the average purchase volume will be calculated for the last 20 candles. This parameter can be set in the range from 1 and above.Example: If you set the value to 10, the average purchase volume will be calculated for the last 10 candles.
How to use:
Buy Volume: Shows the volume of purchases on each candle. This is the volume that was sold at a price higher than the opening price of the candle.
Average Buy Volume: The average volume of purchases over a given time period (Lookback Period). This parameter helps to determine the "normal" level of purchase volume.
Whale Buy: Notes abnormal spikes in the volume of purchases, which may indicate the activity of "whales". The indicator draws a mark on the top of the candle when the purchase volume exceeds the threshold set by the Volume Threshold parameter.
Notifications:
The indicator can send notifications when an abnormal volume of purchases is detected. You can set up notifications via the TradingView menu to receive real-time alerts.
Usage example:
If you are trading in a highly volatile market, you can increase the Volume Threshold to filter out small volume spikes.
If you trade in a low-volatility market, you can reduce the Volume Threshold to capture even small anomalies.

Scalping long-shortThe Scalping long-short indicator is a comprehensive system for analyzing candle patterns and trading volume, designed for use in a scalping strategy. The main purpose of the indicator is to identify the key points of changing market sentiment and provide the trader with accurate signals for entering a trade.
The main components of the indicator:
1. Candle Pattern Analysis:
The indicator analyzes four main candle patterns:
-A Bullish Hammer is a candle with a small body and a long lower tail, which indicates the possible completion of a downward movement and the beginning of an uptrend.
-Bearish Hanging Man is a candle similar to a bullish hammer, but it appears after an upward movement, signaling the possible beginning of a downtrend.
-Bullish Engulfing is a candle with a large body that completely covers the body of the previous candle, showing strong buyer interest.
-Bearish Engulfing is the reverse situation, when a large bearish candle absorbs the previous bullish candle, indicating the predominance of sellers.
-Doji is a candle with almost identical opening and closing prices, indicating market indecision.
For each of these patterns, the indicator sets certain threshold values that the user can adjust to their preferences and features of the trading instrument.
2. Volume analysis:
The volume is an important confirmation of the strength of the signal. The indicator compares the current volume with the average value for the user-selected period (length parameter) multiplied by the volumeMultiplier coefficient. If the current volume exceeds this indicator, the signal is considered confirmed.
3. Visual indication:
Graphical elements corresponding to each type of signal are displayed on the price chart.:
-The green triangle down is a buy signal (bullish hammer or bullish takeover).
-The red triangle up is a sell signal (bearish hanging or bearish engulfing).
-The yellow diamond is a neutral state (doji).
These visual cues help you quickly assess the current market situation without having to analyze each candle manually in depth.
4. Alerts:
The indicator supports setting alerts that can be sent via the TradingView platform or other supporting systems. This allows the trader to receive notifications about the occurrence of new signals even outside the workplace.
Settings:
The user can change the following settings:
-Length is the period for calculating the average volume.
-Multiplier is a multiplier for the thresholds of candle patterns.
-HammerThreshold, HangingManThreshold, EngulfingThreshold, DojiThreshold are Thresholds for recognizing specific candlestick patterns.
-VolumeMultiplier is a coefficient for comparing the current volume with the average value.
These parameters allow you to adapt the indicator to various trading instruments and time intervals, making it a universal tool for a wide range of traders.
Conclusion:
The Scalping long-short indicator combines powerful analytical tools to identify key points in the market, providing the trader with clear and timely signals for making trading decisions. Its flexibility and fine-tuning capability make it useful for both beginners and experienced market participants.

DAILY Supertrend + EMA Crossover with RSI FilterThis strategy is a technical trading approach that combines multiple indicators—Supertrend, Exponential Moving Averages (EMAs), and the Relative Strength Index (RSI)—to identify and manage trades.
Core Components:
1. Exponential Moving Averages (EMAs):
Two EMAs, one with a shorter period (fast) and one with a longer period (slow), are calculated. The idea is to spot when the faster EMA crosses above or below the slower EMA. A fast EMA crossing above the slow EMA often suggests upward momentum, while crossing below suggests downward momentum.
2. Supertrend Indicator:
The Supertrend uses Average True Range (ATR) to establish dynamic support and resistance lines. These lines shift above or below price depending on the prevailing trend. When price is above the Supertrend line, the trend is considered bullish; when below, it’s considered bearish. This helps ensure that the strategy trades only in the direction of the overall trend rather than against it.
3. RSI Filter:
The RSI measures momentum. It helps avoid buying into markets that are already overbought or selling into markets that are oversold. For example, when going long (buying), the strategy only proceeds if the RSI is not too high, and when going short (selling), it only proceeds if the RSI is not too low. This filter is meant to improve the quality of the trades by reducing the chance of entering right before a reversal.
4. Time Filters:
The strategy only triggers entries during user-specified date and time ranges. This is useful if one wants to limit trading activity to certain trading sessions or periods with higher market liquidity.
5. Risk Management via ATR-based Stops and Targets:
Both stop loss and take profit levels are set as multiples of the ATR. ATR measures volatility, so when volatility is higher, both stops and profit targets adjust to give the trade more breathing room. Conversely, when volatility is low, stops and targets tighten. This dynamic approach helps maintain consistent risk management regardless of market conditions.
Overall Logic Flow:
- First, the market conditions are analyzed through EMAs, Supertrend, and RSI.
- When a buy (long) condition is met—meaning the fast EMA crosses above the slow EMA, the trend is bullish according to Supertrend, and RSI is below the specified “overbought” threshold—the strategy initiates or adds to a long position.
- Similarly, when a sell (short) condition is met—meaning the fast EMA crosses below the slow EMA, the trend is bearish, and RSI is above the specified “oversold” threshold—it initiates or adds to a short position.
- Each position is protected by an automatically calculated stop loss and a take profit level based on ATR multiples.
Intended Result:
By blending trend detection, momentum filtering, and volatility-adjusted risk management, the strategy aims to capture moves in the primary trend direction while avoiding entries at excessively stretched prices. Allowing multiple entries can potentially amplify gains in strong trends but also increases exposure, which traders should consider in their risk management approach.
In essence, this strategy tries to ride established trends as indicated by the Supertrend and EMAs, filter out poor-quality entries using RSI, and dynamically manage trade risk through ATR-based stops and targets.

Nightrangers IndicatorDescription
This indicator combines three EMA's, Ichimoku Cloud, RSI and MACD. By combining and modifying their use case this turns into an extremely powerful and accessible indicator for finding long and short position entries, below is a description of how to use this indicator, and what makes it different.
Primary Use case
The three EMA's would be the initial indicators you would be looking at, they are based on the 7d, 25d and 200d MA - Used on their own, they would be worthless, and this is where the Ichimoku Cloud comes into it, I have removed all other aspects of the Ichimoku Cloud and only kept the baseline, combine this with the three MA's and we have a very powerful indicator for finding Long entries, that is used uniquely in a way to which the Ichimoku Cloud is not originally meant to be used for.
An early indication of a LONG entry would be when the 7d MA crosses above the Ichimoku Baseline, through this early indicator, you are able to watch and monitor the chart, you would be waiting to see if the 25d MA then also crosses above the Ichimoku Baseline, This would be the second important indication of a long entry. The 200d MA helps here when making decisions on where to set your own personal take profits - If the Ichimoku baseline, and the MA's are below the 200d MA, you would be expecting a bounce point here, or heavy resistance so the long entry could be over a shorter period, than that if it was above the 200d MA, which is why it is included here, to help make a better informed choice.
The latter is reversed for finding short positions, and entries. This indicator is completely reliant on each other to find the best possible entry/exit by complementing each other, and by using the Ichimoku Baseline on it's own, and not as the Ichimoku Cloud is intended.
Just using these though, is not enough, which is why the RSI and MACD are also combined, once the conditions are met above, You may find that there can be false positives for entries, and this is where the RSI has multiple use cases within this script.
Firstly the backdrop colour will change based on whether the chart is in an uptrend or downtrend, This is a visual indicator provided to work simultaneaously on the chart itself to help identification of entries/exits easier to identify in conjunction with the above.
Secondly, It is used to display in the top right, The current Trend in a text format, as well as if the current chart is in one of three phases, these are Overbrought, Oversold and accumulation.
And finally it will display the current RSI Value on the last candle in a clear to see blue Label, This helps with the visual accessible side, to help you make a more informed choice depending on your own personal tolerance.
This ties into the above Indicators, by combining the information, you would not be looking to take a long, if for example, the RSI showed it was over-brought, and in a downtrend, even if the MA's had crossed above the Baseline, as this would most likely be a fakeout.
However if the Indicators above, showed a potential long, and the backdrop had flipped green, indicating an uptrend, and it was in an accumulation phase, you would consider this position. and this is where the MACD comes into play.
You would use the MACD to see whether or not the Signal line has crossed over the MACD line, and vice versa - However this script uses it to simplify and portray current market sentiment, and visually display by reducing clutter on screen, and making it more accessible.
It is designed to portray an easy to read and understand visual indicator by displaying in the top right simply as Bullish or Bearish, with markers above the candles ( "M" and "MX" ).
The M indicator is to show where the MACD Crosses above the Signal, and if aligned with all the other indicators within the script, shows a very strong confirmation for a buying opportunity, and vice versa for the "MX" indicator if aligned with the other indicators in reverse, provides a very strong confirmation for opening a short position or for selling.
Secondary Use case
By combining the indicators above, the secondary conditions you would be looking for, If you opened a LONG position, would be knowing when to sell, On top of what has been described above already regarding this, you would be looking to start taking profits, when the 7d MA crosses above or across the candles, and looking to close the position, when the 25d MA also crosses above the candles, and respectively, in reverse for closing short positions. This is shown across the charts to be extremely useful, however, combine this with the other indicators, portrayed in an easy to use and understand visual representation, you are now able to make more informed decisions, on whether to close a position or not.
How is it different and not just a mash up
I have combined these indicators to make the world of trading more accessible for everyone regardless of circumstances, by creating an easy to understand visual representation, keeping colours vibrant and easy to stand out, with clear and simple to read text indications. So whether you are a seasoned trader, or just starting out, you can make more informed choices, without the need of learning how to use multiple different indicators, and learning how to combine them all, or if you have difficulties learning, this indicator also simplifies a lot of the more technical intricacies, by still allowing you to make a more informed choice.

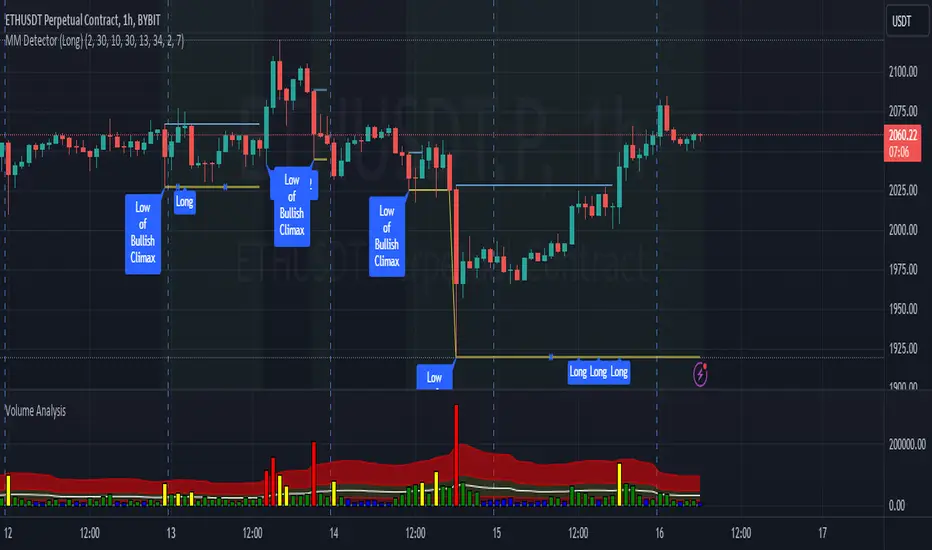
MM Detector (Long)This script tries to detect a market maker pattern.
A market maker pattern is usually made up of a high volume push down followed by a w pattern.
The script finds a market maker low with unusual volume and then looks for a push high (also with high volume) and usually through the ema 50.
The first push is normally a test but can be a good place to go long.
There are often atleast two pushes up in a MM pattern.
How to use.
Wait for the indicator to detect a market maker push low with high volume.
Along with other confirmations, go long when the indicator prints the first or second long push.
TrendLine CrossThis indicator "TrendLine Cross", is designed to plot trend lines so you can spot potential trend reversal points on the charts. The main function is to draw several lines on the chart and identify the crossings between these lines, which can be significant indicators for trading. The lines are based on different periods which can be changed in the settings tabs.
Let's see the characteristics of the trend lines:
_Low Line Color(Green Line): This line connects the lowest point of low prices in the "low_time" period with the lowest point of low prices in the "high_time" period. Indicates a possible short-term support level on the chart.
_Liquidity Up Line Color (Golden Line): This line connects the lowest point of low prices in the "low_time" period with the highest point of low prices in the same period. It represents a liquidity zone and an important resistance in the chart.
_Lower Line Color (Blue Line): This horizontal line connects the lowest point of low prices in the "LowerLine_period" with the lowest point of low prices in the "high_time" period. Indicates a possible long-term support level.
_Upper Line Colorr: This line represents a connection between the highest points of the "high_time" period and the lowest point of the "LowerLine_period". Indicates a possible long-term resistance level.
_Up Line Color (Red Line): This line connects the highest point of high prices in the "high_time" period with the highest point of high prices in the "LowerLine_period". It represents a possible long-term resistance level.
_Liquidity Down Line Color(Golden Line): This line connects the highest point of high prices in the "high_time" period with the highest point of low prices in the "low_time" period. It represents a liquidity point and an important support zone.
The indicator becomes particularly interesting when the lines make crossings. These crossovers could suggest a potential trend change in the market. For example:
Change from Bearish to Bullish: If the "long-term" line (black) crosses the "short- or long-term" line (green or blue) from top to bottom, it could indicate a shift from a bearish to a bullish market , suggesting the opportunity for long positions.
_Changing from Bullish to Bearish: If the "long-term" line (blue) crosses the "short-term" line (red or black) from bottom to top, it could indicate a shift from a bullish to a bearish market, suggesting the opportunity for short positions.
Generally speaking, crossings between these lines can be key points of interest for traders, as they can signal significant changes in price direction.

Long-Only Opening Range Breakout (ORB) with Pivot PointsIntraday Trading Strategy: Long-Only Opening Range Breakout (ORB) with Pivot Points
Background:
Opening Range Breakout (ORB) is a popular long-only trading strategy that capitalizes on the early morning volatility in financial markets. It's based on the idea that the initial price movements during the first few minutes or hours of the trading day can set the tone for the rest of the session. The strategy involves identifying a price range within which the asset trades during the opening period and then taking long positions when the price breaks out to the upside of this range.
Pivot Points are a widely used technical indicator in trading. They represent potential support and resistance levels based on the previous day's price action. Pivot points are calculated using the previous day's high, low, and close prices and can help traders identify key price levels for making trading decisions.
How to Use the Script:
Initialization: This script is written in Pine Script, a domain-specific language for trading strategies on the TradingView platform. To use this script, you need to have access to TradingView.
Apply the Script: You can do this by adding it to your favorites, then selecting the script in the indicators list under favorites or by searching for it by name under community scripts.
Customize Settings: The script allows you to customize various settings through the TradingView interface. These settings include:
Opening Session: You can set the time frame for the opening session.
Max Trades per Day: Specify the maximum number of long trades allowed per trading day.
Initial Stop Loss Type: Choose between using a percentage-based stop loss or the previous candles low for stop loss calculations.
Stop Loss Percentage: If you select the percentage-based stop loss, specify the percentage of the entry price for the stop loss.
Backtesting Start and End Time: Set the time frame for backtesting the strategy.
Strategy Signals:
The script will display pivot points in blue (R1, R2, R3, R4, R5) and half-pivot points in gray (R0.5, R1.5, R2.5, R3.5, R4.5) on your chart.
The green line represents the opening range.
The script generates long (buy) signals based on specific conditions:
---The open price is below the opening range high (h).
---The current high price is above the opening range high.
---Pivot point R1 is above the opening range high.
---It's a long-only strategy designed to capture upside breakouts.
---It also respects the maximum number of long trades per day.
The script manages long positions, calculates stop losses, and adjusts long positions according to the defined rules.
Trailing Stop Mechanism
The script incorporates a dynamic trailing stop mechanism designed to protect and maximize profits for long positions. Here's how it works:
1. Initialization:
The script allows you to choose between two types of initial stop loss:
---Percentage-based: This option sets the initial stop loss as a percentage of the entry price.
---Previous day's low: This option sets the initial stop loss at the previous day's low.
2. Setting the Initial Stop Loss (`sl_long0`):
The initial stop loss (`sl_long0`) is calculated based on the chosen method:
---If "Percentage" is selected, it calculates the stop loss as a percentage of the entry price.
---If "Previous Low" is selected, it sets the stop loss at the previous day's low.
3. Dynamic Trailing Stop (`trail_long`):
The script then monitors price movements and uses a dynamic trailing stop mechanism (`trail_long`) to adjust the stop loss level for long positions.
If the current high price rises above certain pivot point levels, the trailing stop is adjusted upwards to lock in profits.
The trailing stop levels are calculated based on pivot points (`r1`, `r2`, `r3`, etc.) and half-pivot points (`r0.5`, `r1.5`, `r2.5`, etc.).
The script checks if the high price surpasses these levels and, if so, updates the trailing stop accordingly.
This dynamic trailing stop allows traders to secure profits while giving the position room to potentially capture additional gains.
4. Final Stop Loss (`sl_long`):
The script calculates the final stop loss level (`sl_long`) based on the following logic:
---If no position is open (`pos == 0`), the stop loss is set to zero, indicating there is no active stop loss.
---If a position is open (`pos == 1`), the script calculates the maximum of the initial stop loss (`sl_long0`) and the dynamic trailing stop (`trail_long`).
---This ensures that the stop loss is always set to the more conservative of the two values to protect profits.
5. Plotting the Stop Loss:
The script plots the stop loss level on the chart using the `plot` function.
It will only display the stop loss level if there is an open position (`pos == 1`) and it's not a new trading day (`not newday`).
The stop loss level is shown in red on the chart.
By combining an initial stop loss with a dynamic trailing stop based on pivot points and half-pivot points, the script aims to provide a comprehensive risk management mechanism for long positions. This allows traders to lock in profits as the price moves in their favor while maintaining a safeguard against adverse price movements.
End of Day (EOD) Exit:
The script includes an "End of Day" (EOD) exit mechanism to automatically close any open positions at the end of the trading day. This feature is designed to manage and control positions when the trading day comes to a close. Here's how it works:
1. Initialization:
At the beginning of each trading day, the script identifies a new trading day using the `is_newbar('D')` condition.
When a new trading day begins, the `newday` variable becomes `true`, indicating the start of a new trading session.
2. Plotting the "End of Day" Signal:
The script includes a plot on the chart to visually represent the "End of Day" signal. This is done using the `plot` function.
The plot is labeled "DayEnd" and is displayed as a comment on the chart. It signifies the EOD point.
3. EOD Exit Condition:
When the script detects that a new trading day has started (`newday == true`), it triggers the EOD exit condition.
At this point, the script proceeds to close all open positions that may have been active during the trading day.
4. Closing Open Positions:
The `strategy.close_all` function is used to close all open positions when the EOD exit condition is met.
This function ensures that any remaining long positions are exited, regardless of their current profit or loss.
The function also includes an `alert_message`, which can be customized to send an alert or notification when positions are closed at EOD.
Purpose of EOD Exit
The "End of Day" exit mechanism serves several essential purposes in the trading strategy:
Risk Management: It helps manage risk by ensuring that positions are not left open overnight when markets can experience increased volatility.
Capital Preservation: Closing positions at EOD can help preserve trading capital by avoiding potential adverse overnight price movements.
Rule-Based Exit: The EOD exit is rule-based and automatic, ensuring that it is consistently applied without emotions or manual intervention.
Scalability: It allows the strategy to be applied to various markets and timeframes where EOD exits may be appropriate.
By incorporating an EOD exit mechanism, the script provides a comprehensive approach to managing positions, taking profits, and minimizing risk as each trading day concludes. This can be especially important in volatile markets like cryptocurrencies, where overnight price swings can be significant.
Backtesting: The script includes a backtesting feature that allows you to test the strategy's performance over historical data. Set the start and end times for backtesting to see how the long-only strategy would have performed in the past.
Trade Execution: If you choose to use this script for live trading, make sure you understand the risks involved. It's essential to set up proper risk management, including position sizing and stop loss orders.
Monitoring: Monitor the long-only strategy's performance over time and be prepared to make adjustments as market conditions change.
Disclaimer: Trading carries a risk of capital loss. This script is provided for educational purposes and as a starting point for your own long-only strategy development. Always do your own research and consider seeking advice from a qualified financial professional before making trading decisions.

Buy/Sell BoxThis indicator tries to identify the points where the price exceeds or falls below a rectangle based on the opening and closing prices of the previous period, the creation of the boxes occurs when a doji is detected therefore it will calculate the coordinates of the rectangle that will be drawn around it, therefore the indicator offers buy or sell signals based on this logic. Specifically, the buy signal is generated if the closing price is above the top of the rectangle and satisfies some previous price conditions while the sell signal is generated if the closing price is below the bottom of the rectangle and satisfies some conditions of previous prices within a further threshold based on the Ema 150.
Lines are then drawn on the graph to visually display the extreme price levels, which can be useful for any confirmation of buy and sell signals, Stop Loss and Take Profit, Trend Filter (to visually understand if the trend is bullish or bearish)
A potentially effective trading strategy could involve identifying buy and sell signals near the extreme price level lines drawn by the indicator. This approach can be used to try to improve the accuracy of your trading signals and make more informed decisions. For example:
When you receive a buy or sell signal based on the dojis and rectangles generated by the indicator, check whether the price is also near one of the extreme price level lines. If you are receiving a buy signal and notice that the current price is near a low of the lower level line, this may further confirm the buying opportunity, as the price is near a significant resistance level. On the contrary, if the sell signal was close to a maximum price level it could confirm an excellent short entry.
It is also possible to use the boxes as reference points to set the stop loss and take profit levels. If you are entering a buy position, you might consider setting your stop loss just below an upper line of the last box. Additionally, you may want to set your take profit near a higher price level if you are looking to maximize profits. This will help manage risks and protect your capital.

3kilos BTC 15mThe "3kilos BTC 15m" is a comprehensive trading strategy designed to work on a 15-minute timeframe for Bitcoin (BTC) or other cryptocurrencies. This strategy combines multiple indicators, including Triple Exponential Moving Averages (TEMA), Average True Range (ATR), and Heikin-Ashi candlesticks, to generate buy and sell signals. It also incorporates risk management features like take profit and stop loss.
Indicators
Triple Exponential Moving Averages (TEMA): Three TEMA lines are used with different lengths and sources:
Short TEMA (Red) based on highs
Long TEMA 1 (Blue) based on lows
Long TEMA 2 (Green) based on closing prices
Average True Range (ATR): Custom ATR calculation with EMA smoothing is used for volatility measurement.
Supertrend: Calculated using ATR and a multiplier to determine the trend direction.
Simple Moving Average (SMA): Applied to the short TEMA to smooth out its values.
Heikin-Ashi Close: Used for additional trend confirmation.
Entry & Exit Conditions
Long Entry: Triggered when the short TEMA is above both long TEMA lines, the Supertrend is bullish, the short TEMA is above its SMA, and the Heikin-Ashi close is higher than the previous close.
Short Entry: Triggered when the short TEMA is below both long TEMA lines, the Supertrend is bearish, the short TEMA is below its SMA, and the Heikin-Ashi close is lower than the previous close.
Take Profit and Stop Loss: Both are calculated as a percentage of the entry price, and they are set for both long and short positions.
Risk Management
Take Profit: Set at 1% above the entry price for long positions and 1% below for short positions.
Stop Loss: Set at 3% below the entry price for long positions and 3% above for short positions.
Commission and Pyramiding
Commission: A 0.07% commission is accounted for in the strategy.
Pyramiding: The strategy does not allow pyramiding.
Note
This strategy is designed for educational purposes and should not be considered as financial advice. Always do your own research and consider consulting a financial advisor before engaging in trading.

Bullish Divergence Short-term Long Trade FinderThis script is a Bullish divergence trade finder built to find small periods where Bitcoin will likely rise from. It looks for bullish divergence followed by a higher low as long as the hour RSI value is below the 40 mark, if then it will enter an long. It marks out Buy signals on the RSI if the value dips below 'RSI Bull Condition Minimum' (Default 40) on the current time frame in view. It also marks out Sell signals found when the RSI is above the 'RSI Bearish Condition Minimum' (Default 50). The sell signals are bearish divergence that has occurred recently on the RSI. When a long is in play it will sell if it finds bearish divergence or the time frame in view reaches RSI value higher than the 'RSI Sell Value'(Default 75). You can set your stop loss value with the 'Stop loss Percentage' (default 5).
Available inputs:
RSI Period: relative strength measurement length(Typically 14)
RSI Oversold Level: the bottom bar of the RSI (Typically 30)
RSI Overbought Level: the top bar of the RSI (Typically 70)
RSI Bearish Condition Minimum: The minimum value the script will use to look for a pivot high that starts the Bearish condition to Sell (Default 50)
RSI Bearish Condition Sell Min: the minimum value the script will accept a bearish condition (Default 60)
RSI Bull Condition Minimum: the minimum value it will consider a pivot low value in the RSI to find a divergence buy (Default 40)
Look Back this many candles: the amount of candles thee script will look back to find a low value in the RSI (Default 25)
RSI Sell Value: The RSI value of the exit condition for a long when value is reached (Default 75)
Stop loss Percentage: Percentage value for amount to lose (Default 5)
The formula to enter a long is stated below:
If price finds a lower low and there is a higher low found following a lower low and price has just made another dip and price closes lower than the last divergence and Relative strength index hour value is less than 40 enter a long.
The formula to exit a long is stated below:
If the value drops below the stop loss percentage OR (the RSI value is greater than the value of the parameter 'RSI Sell Value' or bearish divergence is found greater than the parameter 'RSI Bearish Condition Minimum' )
This script was built from much strategy testing on BTC but works with alts (occasionally) also. It is most successful to my knowledge using the 15 min and 7 min time frames with default values. Hope it helps! Follow for further possible updates to this script or other entry or exit strategies.
snapshot:
I only have a Pro trading view account so I cannot share a larger data set about this script because the buy signals happen pretty rarely. The most amount that I could find within a view for me was 40 trades within a viewable time. The suggested/default parameters that I have do not occur very often so it limits the data set. Adjustments can be made to the parameters so that trades can be entered more often. The scripts success is dependent on the values of the parameters set by the user. This script was written to be used for BTC/USD or BTC/USDT trading. I am unable to share a larger dataset without putting out results that are intended to fail or having a premium account so reaching the 100 trade minimum is not possible with my account.

Bar Color Long / Short Indicator With Advised SL Rev 1This is the Revised Version of Bar Color Long / Short Indicator With Advised SL with some extra features
Overview
This script is a trading indicator named "Bar Color Long / Short Indicator With Advised SL" designed for the TradingView platform. The indicator's primary purpose is to provide entry signals for long and short positions, based on various technical analysis methods. Additionally, the indicator suggests stop-loss levels for both long and short positions.
User Inputs
The indicator has several user inputs, such as:
Length
Smoothing
Multiplier
Show bar colors (ON/OFF)
When the bar colors are turned off, the alert signals for long and short positions will be displayed instead.
Custom Risk Calculation
The script calculates a custom risk level based on a modified version of the RSI (Relative Strength Index) formula. The custom risk level is divided into three categories: low, medium, and high.
Sentiment Score Calculation
The indicator calculates a sentiment score based on a combination of methods resembling EMA (Exponential Moving Average), MACD (Moving Average Convergence Divergence), and ROC (Rate of Change). The sentiment score is used to determine if the sentiment is positive or negative.
Bollinger Bands Percent and Combined Signal
The Bollinger Bands Percent is calculated, and the custom risk, sentiment score, and Bollinger Bands Percent are combined to generate a new signal. This signal is used in conjunction with EMA10 to determine the bar colors and provide entry signals.
Bar Colors
Based on the combined signal and EMA10, the script determines the bar colors as follows:
Orange: Positive sentiment
Blue: Negative sentiment
Gray: Neutral
Entry Signals and Alerts
When the bar colors are turned off, the indicator displays large green arrow signals for long (buy) positions and red arrow signals for short (sell) positions based on the sentiment and EMA10 conditions. The script also includes alert conditions for long and short signals, which can be used to set up notifications when these signals are triggered in the TradingView platform.
Advised Stop-Loss Levels
The indicator plots stop-loss lines for both long and short positions at the last candle, accompanied by labels showing the advised stop-loss levels in numeric values
Rev 1
added / changed :
SMA50 slope check
EMA20 higher or lower than EMA10
color ON/OFF changed
Signal once Buy and Sell