Harmonic Confluence Wave Detector [JOAT]Harmonic Confluence Wave Detector
Introduction
The Harmonic Confluence Wave Detector is an open-source oscillator-based indicator that combines WaveTrend, Money Flow Index (MFI), RSI, MACD, and Stochastic RSI into a unified momentum analysis system. This mashup creates a multi-layered oscillator framework designed to identify momentum shifts, overbought/oversold conditions, and divergence patterns across multiple timeframes and calculation methods.
The indicator addresses a common trading challenge: single oscillators can give conflicting or premature signals. By synthesizing five different momentum calculations that use distinct mathematical approaches, this tool provides confluence-based signals that occur when multiple momentum indicators align, significantly reducing false signals compared to using any single oscillator alone.
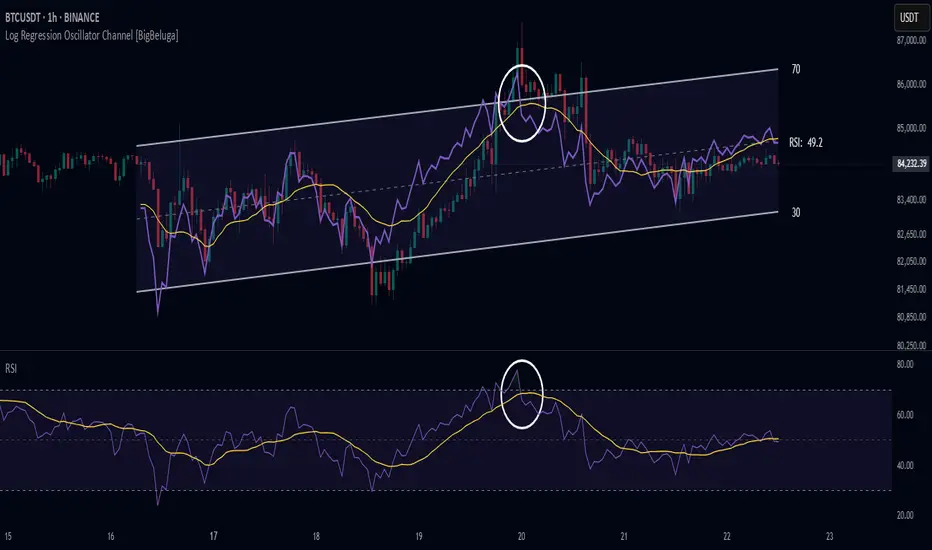
Chart showing WaveTrend oscillator, MACD histogram, and multi-signal system on 1H timeframe
Why This Mashup Exists
This indicator combines five oscillators that complement each other through different calculation methodologies:
WaveTrend: Smoothed momentum oscillator based on price deviation from exponential moving average
Money Flow Index (MFI): Volume-weighted RSI showing buying/selling pressure
RSI: Classic momentum oscillator measuring speed and magnitude of price changes
MACD: Trend-following momentum indicator showing relationship between two EMAs
Stochastic RSI: Stochastic calculation applied to RSI for enhanced sensitivity
Each oscillator has unique strengths: WaveTrend excels at identifying wave-like momentum cycles, MFI incorporates volume for institutional flow analysis, RSI provides reliable overbought/oversold readings, MACD shows trend strength and direction, and Stochastic RSI catches early momentum shifts. Together, they create a comprehensive momentum picture that no single oscillator can provide.
The mashup is justified because these oscillators use fundamentally different calculations (price-based, volume-weighted, moving average convergence, stochastic) that respond to different market conditions. When they align, it indicates genuine momentum shift rather than noise.
Core Components Explained
1. WaveTrend Oscillator (Primary Signal Generator)
WaveTrend is the primary oscillator, calculated using this methodology:
// Calculate exponential average of HLC3
esa = ta.ema(hlc3, channelLength)
// Calculate deviation
d = ta.ema(abs(hlc3 - esa), channelLength)
// Calculate channel index
ci = (hlc3 - esa) / (0.015 * d)
// Apply smoothing to create WaveTrend 1
wt1 = ta.ema(ci, averageLength)
// Create WaveTrend 2 as simple moving average of WT1
wt2 = ta.sma(wt1, 4)
WaveTrend oscillates around zero, with:
Values above +60: Overbought zone
Values above +80: Extreme overbought
Values below -60: Oversold zone
Values below -80: Extreme oversold
Crossovers between WT1 and WT2: Momentum shift signals
The indicator plots WT1 and WT2 as lines with dynamic coloring based on momentum direction and strength.
2. Money Flow Index (MFI) - Volume-Weighted Momentum
MFI calculation incorporates both price and volume:
// Calculate typical price
typicalPrice = (high + low + close) / 3
// Calculate raw money flow
rawMoneyFlow = typicalPrice * volume
// Separate positive and negative money flow
positiveFlow = close > close ? rawMoneyFlow : 0
negativeFlow = close < close ? rawMoneyFlow : 0
// Sum over MFI period
positiveSum = sum(positiveFlow, mfiLength)
negativeSum = sum(negativeFlow, mfiLength)
// Calculate MFI
mfi = 100 - (100 / (1 + positiveSum / negativeSum))
MFI ranges from 0-100, with readings above 80 indicating buying pressure and below 20 indicating selling pressure. The indicator plots MFI as a line and uses it for confluence scoring.
3. RSI - Classic Momentum Oscillator
Standard RSI calculation over 14 periods (configurable):
RSI > 70: Overbought
RSI < 30: Oversold
RSI > 65 with other bearish signals: Potential reversal
RSI < 35 with other bullish signals: Potential reversal
RSI provides reliable baseline momentum readings and is used for divergence detection.
4. MACD - Trend Momentum Indicator
MACD uses standard 12/26/9 settings:
= ta.macd(close, 12, 26, 9)
The indicator displays MACD histogram with enhanced width (linewidth 8) for visibility. Histogram color changes based on:
Green: Positive and increasing (bullish momentum)
Light green: Positive but decreasing (weakening bulls)
Red: Negative and decreasing (bearish momentum)
Light red: Negative but increasing (weakening bears)
MACD histogram provides visual confirmation of momentum strength and direction.
5. Stochastic RSI - Enhanced Sensitivity
Stochastic calculation applied to RSI values:
stochRSI = ta.stoch(rsi, rsi, rsi, 14)
Stochastic RSI oscillates between 0-100 and is more sensitive than regular RSI, catching momentum shifts earlier. The indicator plots both K and D lines for crossover analysis.
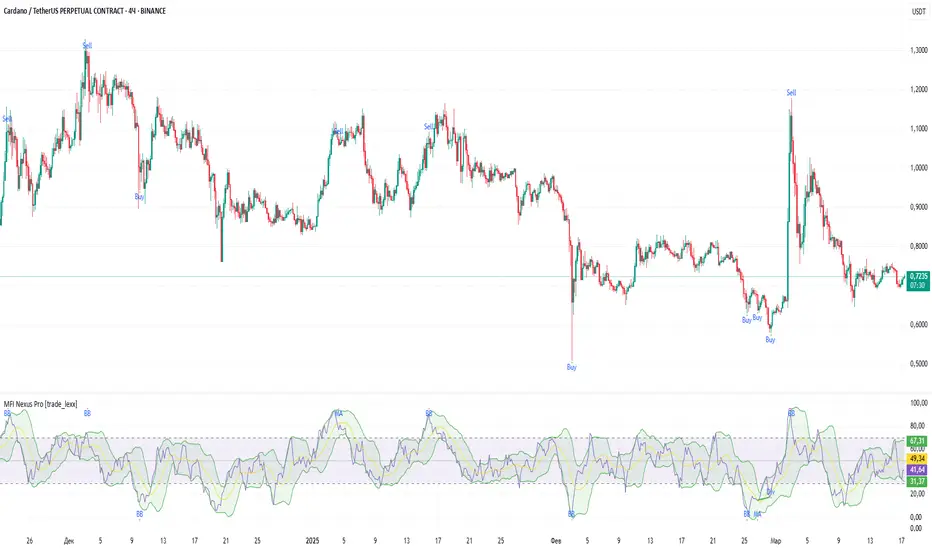
Example showing all oscillators with divergence markers and signal labels
Multi-Signal System
The indicator generates six tiers of signals based on confluence strength:
BUY Signals:
BUY: WT1 crosses above WT2 in oversold zone (WT1 < -40)
STRONG BUY: BUY + volume above average + MACD histogram positive
MEGA BUY: STRONG BUY + WT1 < -60 (extreme oversold) + RSI < 35
ULTRA BUY: MEGA BUY + MFI < 30 + Stoch RSI oversold + bullish divergence
SELL Signals:
SELL: WT1 crosses below WT2 in overbought zone (WT1 > 40)
STRONG SELL: SELL + volume above average + MACD histogram negative
MEGA SELL: STRONG SELL + WT1 > 60 (extreme overbought) + RSI > 65
ULTRA SELL: MEGA SELL + MFI > 70 + Stoch RSI overbought + bearish divergence
Signal labels appear on chart with size proportional to signal strength (tiny for BUY/SELL, normal for ULTRA).
Divergence Detection System
The indicator detects divergences across multiple oscillators:
RSI Divergence:
Bullish: Price makes lower low, RSI makes higher low
Bearish: Price makes higher high, RSI makes lower high
WaveTrend Divergence:
Bullish: Price makes lower low, WT1 makes higher low
Bearish: Price makes higher high, WT1 makes lower high
MACD Divergence:
Bullish: Price makes lower low, MACD histogram makes higher low
Bearish: Price makes higher high, MACD histogram makes lower high
Divergences are marked with bright orange/yellow "D" labels (color.rgb(255, 200, 0)) with black text for maximum visibility. When multiple oscillators show divergence simultaneously, it signals strong momentum exhaustion and potential reversal.
Confluence Scoring System
The indicator calculates a real-time confluence score (0-100) by evaluating:
Confluence Components:
- WaveTrend Position: Up to 25 points (extreme zones add more weight)
- WaveTrend Momentum: Up to 15 points (WT1-WT2 relationship)
- RSI Level: Up to 15 points (extreme readings add weight)
- MFI Level: Up to 15 points (volume pressure confirmation)
- MACD Histogram: Up to 15 points (trend momentum)
- Stochastic RSI: Up to 10 points (early momentum detection)
- Divergence Presence: Up to 5 points (any divergence detected)
The dashboard displays the current confluence score with color coding:
Green (80-100): Strong bullish confluence
Light green (60-79): Moderate bullish confluence
Yellow (40-59): Neutral/mixed signals
Light red (20-39): Moderate bearish confluence
Red (0-19): Strong bearish confluence
Visual Elements
WaveTrend Lines: WT1 (blue) and WT2 (orange) with dynamic coloring
Overbought/Oversold Zones: Horizontal lines at +60/-60 and +80/-80
Zero Line: Reference line at 0
MACD Histogram: Large bars (linewidth 8) with gradient coloring
MFI Line: Purple line showing volume-weighted momentum
RSI Line: Green line with overbought/oversold reference levels
Stochastic RSI: K (blue) and D (red) lines
Signal Labels: BUY/SELL markers with size based on signal strength
Divergence Labels: Bright orange "D" markers at divergence points
Dashboard: Top-right table showing confluence score and oscillator readings
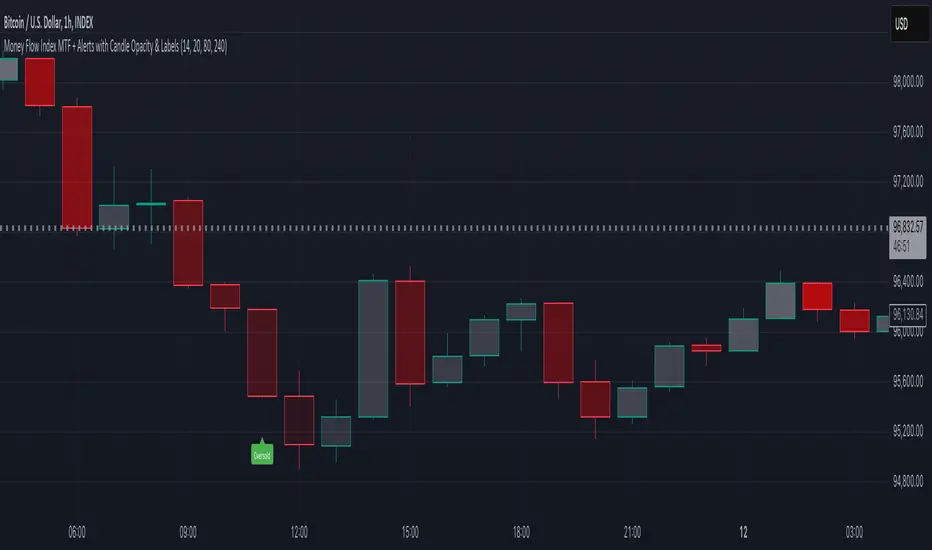
Chart demonstrating signal hierarchy from BUY to ULTRA BUY with divergence markers
How Components Work Together
The mashup creates a layered momentum analysis:
Layer 1 - Primary Momentum: WaveTrend identifies wave cycles and crossover signals
Layer 2 - Volume Confirmation: MFI validates moves with volume-weighted pressure
Layer 3 - Baseline Momentum: RSI provides reliable overbought/oversold context
Layer 4 - Trend Strength: MACD histogram shows underlying trend momentum
Layer 5 - Early Detection: Stochastic RSI catches momentum shifts before other oscillators
Layer 6 - Exhaustion Signals: Divergences across oscillators indicate momentum exhaustion
Example scenario: WT1 crosses above WT2 in oversold zone (Layer 1), MFI shows buying pressure increasing (Layer 2), RSI is below 35 (Layer 3), MACD histogram turns positive (Layer 4), Stochastic RSI crosses up (Layer 5), and RSI shows bullish divergence (Layer 6). This generates an ULTRA BUY signal with 90+ confluence score.
Input Parameters
WaveTrend Settings:
Channel Length: Period for EMA calculation (default: 10)
Average Length: Smoothing period for WT1 (default: 21)
Overbought Level: Upper threshold (default: 60)
Oversold Level: Lower threshold (default: -60)
Extreme OB Level: Extreme upper threshold (default: 80)
Extreme OS Level: Extreme lower threshold (default: -80)
Oscillator Settings:
RSI Length: Period for RSI calculation (default: 14)
MFI Length: Period for MFI calculation (default: 14)
MACD Fast: Fast EMA period (default: 12)
MACD Slow: Slow EMA period (default: 26)
MACD Signal: Signal line period (default: 9)
Stochastic RSI Length: Period for Stoch RSI (default: 14)
Signal Settings:
Show Signals: Toggle signal labels (default: enabled)
Show Divergences: Toggle divergence markers (default: enabled)
Volume Confirmation: Require volume for STRONG signals (default: enabled)
Min Confluence for Signals: Minimum score to display signals (default: 60)
Display Options:
Show Dashboard: Toggle confluence score table (default: enabled)
Show MACD Histogram: Toggle MACD display (default: enabled)
Show MFI Line: Toggle MFI display (default: enabled)
Show RSI Line: Toggle RSI display (default: enabled)
Show Stochastic RSI: Toggle Stoch RSI display (default: enabled)
Color Theme: Choose between multiple color schemes
How to Use This Indicator
Step 1: Monitor WaveTrend Oscillator
Watch for WT1/WT2 crossovers in extreme zones. Crossovers in oversold zone (< -60) suggest bullish reversals, crossovers in overbought zone (> 60) suggest bearish reversals.
Step 2: Check Confluence Score
Review the dashboard. Scores above 70 indicate strong momentum alignment. Higher scores generally produce more reliable signals.
Step 3: Identify Signal Strength
Pay attention to signal labels. ULTRA signals have highest probability but occur less frequently. STRONG signals offer good balance between frequency and reliability.
Step 4: Look for Divergences
Divergence markers indicate momentum exhaustion. When divergences appear with extreme oscillator readings, reversal probability increases significantly.
Step 5: Confirm with MACD Histogram
Check MACD histogram direction and strength. Large histogram bars confirm strong momentum, shrinking bars suggest momentum loss.
Step 6: Validate with Volume (MFI)
Ensure MFI supports the move. Bullish signals with rising MFI are stronger, bearish signals with falling MFI are stronger.
Best Practices
Use on 15-minute to 4-hour timeframes for optimal signal quality
Wait for STRONG or MEGA signals rather than acting on every BUY/SELL
Divergences work best when combined with extreme oscillator readings
Multiple oscillator divergences (RSI + WT + MACD) are most reliable
Use confluence score as filter - avoid signals below 60 score
MACD histogram size indicates momentum strength - larger bars = stronger moves
MFI divergence from price often precedes reversals (volume leads price)
Combine with price action and support/resistance for best results
Indicator Limitations
Oscillators can remain overbought/oversold longer than expected in strong trends
Divergences can persist for multiple bars before reversal occurs
Multiple signals in choppy markets can lead to whipsaws
Confluence score is mathematical calculation, not prediction of future movement
ULTRA signals are rare - waiting only for these may miss opportunities
Volume data quality varies across markets and can affect MFI reliability
Stochastic RSI is very sensitive and can generate premature signals
No indicator combination eliminates false signals entirely
Requires understanding of oscillator behavior for effective interpretation
Technical Implementation
Built with Pine Script v6 using:
Custom WaveTrend calculation with dual-line system
Proper MFI formula with volume-weighted money flow
Multi-oscillator divergence detection with pivot analysis
Confluence scoring algorithm with weighted components
Enhanced MACD histogram visualization (linewidth 8)
Dynamic color gradients for momentum visualization
Anti-overlap logic for signal labels
Real-time dashboard with oscillator readings
The code is fully open-source and can be modified to adjust oscillator weights, signal thresholds, and visual preferences.
Originality Statement
This indicator is original in its multi-oscillator integration approach. While individual components (WaveTrend, MFI, RSI, MACD, Stochastic RSI) are established oscillators, this mashup is justified because:
It combines five oscillators using fundamentally different calculation methods
The tiered signal system (BUY to ULTRA) provides graduated confidence levels
Multi-oscillator divergence detection catches momentum exhaustion across different timeframes
Confluence scoring quantifies momentum alignment across all oscillators
Volume integration through MFI adds institutional flow perspective
Enhanced visualization (large MACD histogram, bright divergence markers) improves usability
Each oscillator contributes unique information: WaveTrend provides wave-cycle analysis, MFI incorporates volume, RSI offers reliable baseline, MACD shows trend strength, and Stochastic RSI catches early shifts. The mashup's value lies in identifying when these different momentum calculations align, significantly reducing false signals compared to any single oscillator.
Disclaimer
This indicator is provided for educational and informational purposes only. It is not financial advice or a recommendation to buy or sell any financial instrument. Trading involves substantial risk of loss and is not suitable for all investors.
Oscillator-based indicators are lagging tools that analyze past price data. They do not predict future price movement. Overbought conditions can persist in strong uptrends, and oversold conditions can persist in strong downtrends. Divergences can continue for extended periods before reversals occur.
The confluence score is a mathematical calculation, not a guarantee of trade success. High confluence scores do not ensure profitable trades. Past signal performance does not guarantee future results. Market conditions change, and oscillator behavior varies across different market regimes.
Always use proper risk management, including stop losses and position sizing appropriate for your account size and risk tolerance. Never risk more than you can afford to lose. Consider consulting with a qualified financial advisor before making investment decisions.
The author is not responsible for any losses incurred from using this indicator. Users assume full responsibility for all trading decisions made using this tool.
-Made with passion by officialjackofalltrades
Pine Script® indicator