Multi-Timeframe Trend Analysis [BigBeluga]Multi-Timeframe Trend Analysis
A powerful trend-following dashboard designed to help traders monitor and compare trend direction across multiple higher timeframes. By analyzing EMA conditions from five customizable timeframes, this tool gives a clear visual breakdown of short- to long-term trend alignment.
🔵Key Features:
Multi-Timeframe EMA Dashboard:
➣ Displays a table in the top-right corner showing trend direction across 5 user-defined timeframes.
➣ Each row shows whether ema is rising or falling its corresponding EMA for that timeframe.
➣ Green arrows (🢁) indicate uptrends, purple arrows (🢃) signal downtrends.
Custom Timeframe Selection:
➣ Traders can input any 5 timeframes (e.g., 1h, 2h, 3h, etc.) with individual EMA lengths for flexible trend mapping.
➣ The tool auto-adjusts to match and align external timeframe EMAs to the current chart for seamless overlay.
Dynamic Chart Arrows:
➣ On-chart arrows mark when EMA rising or falling EMAs from the current chart timeframe.
➣ Each EMA arrows has a unique transparency level—shorter EMA arrows are more transparent, longer EMA arrows are more vivid. (Hover Mouse over the arrow to see which EMAs it is)
Gradient EMA Plotting:
➣ All five EMAs are plotted with gradually increasing opacity.
➣ Gradient fills between EMAs enhance visual structure, making it easier to track convergence/divergence.
🔵Usage:
Trend Confirmation: Use the dashboard to confirm multi-timeframe trend alignment before entering trades.
Entry Filtering: Avoid countertrend trades by spotting when higher timeframes disagree with the current one.
Momentum Insight: Track the transition of arrows from lighter to stronger opacity to visualize trend shifts over time.
Scalping or Swinging: Customize timeframes depending on your strategy—from intraday scalps to longer-term swings.
Multi-Timeframe Trend Analysis is the ultimate visual companion for traders who want clarity on how price behaves across multiple time horizons. With its smart EMA mapping and dashboard feedback, it keeps you aligned with dominant trend directions and transition zones at all times.
Multitimeframeanalysis

Open Vertical Lines [TradeWithRon]This indicator allows traders to draw vertical lines manually or automatically based on the current or specified higher timeframes. It is a versatile tool designed to help users identify and mark significant changes in the market, such as new candle formations, based on a selected or auto-adjusted timeframe.
Open Source
Features:
Timeframe Customization: Users can either manually specify a desired timeframe (e.g., 1-hour, 1-day, etc.) or enable the "Auto" feature, which automatically adjusts the timeframe based on the current chart's timeframe for better alignment with different trading strategies.
Customizable Line Style: The vertical line can be drawn in three different styles: Solid, Dashed, or Dotted, giving users the flexibility to choose their preferred appearance for better chart readability.
Line Color: Users can select the color of the vertical line with transparency options to match their chart's visual preferences.
Auto Timeframe Adjustments: The "Auto Align" option dynamically adjusts the timeframe used for vertical lines depending on the chart's current timeframe. For example, if you’re using a lower timeframe (e.g., 5 minutes), the indicator will automatically switch to a higher timeframe (e.g., 1 hour or daily) to mark vertical lines, ensuring the lines correspond to higher timeframe price action.
Vertical Line Placement:
A vertical line is placed each time a new candle appears on the chart, marking key moments for the user to analyze market movements. This can be helpful for marking the start of new trading sessions or significant events in the market.
How to Use:
1. Apply the indicator to your chart.
2. Configure the preferred timeframe settings (either fixed or auto-align).
3. Customize the line style and color according to your visual preference.
4. The indicator will automatically place vertical lines on the chart when a new candle is formed, based on your selected timeframe.

ICT Breakers (BOS / MSS - Market Structure) [ICTProTools]The Breakers (Market Structure) indicator is designed to help traders identify true breaker structures , a key concept in Inner Circle Trader (ICT) methodology. In market structure, Breakers represent powerful shifts where a key high or low is broken, leading to a reversal in market direction. Most tools misinterpret structure shifts, using internal structure , leading to fake breakouts. This tool solves that problem by filtering out false signals , providing clear & structured insights , all with multi-timeframe compatibility.
💎 Key Features
⚡️ Breakers in action
The indicator shows the structure following ICT instructions. A breaker is defined by two lines:
The first line confirms the previous trend (it could be interpreted as a BOS).
The second line highlights the moment price breaks structure (with candle body or wick based on your chosen settings), signaling a shift in trend direction (like an MSS).
Furthermore, it’s important to note that a breaker not only shows the structure, but also defines a potential Point of Interest (POI), an area where price may retrace before continuing its trend.
Here, we can observe two clear structure shifts.
On the far left, the market was in a bearish trend, illustrated by the first visible (dotted and red) line. Shortly after, the second (solid and green) line appears, showing a break that initiates a new bullish trend.
This upward movement continues, with the last confirmation marked by a top structure line. And finally, the structure is broken once again indicating a transition back into a bearish trend.
💪 Real Structure with True Highs / Lows
Unlike many indicators that detect internal breakouts , this tool follows ICT’s true market structure rules .
In a bearish trend , a bullish breaker is only confirmed when the high that created the low is broken , and conversely for a bullish scenario.
Fake breakouts are ignored, preventing misleading signals.
In the image above, the white breakout is correctly ignored by the indicator, as it doesn't align with ICT’s structural rules. That white high is simply part of the internal structure, not the true swing point. Instead, the green line highlights the key level that truly matters, the one whose rupture would have confirmed a real change in market structure.
🔔 Smart Alerts for Structure Updates
Stay one step ahead with customizable alerts designed to notify you instantly when market structure changes occur.
Get notified for BOS (Continuation) and / or MSS (Breaker) events.
Set alerts for bullish , bearish , or both directions.
Choose between once or repeated alerts , based on your strategy.
This feature allows traders to remain focused and reactive , even when monitoring multiple markets.
In the alert settings, select which structure shifts you want to be notified of. Whether you're a scalper or a swing trader, the alerts keep you connected to key moments without needing to constantly monitor the chart.
⏳ Multi-Timeframe Structure
All features of the indicator are fully compatible with higher timeframes .
Get a broader view of market structure without switching timeframes.
Monitor higher timeframe structures and receive alerts, all without leaving your analysis chart .
In this example, the market structure of the 30m timeframe is displayed while on a 5m chart, providing a clearer perspective.
✨ Customization & User Control
Make it yours! The indicator allows full customization:
Swing bars (to confirm high / low)
Select your mode for Breakers (MSS) , using the candle body only or body / wick
Line style (type, width, color)
Choice of displayed timeframe
Activate any alert , with the frequency you want
🎯 Conclusion
✅ Avoid false signals by focusing on true ICT Breakers
✅ Smart alerts to never miss a structural shift
✅ Multi-timeframe support for enhanced analysis
✅ Clean & professional design for an optimal trading experience

Air Gap MTF with alert settingsWhat it shows:
This indicator will show a horizontal line at a price where each EMAs are on on different time frames, which will remove the effort of having to flick through different time frames or look at different chart.
The lines itself will move in real time as price moves and therefore as the EMA values changes so no need to manually adjustment the lines.
How to use it:
The price gap between each of the lines are known as "air gaps", which are essentially zones price can move with less resistance. Therefore bigger the airgap there is more likely more movement in price.
In other words, where lines are can be a resistance (or support) and can expect price stagnation or rejection.
On the chart it is clear to see lines are acting as resistances/supports.
Key settings:
The time frame are fixed to: 30min, 1hr and 4hr. This cannot be changed as of now.
EMA values for each time frame are user changeable in the settings, and up to 4 different values can be chosen for each time frame. Default is 5,12,34 and 50 for each timeframe.
Line colour, thickness and style can be user adjusted. Start point for where line will be drawn can be changed in the settings, either: start of day, user defined start or across the chart. In case of user defined scenario user can input a number that specifies a offset from current candle.
Label colour, font, alignment, text size and text itself can be user adjusted in the settings. Price can be also displayed if user chooses to do so. Position of label (offset from current candle) is user specified and can be adjusted by the user.
Both the lines and labels can be turned off (both and individually), for each lines.
Alert Settings:
Manually, user can set alerts for when price crosses a specific line.
This can be done by:
right click on any of line
choose first option (add alert on...)
On the second option under condition, use the dropdown menu to choose the desired EMA/timeframe to set alert for.
Hit "create" at bottom right of option
----------------------------------------------------------------------
If anything is not clear please let me know!

Multi-Timeframe PSAR Indicator ver 1.0Enhance your trend analysis with the Multi-Timeframe Parabolic SAR (MTF PSAR) indicator! This powerful tool displays the Parabolic SAR (Stop and Reverse) from both the current chart's timeframe and a higher timeframe, all in one convenient view. Identify potential trend reversals and set dynamic trailing stops with greater confidence by understanding the broader market context.
Key Features:
Dual Timeframe Analysis: Simultaneously visualize the PSAR on your current chart and a user-defined higher timeframe (e.g., see the Daily PSAR while trading on the 1-hour chart). This helps you align your trades with the dominant trend.
Customizable PSAR Settings: Fine-tune the PSAR calculation with adjustable Start, Increment, and Maximum values. Optimize the indicator's sensitivity to match your trading style and the volatility of the asset.
Independent Timeframe Control: Choose to display either or both the current timeframe PSAR and the higher timeframe PSAR. Focus on the information most relevant to your analysis.
Clear Visual Representation: Distinct colors for the current and higher timeframe PSAR dots make it easy to differentiate between the two. Quickly identify potential entry and exit points.
Configurable Colors You can easily change colors of Current and HTF PSAR.
Standard PSAR Logic: Uses the classic Parabolic SAR algorithm, providing a reliable and widely-understood trend-following indicator.
lookahead=barmerge.lookahead_off used in the security function, there is no data leak or repainting.
Benefits:
Improved Trend Identification: Spot potential trend changes earlier by observing divergences between the current and higher timeframe PSAR.
Enhanced Risk Management: Use the PSAR as a dynamic trailing stop-loss to protect profits and limit potential losses.
Greater Trading Confidence: Make more informed decisions by considering the broader market trend.
Reduced Chart Clutter: Avoid the need to switch between multiple charts to analyze different timeframes.
Versatile Application: Suitable for various trading styles (swing trading, day trading, trend following) and markets (stocks, forex, crypto, etc.).
How to Use:
Add to Chart: Add the "Multi-Timeframe PSAR" indicator to your TradingView chart.
Configure Settings:
PSAR Settings: Adjust the Start, Increment, and Maximum values to control the PSAR's sensitivity.
Multi-Timeframe Settings: Select the desired "Higher Timeframe PSAR" resolution (e.g., "D" for Daily). Enable or disable the display of the current and/or higher timeframe PSAR using the checkboxes.
Interpret Signals:
Current Timeframe PSAR: Dots below the price suggest an uptrend; dots above the price suggest a downtrend.
Higher Timeframe PSAR: Provides context for the overall trend. Agreement between the current and higher timeframe PSAR strengthens the trend signal. Divergences may indicate potential reversals.
Trade Management:
Use PSAR dots as dynamic trailing stop.
Example Use Cases:
Confirming Trend Strength: A trader on a 1-hour chart sees the 1-hour PSAR flip bullish (dots below the price). They check the MTF PSAR and see that the Daily PSAR is also bullish, confirming the strength of the uptrend.
Identifying Potential Reversals: A trader sees the current timeframe PSAR flip bearish, but the higher timeframe PSAR remains bullish. This divergence could signal a potential pullback within a larger uptrend, or a warning of a more significant reversal.
Trailing Stops: A trader enters a long position and uses the current timeframe PSAR as a trailing stop, moving their stop-loss up as the PSAR dots rise.
Disclaimer: The Parabolic SAR is a lagging indicator and may produce false signals, especially in ranging markets. It is recommended to use this indicator in conjunction with other technical analysis tools and risk management strategies. Past performance is not indicative of future results.

Multi-Timeframe VWAP Master ProThe Multi-Timeframe VWAP Suite is a comprehensive and highly customizable indicator designed for traders who rely on Volume-Weighted Average Price (VWAP) across multiple timeframes and periods. This tool provides a complete suite of VWAP calculations, including daily, weekly, monthly, quarterly, yearly, and custom VWAPs, allowing traders to analyze price action and volume trends with precision. Whether you're a day trader, swing trader, or long-term investor, this indicator offers unparalleled flexibility and depth for your trading strategy.
Multi-Timeframe VWAPs:
Daily, Weekly, Monthly, Quarterly, and Yearly VWAPs: Track VWAP across various timeframes to identify key support and resistance levels.
Customizable Timeframes: Use the SMA timeframe input to adjust the period for moving averages and other calculations.
Previous Period VWAPs:
Previous Daily, Weekly, Monthly, and Quarterly VWAPs: Analyze historical VWAP levels to understand past price behavior and identify potential reversal zones.
Previous Year Quarterly VWAPs: Compare current price action to VWAP levels from specific quarters of the previous year.
Custom VWAPs:
Custom Start Date and Timeframe: Define your own VWAP periods by specifying a start date and timeframe, allowing for tailored analysis.
Dynamic Custom VWAP Calculation: Automatically calculates VWAP based on your custom inputs, ensuring flexibility for unique trading strategies.
Seasonal and Yearly VWAPs:
April, July, and October VWAPs: Analyze seasonal trends by tracking VWAP levels for specific months.
Yearly VWAP: Get a broader perspective on long-term price trends with the yearly VWAP.
SMA Integration:
SMA Overlay: Combine VWAP analysis with a Simple Moving Average (SMA) for additional confirmation of trends and reversals.
Customizable SMA Length and Timeframe: Adjust the SMA settings to match your trading style and preferences.
User-Friendly Customization:
Toggle Visibility and Labels: Easily enable or disable the display of specific VWAPs and their labels to keep your chart clean and focused.
Color Customization: Each VWAP line and label is color-coded for easy identification and can be customized to suit your preferences.
Dynamic Labeling:
Automatic Labels: Labels are dynamically placed on the last bar, providing clear and concise information about each VWAP level.
Customizable Label Text: Labels include detailed information, such as the timeframe or custom period, for quick reference.
Flexible Timeframe Detection:
Automatic Timeframe Detection: The indicator automatically detects new days, weeks, months, and quarters, ensuring accurate VWAP calculations.
Support for Intraday and Higher Timeframes: Works seamlessly on all chart timeframes, from 1-minute to monthly charts.
Previous Year Quarterly VWAPs:
Q1, Q2, Q3, Q4 VWAPs: Compare current price action to VWAP levels from specific quarters of the previous year.
User-Selectable Year: Choose the year for which you want to calculate previous quarterly VWAPs.
Persistent Monthly VWAPs:
Option to Persist Monthly VWAPs Year-Round: Keep monthly VWAP levels visible even after the month ends for ongoing analysis.
Comprehensive Analysis: Combines multiple VWAP timeframes and periods into a single tool, eliminating the need for multiple indicators.
Customizable and Flexible: Tailor the indicator to your specific trading strategy with customizable timeframes, periods, and settings.
Enhanced Decision-Making: Gain deeper insights into price action and volume trends across different timeframes, helping you make more informed trading decisions.
Clean and Organized Charts: Toggle visibility and labels to keep your chart clutter-free while still accessing all the information you need.
Ideal For:
Day Traders: Use daily and intraday VWAPs to identify intraday support and resistance levels.
Swing Traders: Analyze weekly and monthly VWAPs to spot medium-term trends and reversals.
Long-Term Investors: Leverage quarterly and yearly VWAPs to understand long-term price behavior and key levels.
Seasonal Traders: Track April, July, and October VWAPs to capitalize on seasonal trends.
The Multi-Timeframe VWAP Suite is a powerful and versatile tool for traders of all styles and timeframes. With its comprehensive suite of VWAP calculations, customizable settings, and user-friendly design, it provides everything you need to analyze price action and volume trends with precision and confidence. Whether you're looking to fine-tune your intraday strategy or gain a broader perspective on long-term trends, this indicator has you covered.

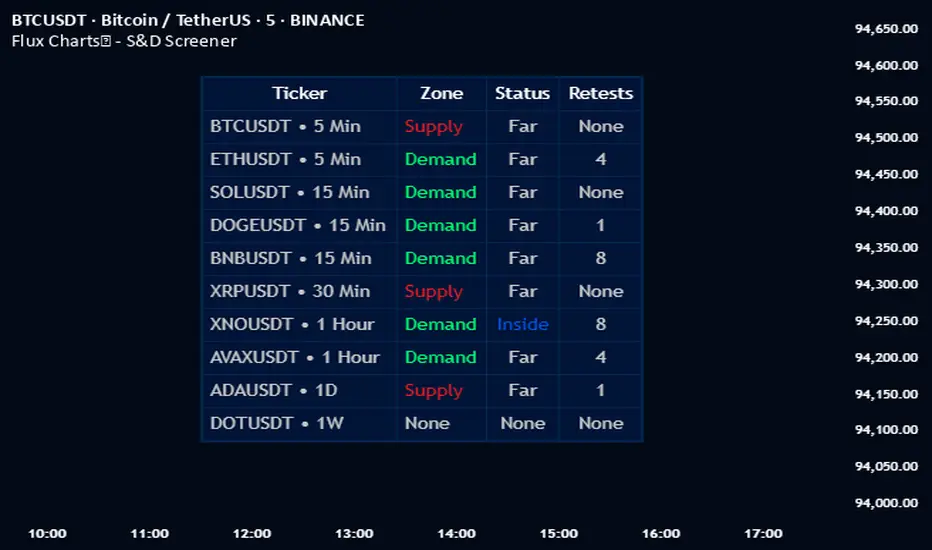
Flux Charts - S&D Screener💎 GENERAL OVERVIEW
Introducing Supply & Demand Zones (S&D) Screener! This screener can spot trading opportunities for Supply & Demand traders across 8 different tickers and timeframes simultaneously! This screener offers a wide range of configurable settings, explained within this write-up.
S&D Screener Features:
Supply & Demand Zones : This tool can detect Supply & Demand zones using one of the two detection methods.
Highly Configurable : Offers multiple parameters for fine-tuning detection settings.
Up to 8 Tickers : Allows traders to analyze multiple tickers & timeframes simultaneously for enhanced accuracy.
🚩 UNIQUENESS
The S&D Screener is the first ever tool on TradingView that allows traders to screen 8 different tickers on different timeframes for Supply & Demand Zones. Key factors that make it unique include:
✅ Comprehensive Dashboard – This screener provides a complete and customizable dashboard designed to enhance traders' decision-making by consolidating crucial Supply & Demand insights into one user-friendly interface.
✅ Multi-Ticker & Multi-Timeframe Analysis – With support for up to 8 tickers and timeframes, traders can effortlessly analyze the bigger market picture, identifying trends and opportunities across different assets and timeframes.
By combining multiple analytical elements in a single view, this screener empowers traders with the insights needed to navigate the market more effectively.
📌 HOW DOES IT WORK ?
The S&D Screener helps traders identify Supply & Demand Zones on multiple tickers & timeframes. It offers customizable settings to adapt to different trading styles. The screener includes two zone detection methods. The Momentum Method identifies zones based on strong bullish or bearish price movements, making it ideal for traders who seek quick market reactions. The Regression Method uses statistical regression to detect zones by analyzing price deviations from the trend, which is more suitable for long-term traders. You can customize your zone preferences and enable up to 8 tickers and their respective timeframes. You'll be able to see the status of the latest detected zones on that ticker/timeframe. You can also see the distance from current price of the ticker to the zone and how many times price has retested that zone.
Supply Zone
In trading, a supply zone is a specific area on a price chart where selling interest surpasses buying interest, leading to a potential decline in asset prices. This zone typically forms after a price rally, indicating that sellers find the asset overvalued and are prepared to sell, creating downward pressure. Identifying supply zones can help traders anticipate potential price reversals or pullbacks.
Trading Possibilities with Supply Zones
Entering Short Positions -> When the price approaches a recognized supply zone, traders may consider initiating short positions, anticipating that increased selling pressure will drive prices down.
Setting Profit Targets -> For traders holding long positions, supply zones can serve as strategic points to set profit targets, as these areas may signal potential resistance and a subsequent price drop.
Demand Zone
In trading, a demand zone is a specific area on a price chart where buying interest is strong enough to halt a downtrend and potentially reverse it upward. This zone indicates a price level where demand exceeds supply, leading to a rise in price. Identifying these zones can provide traders with strategic entry points for potential long positions.
Trading Possibilities with Demand Zones
Entering Long Positions -> When the price approaches a recognized demand zone, traders may consider initiating long positions, anticipating that increased buying pressure will drive prices up.
Setting Profit Targets -> For traders holding short positions, demand zones can serve as strategic points to set profit targets, as these areas may signal potential resistance and a subsequent price increase.
Momentum Detection Method
The Momentum Detection Method identifies supply and demand zones by analyzing the strength and direction of price movements over a specified period. It looks for a sequence of strong bullish or bearish candles to determine potential zones. The method is sensitive to the ‘Sensitivity’ setting, which adjusts the threshold for what constitutes a "strong" candle.
Using the momentum method is ideal for traders looking to capitalize on immediate price reactions and momentum shifts.
Regression Detection Method
The Regression Method uses statistical regression to identify supply and demand zones by analyzing price consolidation patterns. It fits a regression line to price data and identifies zones where price deviates significantly from the trend. This method is more mathematical and less reliant on individual candle patterns. It focuses on the overall price structure and identifies zones based on statistical deviations from the trend.
This method is particularly useful for traders who focus on longer-term price trends and prefer a more statistical approach to pinpoint zones.
Using the momentum method is ideal for traders looking to capitalize on immediate price reactions and momentum shifts.
Status ->
Far -> This status indicates that the current price is significantly distant from any identified supply or demand zones. In this scenario, traders might exercise patience, waiting for the price to approach these zones before considering entry or exit points.
Approaching ⬆️ -> The price is rising towards a supply zone, suggesting potential selling opportunities as the price nears an area where selling pressure previously dominated.
Approaching ⬇️ -> The price is falling towards a demand zone, indicating potential buying opportunities as the price approaches an area known for strong buying interest.
Inside -> The current price is within the boundaries of a supply or demand zone. This status often signals a critical decision point:
Inside a Supply Zone: The area where selling pressure may increase, potentially leading to a price decline. Traders might look for confirmation before initiating short positions.
Inside a Demand Zone: The area where buying interest could surge, possibly resulting in a price increase. Traders might seek validation before entering long positions.
Being "inside" a zone suggests heightened market activity and potential volatility, warranting close monitoring for trading signals.
Retests -> A retest occurs when the price revisits a supply or demand zone but fails to break through it. Specifically, during a retest, the wick of a candlestick enters the zone, but the candle closes below the supply zone or above the demand zone. This price action suggests that the zone remains a strong area of resistance or support, as the market couldn't sustain movement beyond it. Traders often view such retests as confirmations to enter positions in the direction opposite to the zone's boundary. For instance, if the price retests a supply zone and fails to close above it, it may signal a selling opportunity. Conversely, a failed retest of a demand zone could indicate a buying opportunity. Monitoring the number of retests can provide insights into the strength of these zones; multiple retests without a breakout may reinforce the zone's significance. Here you can see how many times the price retested the supply or demand zone.
⚠ Timeframe Restriction : The selected timeframes for analysis cannot be lower than the chart’s current timeframe to ensure proper data alignment.
⏰ ALERTS
This screener supports alerts, so you never miss a key market move. You can choose to receive alerts when a new demand or supply zone is created, helping you spot potential trading opportunities. Additionally, you can enable alerts for retests, which notify you when the price returns to test a previously identified zone. The alerts will work for each enabled ticker in the settings.
⚙️ SETTINGS
1. General Configuration
Detection Method : There are two detection methods you can choose from for identifying Supply & Demand Zones. Both methods aim to identify key areas where price is likely to react, but they do so using different approaches. Traders can choose the method that aligns with their trading style and time horizon.
Sensitivity : The Sensitivity setting allows traders to adjust how aggressively the script identifies supply and demand zones when using the Momentum Detection Method. This setting directly impacts the threshold for detecting zones when using the momentum detection method.
High Sensitivity -> Detects smaller price movements, resulting in more zones being identified. This is ideal for traders who want to capture even minor supply and demand imbalances and prefer a higher frequency of potential trading opportunities.
Medium Sensitivity -> Balances between detecting significant price movements and avoiding excessive noise. This setting is suitable for most traders who want a moderate number of zones without being overwhelmed.
Low Sensitivity -> Focuses on larger, more significant price movements, resulting in fewer zones being identified. This is ideal for traders who prioritize quality over quantity and prefer to focus on the most impactful supply and demand areas.
Lowest Sensitivity -> Detects only the strongest and most pronounced price movements, identifying the most significant zones. This setting is best for traders who want to focus on high-probability, high-impact zones and avoid minor fluctuations.
Zone Invalidation : The Zone Invalidation setting determines how supply and demand zones are invalidated.
Wick -> A zone is invalidated if a candle’s wick goes below a demand zone or above a supply zone.
Close -> A zone is invalidated if a candle closes below a demand zone or above a supply zone.
Zone Visibility Range : The Zone Visibility Range setting controls how far from the current price supply and demand zones are displayed on the chart. It helps traders focus on relevant zones while avoiding clutter from distant or less impactful areas.
Minimum Zone Width : The Minimum Zone Width setting defines the smallest size a supply or demand zone must have to be displayed on the chart. It uses the Average True Range (ATR) as a reference to ensure zones are proportionate to current market volatility.
Minimum Zone Length : The Minimum Zone Length setting determines the minimum number of bars a supply or demand zone must span to be displayed on the chart. This setting helps filter out short-lived or insignificant zones, ensuring only meaningful areas of supply or demand are highlighted.
2. Tickers
You can set, then enable or disable up to 8 tickers in this section to get informed about their latest supply or demand zone.
MACD Histogram Color Tabledisplaying the MACD Histogram color and divergences across multiple timeframes. Here's how it works step by step:
1. Setting the Table Position
The script allows the user to choose where the table will be placed using the positionOption input. The three options are:
Top Right
Top Left
Top Center
Depending on the selected option, the table is created at the corresponding position.
2. Creating the Table
A table (macdTable) is created with 8 columns (for different timeframes) and 3 rows (for different data points).
3. MACD Histogram Color Function (f_get_macd_color)
This function calculates the MACD line, signal line, and histogram for a given timeframe.
The histogram (histLine) is used to determine the cell background color:
Green if the histogram is positive.
Red if the histogram is negative.
4. Divergence Detection Function (f_detect_divergence)
This function looks for bullish and bearish divergences using the MACD histogram:
Bullish Divergence (🟢)
The price makes a lower low.
The MACD histogram makes a higher low.
Bearish Divergence (🔴)
The price makes a higher high.
The MACD histogram makes a lower high.
The function returns:
🟢 (green circle) for bullish divergence.
🔴 (red circle) for bearish divergence.
"" (empty string) if no divergence is detected.
5. Populating the Table
The table has three rows for each timeframe:
First row: Displays the timeframe labels (5m, 15m, 30m, etc.).
Second row: Shows MACD Histogram color (red/green).
Third row: Displays divergences (🟢/🔴).
This is done using table.cell() for each timeframe.
6. Final Result
A table is displayed on the chart.
Each column represents a different timeframe.
The color-coded row shows the MACD histogram status.
The bottom row shows detected divergences.

Power Trend [MacAlgo]Description:
The Power Trend Indicator is a sophisticated technical analysis tool that overlays on your trading charts to identify prevailing market trends. It utilizes a combination of ATR-based trend calculations, moving averages, volume analysis, and momentum indicators to generate reliable buy and sell signals. Additionally, it offers customizable settings to adapt to various trading styles and timeframes.
Key Features:
Adaptive ATR Calculation: Automatically adjusts the ATR (Average True Range) period and multiplier based on the selected timeframe for more accurate trend detection.
Dynamic Trend Lines: Plots continuous trend lines with color-coded bars to visually represent bullish and bearish trends.
Buy/Sell Signals: Generates standard and power buy/sell signals to help you make informed trading decisions.
Volume Analysis: Incorporates average buy and sell volumes to identify strong market movements.
Multiple Timeframe Support: Automatically adjusts the indicator's timeframe or allows for manual selection to suit your trading preferences.
Highlighting: Highlights trending bars for easy visualization of market conditions.
Alerts: Customizable alert conditions to notify you of potential trading opportunities in real-time.
How it Works:
1. ATR-Based Trend Calculation:
ATR Period & Multiplier: Calculates ATR based on user-defined periods and multipliers, dynamically adjusting according to the chart's timeframe.
Trend Determination: Identifies trends as bullish (1) or bearish (-1) based on price movements relative to ATR-based upper (up) and lower (dn) trend lines.
2. Moving Averages:
EMA & SMA: Calculates exponential and simple moving averages to smooth price data and identify underlying trends.
AlphaTrend Line: Combines a 50-period EMA and a 30-period SMA on a 4-hour timeframe to create the AlphaTrend line, providing a robust trend reference.
3. Volume Analysis:
Buy/Sell Volume: Differentiates between buy and sell volumes to gauge market strength.
Average Volume: Compares current volume against average buy/sell volumes to detect significant market movements.
4. Momentum Indicators:
RSI, MACD, OBV: Incorporates Relative Strength Index (RSI), Moving Average Convergence Divergence (MACD), and On-Balance Volume (OBV) to assess momentum and confirm trend strength.
5. Signal Generation:
Standard Signals: Basic buy and sell signals based on trend crossovers.
Power Signals: Enhanced signals requiring multiple conditions (e.g., increased volume, momentum confirmation) for higher confidence trades.
Customization Options:
Tailor the Power Trend Indicator to your specific trading needs with the following settings:
ATR Period: Set the period for ATR calculation (default: 8).
ATR Multiplier: Adjust the ATR multiplier to fine-tune trend sensitivity (default: 3.0).
Source: Choose the price source (e.g., HL2, Close) for calculations.
Change ATR Calculation Method: Toggle between different ATR calculation methods.
Show Buy/Sell Signals: Enable or disable the display of buy and sell signals on the chart.
Highlighting: Turn on or off the bar highlighting feature.
Timeframe Adjustment: Choose between automatic timeframe adjustment or manually set
the indicator's timeframe.
Manual Indicator Timeframe: If manual adjustment is selected, specify the desired timeframe (default: 60 minutes).
Visual Components:
Trend Lines: Continuous lines representing the current trend, color-coded for easy identification (green for bullish, red for bearish, orange for neutral).
Bar Coloring: Bars are colored based on the current trend and its relationship to the AlphaTrend line.
Buy/Sell Triangles: Triangular markers appear on the chart to indicate buy and sell signals.
Power Signals: Larger triangles highlight strong buy and sell opportunities based on multiple confirming factors.
Highlighting: Transparent overlays highlight trending areas to enhance visual clarity.
Alerts:
Stay informed with customizable alerts that notify you of important market movements:
SuperTrend Buy/Sell: Alerts when standard buy or sell signals are generated.
Power Buy/Sell Alerts: Notifications for strong buy or sell signals based on comprehensive conditions.
Trend Direction Change: Alerts when the trend changes from bullish to bearish or vice versa.
How to Use:
Add to Chart: Apply the Power Trend Indicator to your preferred trading chart on TradingView.
Configure Settings: Adjust the input parameters to match your trading style and the timeframe you are analyzing.
Analyze Trends: Observe the trend lines, bar colors, and AlphaTrend line to understand the current market trend.
Follow Signals: Look for buy and sell signals or power signals to identify potential entry and exit points.
Set Alerts: Enable alerts to receive real-time notifications of significant trading opportunities.
Adjust as Needed: Fine-tune the settings based on market conditions and your trading experience.
Important Notes:
Backtesting: While the Power Trend Indicator is built using robust technical analysis principles, it's essential to backtest and validate its performance within your trading strategy.
Market Conditions: The indicator performs best in trending markets. In sideways or highly volatile markets, signal reliability may vary.
Risk Management: Always employ proper risk management techniques when trading based on indicator signals to protect your capital.
Disclaimer:
This indicator is intended for educational purposes only and does not provide financial advice or guarantee future performance. Trading involves risk, and past results are not indicative of future outcomes. Always conduct your own analysis and risk management.

Multi-Timeframe Confluence IndicatorThe Multi-Timeframe Confluence Indicator strategically combines multiple timeframes with technical tools like EMA and RSI to provide robust, high-probability trading signals. This combination is grounded in the principles of technical analysis and market behavior, tailored for traders across all styles—whether intraday, swing, or positional.
1. The Power of Multi-Timeframe Confluence
Markets are influenced by participants operating on different time horizons:
• Intraday traders act on short-term price fluctuations.
• Swing traders focus on intermediate trends lasting days or weeks.
• Position traders aim to capture multi-month or long-term trends.
By aligning signals from a higher timeframe (macro trend) with a lower timeframe (micro trend), the indicator ensures that short-term entries are in harmony with the broader market direction. This multi-timeframe approach significantly reduces false signals caused by temporary market noise or counter-trend moves.
Example: A bullish trend on the daily chart (higher timeframe) combined with a bullish RSI and EMA alignment on the 15-minute chart (lower timeframe) provides a stronger confirmation than relying on the 15-minute chart alone.
2. Why EMA and RSI Are Essential
Each element of the indicator serves a unique role in ensuring accuracy and reliability:
• EMA (Exponential Moving Average):
• A dynamic trend filter that adjusts quickly to price changes.
• On the higher timeframe, it establishes the overall trend direction (e.g., bullish or bearish).
• On the lower timeframe, it identifies precise entry/exit zones within the trend.
• RSI (Relative Strength Index):
• Adds a momentum-based perspective, confirming whether a trend is backed by strong buying or selling pressure.
• Ensures that signals occur in areas of strength (RSI > 55 for bullish signals, RSI < 45 for bearish signals), filtering out weak or uncertain price movements.
By combining EMA (trend) and RSI (momentum), the indicator delivers confluence-based validation, where both trend and momentum align, making signals more reliable.
3. Cooldown Period for Signal Optimization
Trading in choppy or sideways markets often leads to overtrading and false signals. The cooldown period ensures that once a signal is generated, subsequent signals are suppressed for a defined number of bars. This prevents traders from entering low-probability trades during indecisive market phases, improving overall signal quality.
Example: After a bullish confluence signal, the cooldown period prevents a bearish signal from being triggered prematurely if the market enters a temporary retracement.
4. Use Cases Across Trading Styles
This indicator caters to various trading styles, each benefiting from the confluence of timeframes and technical elements:
• Intraday Trading:
• Use a 1-hour chart as the higher timeframe and a 5-minute chart as the lower timeframe.
• Benefit: Align intraday entries with the hourly trend for higher win rates.
• Swing Trading:
• Use a daily chart as the higher timeframe and a 1-hour chart as the lower timeframe.
• Benefit: Capture multi-day moves while avoiding counter-trend entries.
• Scalping:
• Use a 30-minute chart as the higher timeframe and a 1-minute chart as the lower timeframe.
• Benefit: Enhance scalping efficiency by ensuring short-term trades align with broader intraday trends.
• Position Trading:
• Use a weekly chart as the higher timeframe and a daily chart as the lower timeframe.
• Benefit: Time long-term entries more precisely, maximizing profit potential.
5. Robustness Through Customization
The indicator allows traders to customize:
• Timeframes for higher and lower analysis.
• EMA lengths for trend filtering.
• RSI settings for momentum confirmation.
• Cooldown periods to adapt to market volatility.
This flexibility ensures that the indicator can be tailored to suit individual trading preferences, market conditions, and asset classes, making it a comprehensive tool for any trading strategy.
Why This Mashup Stands Out
The Multi-Timeframe Confluence Indicator is more than a sum of its parts. It leverages:
• EMA’s ability to identify trends, combined with RSI’s insight into momentum, ensuring each signal is well-supported.
• A multi-timeframe perspective that incorporates both macro and micro trends, filtering out noise and improving reliability.
• A cooldown mechanism that prevents overtrading, a common pitfall for traders in volatile markets.
This integration results in a powerful, adaptable indicator that provides actionable, high-confidence signals, reducing uncertainty and enhancing trading performance across all styles.

TrendPredator ESThe TrendPredator Essential (ES)
Stacey Burke, a seasoned trader and mentor, developed his trading system over the years, drawing insights from influential figures such as George Douglas Taylor, Tony Crabel, Steve Mauro, and Robert Schabacker. His popular system integrates select concepts from these experts into a consistent framework. While powerful, it is highly discretionary, requiring significant real-time analysis, which can be challenging for novice traders.
The TrendPredator ES indicator supports this approach by automating the essential analysis required to trade the system effectively and incorporating a mechanical bias and multi-timeframe concept.
It provides value to traders by significantly reducing the time needed for session preparation and offering relevant chart analysis and signals for live trading through real-time updates and a unique consolidated table format.
The Stacey Burke Master Pattern
Inspired by Taylor’s 3-day cycle and Steve Mauro’s work with “Beat the Market Maker,” Burke’s system views markets as cyclical, driven by the manipulative patterns of market makers. These patterns often trap traders at the extremes of moves above or below significant levels with peak formations, then reverse to utilize their liquidity, initiating the next phase. Breakouts away from these traps often lead to range expansions, as described by Tony Crabel and Robert Schabacker. After multiple consecutive breakouts, especially after the psychological number three, overextension might develop. A break in structure may then lead to reversals or pullbacks. Burke’s system is designed to track these cycles on the daily timeframe and provides signals and trade setups to navigate along them.
Bias Logic and Multi-Timeframe Concept
The indicator covers the basic signals of his system:
- First Red Day (FRD): Bearish break in structure, signalling weak longs in the market.
- First Green Day (FGD): Bullish break in structure signalling weak shorts in the markt.
- Three Days of Longs (3DL): Overextension signalling potential weak longs in the market.
- Three Days of Shorts (3DS): Overextension signalling potential weak shorts in the market.
- Inside Day (ID): Contraction, signalling potential impulsive reversal or range expansion move.
It enhances the original system by introducing:
Structured Bias Logic:
Tracks bias by following how price trades concerning the last previous candle high or low that was hit. For example if the high was hit, we are bullish above and bearish below.
- Bullish state: Breakout (BO), Fakeout Low (FOL)
- Bearish state: Breakdown (BD), Fakeout High (FOH)
Multi-Timeframe Perspective:
- Tracks all signals across H4, H8, D, W, and M timeframes, to look for alignment and follow trends and momentum in a mechanical way.
The indicator monitors the bias and signals of the system across all relevant timeframes and automates the related graphical chart analysis to generate the information needed for the trader to identify key setups. Additional to the SB pattern, the system helps to identify the higher timeframe situation and follow the moves driven by other timeframe traders.
Example: Full Bullish Cycle on the Daily Timeframe with Signals
- The Trap/Peak Formation
The market breaks down from a previous day’s and maybe week’s low—potentially after multiple breakdowns—but fails to move lower and pulls back up to form a peak formation low and closes as a first green day.
Signal: Bullish daily and weekly fakeout low; three consecutive breakdown days (1W Curr FOL, 1D Curr FOL, BO 3S).
- Pullback and Consolidation
The next day pulls further up after first green day signal, potentially consolidates inside the previous day’s range.
Signal: Fakeout low and first green day closing as an inside day (1D Curr IS, Prev FOL, First G).
- Range Expansion/Trend
The following day breaks up through the previous day’s high, launching a range expansion away from the trap.
Signal: Bullish daily breakout of an inside day (1D Curr BO, Prev IS).
- Overextension
After multiple consecutive breakouts, the market reaches a state of overextension, signalling a possible reversal or pullback.
Signal: Three days of breakout longs (1D Curr BO, Prev BO, BO 3L).
Note: This is only one possible scenario; there are many variations and combinations.
Example Chart: Full Bullish Cycle with Correlated Signals
Note: The signals shown along the move are manually added illustrations. The indicator shows these in realtime in the table at the bottom right. This is only one possible scenario; there are many variations and combinations.
Due to the fractal nature of markets, this cycle can be observed across timeframes. The strongest setups show multi-timeframe alignment. For example, a peak formation and potential reversal on the daily timeframe has high probability and follow-through if it also aligns with bearish signals on higher timeframes (e.g., weekly/monthly BD/FOH) and confirmation on lower timeframes (H4/H8 FOH/BD). With this perspective the system enables the trader to follow the trend and momentum and identify rollover points in a very differentiated way.
Detailed Features and Options
1. Historic Highs and Lows
Displays historic highs and lows per timeframe for added context, enabling users to track sequences over time.
Timeframes: H4, H8, D, W, M
Options: Customize for timeframes shown, number of historic candles per timeframe, colors, formats, and labels.
2. Previous High and Low Extensions
Displays extended previous levels (high, low, and close) for each timeframe to assess how price trades relative to these levels.
H4: P4H, P4L, P4C
H8: P8H, P8L, P8C
Daily: PDH, PDL, PDC
Weekly: PWH, PWL, PWC
Monthly: PMH, PML, PMC
Options: Fully customizable for timeframes shown, colors, formats, and labels.
3. Breach Lines
Tracks live market reactions (e.g., breakouts or fakeouts) per timeframe for the last previous high or low that was hit, highlighting these levels originating at the breached candle to indicate bias (color-coded).
Red: Bearish below
Green: Bullish above
H4: 4FOL, 4FOH, 4BO, 4BD
H8: 8FOL, 8FOH, 8BO, 8BD
D: dFOL, dFOH, dBO, dBD
W: wFOL, wFOH, wBO, wBD
M: mFOL, mFOH, mBO, mBD
Options: Fully customizable for timeframes shown, colors, formats, and labels.
4. Multi-Timeframe Table
Provides a real-time view of system signals, including:
Current Timeframe (Curr): Bias states.
- Breakout (green BO): Bullish after breaking above the previous high.
- Fakeout High (red FOH): Bearish after breaking above the previous high but pulling back down.
- Breakdown (red BD): Bearish after breaking below the previous low.
- Fakeout Low (green FOL): Bullish after breaking below the previous low but pulling back up.
- Inside (IS): Price trading neutral inside the previous range, taking the previous bias (color indicates the previous bias).
Previous Timeframe (Prev): Tracks last candle bias state and transitions dynamically.
- Bias for last candle: BO, FOH, BD, FOL in respective colors.
- Inside bar (yellow IS): Indicated as standalone signal.
Note: Also previous timeframes get constantly updated in real time to track the bias state in relation to the level that was hit. This means a BO can still lose the level and become a FOH, and vice versa, and a BD can still become a FOL, and vice versa. This is critical to see for example if traders that are trapped in that timeframe with a FOH or FOL are released. An inside bar stays fixed, though, since no level was hit in that timeframe.
Breakouts (BO): Breakout count 3 longs and 3 shorts.
- 3 Longs (red 3L): Bearish after three breakouts without hitting a previous low.
- 3 Shorts (green 3S): Bullish after three breakdowns without hitting a previous high.
First Countertrend Close (First): Tracks First Red or Green Day.
- First Green (G): After two consecutive red closes.
- First Red (R): After two consecutive green closes.
Options: Customizable font size and label colors.
Overall Options:
Toggle single feature groups on/off.
Customize H8 open/close time as an offset to UTC to be provider independent.
Colour settings for dark or bright backgrounds.
Using the Indicator for Trading
The automated analysis provided by the indicator can be used for thesis generation in preparation for a session as well as for live trading, leveraging the real-time updates. It is recommended to customize the settings accordingly, such as hiding the lower timeframes for thesis generation to keep the charts clean.
1. Setup Identification:
Follow the bias of daily and H8 timeframes. A setup always requires alignment of these.
Setup Types:
- Trend Trade: Trade in alignment with the previous day’s trend.
Example: Price above the previous day’s high → Focus on long setups (dBO, H8 FOL) until overextension or reversal signs appear (H8 BO 3L, First R).
- Reversal Trade: Identify reversal setups when lower timeframes show rollovers after higher timeframe weakness.
Example: Price below the previous day’s high after FOH → Look for reversal signals at the current high of day (H8 FOH, BO 3L, First R).
2. Context Assessment:
Evaluate alignment of higher timeframes (e.g., Month/Week, Week/Day). More alignment → Stronger setups. Conflicting situations → Setups invalidated.
3. Entry Confirmation:
Confirm entries based on H8 and H4 alignment and candle closes (e.g., M15 or M5 close after entering setup zone as confirmation).
Example Chart for Reversal Trade:
1. Setup Identification: FOH continuation after BO 3L overextension, confirmed by H8 FOH, First R.
2. Context Assessment: Month in FOL with bearish First R; Week in BO but bearishly overextended with BO 3L.
3. Entry Confirmation: H4 BD, M5 close.
Further recommendations:
- Higher timeframe context: TPO or volume profile indicators can be used to gain an even better overview.
- Entry confirmation: Momentum indicators like VWAP, Supertrend, or EMA are helpful for increasing precision. Additionally, tracking lower timeframe fakeouts can provide powerful confluence.
- Late session trading: Entries later in the session, such as during the 3rd hour of the NY session, offer better analysis and follow-through on setups.
Limitations:
Data availability using TradingView has its limitations. The indicator leverages only the real-time data available for the specific timeframe being used. This means it cannot access data from timeframes lower than the one displayed on the chart. For example, if you are on a daily chart, it cannot use H8 data. Additionally, on very low timeframes, the historical availability of data might be limited, making higher timeframe signals unreliable.
To address this, the indicator automatically hides the affected columns in these specific situations, preventing false signals.
Disclaimer
This indicator is for educational purposes only and does not guarantee profits.
None of the information provided shall be considered financial advice.
The indicator does not provide final buy or sell signals but highlights zones for potential setups.
Users are fully responsible for their trading decisions and outcomes.

ADVDEC.US OSCILLATORThis Pine Script implements an ADVDEC.US Oscillator, which is an indicator designed to analyze the Advance-Decline index (ADVDEC.US) with multiple smoothing techniques and timeframes. Here's what the script does:
Symbol and Inputs:
- The script is based on the ADVDEC.US index, which measures the difference between advancing and declining stocks.
Users can adjust several settings:
- Lookback Period: Defines the number of periods over which the highest and lowest values of the ADVDEC.US index are calculated.
- Smoothing Period: Smooths the oscillator with a simple moving average (SMA) to reduce market noise.
- EMA Period: Applies an Exponential Moving Average (EMA) to the smoothed oscillator for further trend analysis.
- MTF Period: Allows for fetching data from a specified timeframe (default is 5 minutes).
Calculation:
- It calculates the highest and lowest values of the ADVDEC index over the defined lookback period.
- It normalizes the ADVDEC value into a percentage between 0 and 100, representing the position of the current value relative to the range over the lookback period.
- This raw oscillator is then smoothed with an SMA to reduce choppiness.
- Finally, an EMA is calculated on the smoothed oscillator to emphasize the trend direction.
Thresholds:
- Horizontal lines are plotted at key levels (70, 30, and 50) for visual reference, offering an "RSI-style" interpretation of the oscillator.
- The upper and lower thresholds can indicate overbought/oversold conditions, while the midline helps identify neutral levels.
Visualization:
- The smoothed oscillator is plotted in blue.
- The EMA of the smoothed oscillator is plotted in orange.
In summary, this indicator aims to visualize the relationship between advancing and declining stocks with added smoothing and trend-following elements, providing an easy-to-interpret oscillator that can be used for market analysis or decision-making.

Volume Equilibrium Overlay(2 of 2)This is an overlay for a prior script I've created: Volume Equilibrium.
To sum it up in a brief manner, this script plots when there is "volume-equilibrium" aka prices that the market may see as "fair-value" relative to the specified timeframe. This script provides what my last code lacked and that is a visual representation of critical prices.
The arrows beside the indications indicate the direction that the buying/selling volume was heading towards.
UP ARROW - indicates that equilibrium was had via increasing buy volume
DOWN ARROW - indicates that equilibrium was had via decreasing buy volume
Remember, this doesn't inherently mean that a stock is supposed to go up or down. Its just a representation of 'fair-value' points using volume. Also remember... both indicators provide what the other lacks. It isn't necessary to use both but for a broad overview of volume it definitely helps to at least be aware of how this information can be represented. Perhaps... consider switching between the two to see what you may be missing.
I believe finding 'fair-value' points via volume and price action provides a more objective way to measure what prices one should look at rather then arbitrary lines plotted on a chart. For more information feel welcome to look at the script that this code is based off of.

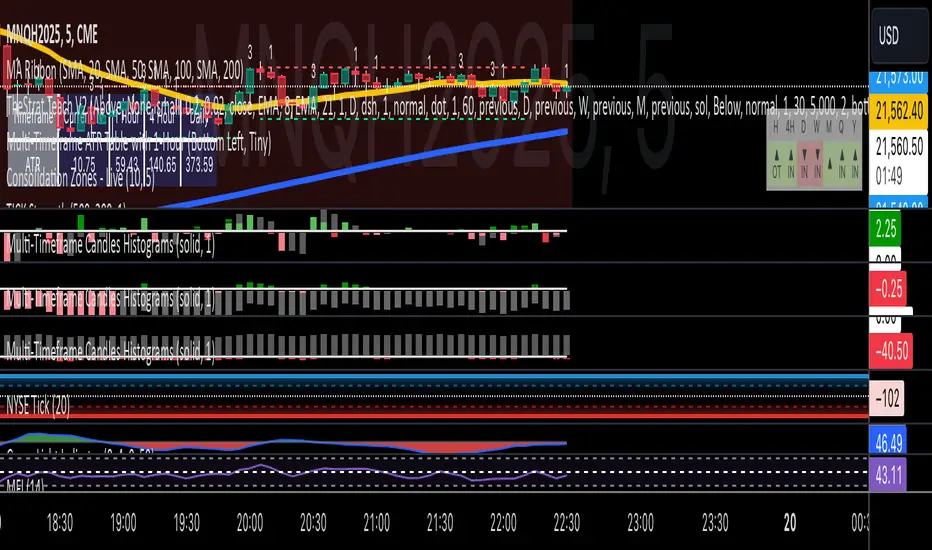
Multi-Timeframe Candles HistogramsAt some community members' requests, I have built on the original code to make it a single indicator with the option for users to check off which timeframes they want to be shown. Choices are 1-hour, daily, weekly, and monthly.
I couldn't figure out how to separate each timeframe into its own histogram, so this is the best I can offer at the moment. If any community member wants to take a crack at it, be my guest.
Colors are customizable.
If you have a paid TW account, you can lay it down twice and put the hour and daily on one and the weekly and monthly on the other.
That said, I hope you enjoy this version of this indicator.
R.I.P. Rob Smith, creator of TheStrat.
---
Key Features and Benefits
1. Custom Timeframe Selection:
- Choose from an array of timeframes ranging from minutes to months, giving you complete flexibility in your market analysis.
- Quickly switch between different timeframes (e.g., 1-hour, daily, or weekly) to track continuity across varying levels.
2. Visual Representation of High/Low Markers:
- Enable or disable the display of high and low points to better understand price ranges and reversals.
- These markers allow you to spot key turning points on different timeframes, facilitating better entry or exit decisions.
3. Enhanced Candle Visualization:
- Displays candles with precise price levels aligned to your chosen timeframe, giving a clearer view of price trends.
- Candles are color-coded to reflect price movement, which is customizable by the user.
---
How to Use This Indicator
Monitor Multiple Timeframes Simultaneously:
- Place the indicator on your chart and choose the timeframes you want to follow (e.g., hourly, daily, weekly, monthly).
- For each instance, checkmark the desired timeframes in the menu to ensure that you’re tracking the right period.
Achieve Timeframe Continuity:
- By aligning lower timeframes with higher ones, this tool helps you confirm trends, detect reversals, and avoid trades that go against the broader market movement.
---
Why This Indicator is Valuable for Traders
This tool simplifies a core principle of TheStrat—full timeframe continuity—by visually representing price action across multiple timeframes in a clear and actionable way. It removes the guesswork and helps traders stay in sync with market momentum, regardless of the timeframe they are analyzing.
This solution offers flexibility, clarity, and speed, enabling traders to quickly grasp critical movements and improve decision-making. Whether you are a scalper focusing on intraday moves or a swing trader watching weekly trends, this tool empowers you to maintain alignment with the overall market structure.
In essence, it brings the power of TheStrat to your fingertips by offering precise and easy-to-read visual aids, allowing you to seamlessly apply Rob Smith’s philosophy to your trading.
HTF CandlesHTF Candles, Plot of a Higher/Lower Timeframe Candles on any chart.
This HTF / LTF candle plot displays the previous 3 daily candles with the current update of the price with reference to a lower time frame.
Candles includes 3 Candles of HTF
last HTF candle includes 4 previous candles from LTF
Candle High Low Open Close are plotted.
these OHLC values act as Support and Resistance With reference to current Price.
very useful in making HTF and LTF analysis with reference to current timeframe.

Supports and Resistances Multi Timeframe - VK TradingThe Supports and Resistances Multi Timeframe - VK Trading indicator is designed to help traders identify key support and resistance levels across multiple timeframes. It integrates real-time market data with smooth, customizable visual markers, allowing traders to quickly spot potential entry and exit points. This tool is particularly valuable for trend-following traders who want to see the most critical levels of price action on various timeframes.
Features:
Multi-Timeframe Support: Display support and resistance levels for the current, first, and second timeframes, helping traders identify price points across different market cycles.
Customizable Appearance: Choose from various colors for levels and bands, as well as transparency settings to match your chart's design.
ATR-based Bands: Uses the Average True Range (ATR) to dynamically adjust the width of support and resistance bands, offering more accurate price movement insights.
Pivot Points: Identifies pivot highs and lows, offering precise support and resistance levels based on the price action.
Smoothing Options: Customize the ATR smoothing method with options like RMA, SMA, EMA, and WMA for better alignment with your trading strategy.
Functionalities:
Quick Level Detection: The indicator highlights the most recent high and low levels on the current timeframe, ensuring you’re always aware of nearby price barriers.
Support and Resistance Visualization: Easily visualize the major support and resistance levels on multiple timeframes, improving decision-making and trade management.
Dynamic Band Widths: Customize the ATR multiplier for each timeframe, adapting the support and resistance bands based on the volatility of the market.
Multi-Timeframe Integration: View price action levels from a broader perspective with support and resistance data from the current, first, and second timeframes all in one chart.
Flexible Timeframe Selection: Choose your preferred timeframes for support and resistance levels, from daily, weekly, to monthly, for broader or narrower market views.
How it Helps Traders:
This indicator is ideal for traders who rely on multi-timeframe analysis to make well-informed trading decisions. By visualizing key support and resistance levels across several timeframes, traders can improve the precision of their entries and exits, better manage risk, and enhance their market timing. The tool provides a comprehensive view of price action, allowing traders to spot potential reversals and breakouts, making it easier to execute strategies effectively.
Disclaimer:
This script is an educational and analytical tool. It does not guarantee specific results or eliminate trading risk. Trading in the financial markets involves significant risks; use this script at your own risk.

Swing Structure Scanner [LuxAlgo]The Swing Structure Scanner Indicator is a dashboard type indicator which displays a Consolidated "High/Low-Only" view of swing structure, with the capability to retrieve and display swing points from up to 6 different tickers and timeframes at once.
🔶 USAGE
This indicator displays swing structure data from up to 6 unique tickers or timeframes; Each graph represents the current swing structure retrieved from the requested chart/s.
Each swing graph displays the current live swing point positioning relative to the previous swing points. By analyzing the different formations, patterns can more easily be recognized and found across multiple tickers or timeframes at once.
This indicator serves as a nifty tool for confluence recognition, whether that's confluence throughout market tickers, or confluence through higher timeframes on the same ticker.
Alternatively, viewing the relative positioning of each swing point to each other, should give a clearer idea when higher lows or lower highs are formed. This can potentially indicate a newly forming trend, as well as serving as a warning to watch for breakouts.
The swing length can be changed to align with each individual's strategy, as well as a display look back can be adjusted to show more or less swing points at one time.
The display is fairly customizable, it is not fixed to 6 symbols at all times and can be minimized to only display the number of symbols needed; Additionally, the display can be set to vertical mode or horizontal(default) to utilize as needed.
Note: Hover over the swing point in the dashboard to get a readout of the exact price level of the swing point.
🔶 SETTINGS
Swing Length: Set the swing length for the structure calculations.
Swing Display Lookback: Sets the number of swing points (Pairs) to display in each Swing Graph display.
Symbols: Sets the Timeframe and Symbol for each Swing Graph.
Vertical Display: Display the Swing Graphs up and down, rather than side to side.
Scaling Factor: Scales the entire indicator up or down, to fit your needs.

Multi-Timeframe Candle Analysis [by Oberlunar]Multi-Timeframe Candle Analysis
Scalping often requires traders to make rapid decisions based on price movements within a short timeframe. However, a key challenge is understanding the broader trend and market pressure across higher timeframes without cluttering the workspace with multiple charts. This can lead to a lack of clarity, missed opportunities, or poorly timed trades.
The Multi-Timeframe Candle Analysis script addresses this challenge by providing a consolidated view of essential information across multiple timeframes in a single interface. This script calculates and displays the volatility, strength, and type (bullish or bearish) of candles for up to six customizable timeframes. With this data presented in a neat table, traders can quickly assess market conditions without the need to open multiple charts.
How It Works
The script analyzes six user-defined timeframes, ranging from intraday intervals (e.g., 15 or 30 minutes) to daily or even weekly periods. It extracts critical data such as open, high, low, and close prices for the current and previous candles. From this data, the script computes:
Candle Type: Identifies whether the candle is bullish or bearish based on the close relative to the open.
Volatility Percentage Change: Measures the percentage change in candle volatility compared to the previous candle.
Candle Strength: Evaluates the strength of price movements within the candle relative to the previous one.
These metrics are organized into an easy-to-read table that updates dynamically as the market moves. The table color codes bullish and bearish candles for quick visual recognition, enhancing decision-making speed.

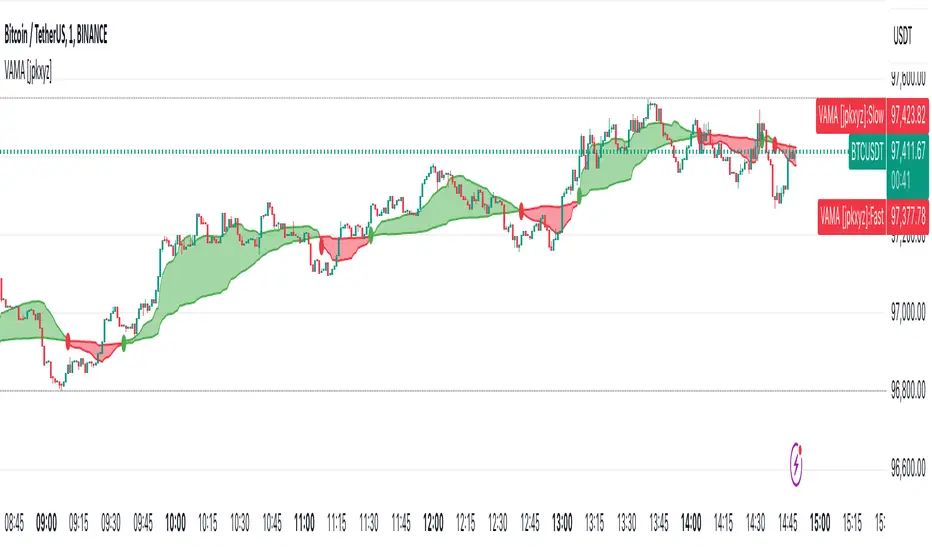
VAMA - Volume Adjusted Moving Average [jpkxyz]VAMA is a moving average that adapts to volume, giving more weight to price movements backed by higher relative volume. This VAMA (Volume Adjusted Moving Average) indicator implementation emphasizes visual clarity. It is based on the VAMA script by @allanster
Dual VAMA lines (Fast/Slow) with dynamic coloring:
Single-color scheme switches between green (bullish) and red (bearish)
Color changes on crossovers rather than relative position
Configurable line widths (set to 1 for clean appearance)
Visual enhancements:
Optional fill between VAMA lines (50% transparency)
Crossover dots can be toggled
Fills and dots match the current trend color
Customization parameters:
Independent source inputs for Fast/Slow lines
Adjustable VI Factor (volume influence)
Sample size control
Strict/non-strict calculation toggle
The code maintains efficient computation while prioritizing visual feedback for trend changes. It's designed for clear signal identification without visual clutter.
Notable style choices:
Consistent color theming throughout all visual elements
Simplified color transitions (only at crossovers)
Subtle transparency for fill areas
Minimal dot size for crossover markers
VAMA (Volume Adjusted Moving Average) Technical Analysis:
Core Calculation:
1. Volume Influence (v2i):
v2i = volume / ((total_volume/total_periods) * volume_factor)
- total_volume: Sum of volume over sample period
- total_periods: Either full history (nvb=0) or specified sample size
- volume_factor: Controls sensitivity to volume deviation
2. Price Weighting:
weighted_price = source_price * v2i
3. Accumulation Process:
- Iterates through length*10 periods
- Accumulates weighted prices and volume influence values
- Continues until volume influence sum >= specified length or strict rule triggers
4. Final VAMA Value:
vama = (weighted_sum - (volume_sum - length) * last_price) / length
Parameters:
- SampleN: Historical reference length (0=full history)
- Length: Base period for calculation
- VI Factor: Volume influence multiplier (>0.01)
- Strict: Forces exact length period completion when true
- Source: Input price data
4-Hour Moving AveragesTitle: 4-Hour Moving Averages Indicator
Description:
The "4-Hour Moving Averages" indicator is designed to help traders easily visualize key moving averages derived from the 4-hour timeframe, regardless of the chart interval they are using. This indicator plots four moving averages: a 15-period SMA (Short-Term), a 35-period SMA (Intermediate-Term), an 80-period SMA (Long-Term), and a 130-period SMA (Confirmation).
These moving averages provide a balanced approach for identifying short, medium, and long-term trends, as well as confirming significant market movements. Ideal for swing traders and those looking for clear trend signals, the indicator can be used for various markets, including stocks, forex, and cryptocurrencies.
The 4-hour moving averages overlay directly on the price chart, allowing for easy analysis of current price movements relative to important trend indicators. Use this script to enhance your trading decisions, identify opportunities, and avoid market traps by relying on consistent moving average trends.
Features:
- 15 SMA for Short-Term Trends (in red)
- 35 SMA for Intermediate-Term Trends (in orange)
- 80 SMA for Long-Term Trends (in green)
- 130 SMA for Confirmation (in blue)
Feel free to modify the settings to suit your specific strategy and market conditions.

Higher Time Frame Support/Resistance [BigBeluga]The Higher Time Frame Support/Resistance indicator is a tool designed to display pivot points derived from higher timeframes on your current chart. These pivot points are calculated based on the highs and lows of price action in different timeframes, and the indicator draws horizontal lines to represent these levels. These lines act as potential support and resistance zones, giving traders key market levels that may influence future price movement.
Each pivot line is color-coded and labeled with its price value and the timeframe it originates from. This allows traders to clearly differentiate between the significance of the levels based on their timeframe. For example, weekly pivot levels may represent stronger, more long-term support and resistance, while hourly pivots offer more immediate, short-term levels to watch.
🔵 IDEA
The Higher Time Frame Support/Resistance indicator is designed to simplify the process of tracking key support and resistance levels across multiple timeframes. Pivot points, which represent turning points in the market, are essential for identifying areas where price might reverse or break out. By displaying these levels from higher timeframes directly on the current chart, traders can quickly identify and react to critical areas in the market without needing to switch between different timeframe charts.
The indicator labels each pivot point with the specific timeframe it comes from (e.g., 4H, 1D, 1W), making it easy for traders to assess the relative strength of each level. Stronger levels from higher timeframes are likely to act as more significant barriers or support zones, while lower timeframe levels can be used for more precise entries and exits.
🔵 KEY FEATURES
Pivot Levels from Multiple Timeframes:
The indicator calculates pivot highs and lows from various higher timeframes (e.g., 4H, 1D, 1W) and plots these levels on the current chart. These pivot points are represented by horizontal lines that extend across the chart, serving as potential support and resistance zones.
Color-Coded Support and Resistance Lines:
Each pivot level is color-coded based on its timeframe, helping traders quickly differentiate between short-term and long-term support and resistance. This visual aid simplifies the analysis and allows for a clearer understanding of key market levels.
Price Labels and Timeframe Information:
In addition to the pivot lines, the indicator displays labels at each level with the corresponding price and timeframe. For example, a label may show "D Pivot High" followed by the exact price. This helps traders understand the origin and significance of each line, allowing for more informed trading decisions.
Labels up and down mark highs and lows from higher timeframes:
Pivot Shadows for Enhanced Clarity:
The indicator can also draw shadow lines that represent the pivot points but with increased transparency. These shadows allow traders to keep track of previous pivots without cluttering the chart with too many solid lines. The width and transparency of these shadows can be customized in the settings.
🔵 HOW TO USE
🔵 CUSTOMIZATION
Timeframes and Pivot Length: Customize which higher timeframes (e.g., 4H, 1D, 1W) you want to display pivot levels from. Adjust the pivot length to control how sensitive the indicator is in detecting market highs and lows.
Line Style and Colors: Adjust the line style (solid, dashed, dotted) and colors for each timeframe to match your personal preference or chart theme. This customization helps in maintaining a clear and visually appealing chart.
Shadow Line Width and Transparency: Control the width and transparency of the shadow pivot lines to reduce chart clutter while still keeping track of key historical levels.

Enhanced Pressure MTF ScreenerEnhanced Pressure Multi-Timeframe (MTF) Screener Indicator
Overview
The Enhanced Pressure MTF Screener is an add-on that extends the capabilities of the Enhanced Buy/Sell Pressure, Volume, and Trend Bar Analysis . It provides a clear and consolidated view of buy/sell pressure across multiple timeframes. This indicator allows traders to determine when different timeframes are synchronized in the same trend direction, which is particularly useful for making high-confidence trading decisions.
Image below: is the Enhanced Buy/Sell Pressure, Volume, and Trend Bar Analysis with the Enhanced Pressure MTF Screener indicator both active together.
Key Features
1.Multi-Timeframe Analysis
The indicator screens various predefined timeframes (from 1 week down to 10 minutes).
It offers a table view that shows buy or sell ratings for each timeframe, making it easy to see which timeframes are aligned.
Traders can choose which timeframes to include based on their trading strategies (e.g., higher timeframes for position trading, lower timeframes for scalping).
2.Pressure and Trend Calculation
Uses Buy and Sell Pressure calculations from the Enhanced Buy/Sell Pressure indicator to determine whether buying or selling is dominant in each timeframe.
By analyzing pressures on multiple timeframes, the indicator gives a comprehensive perspective of the current market sentiment.
The indicator calculates whether a move is strong based on user-defined thresholds, which are displayed in the form of additional signals.
3.Heikin Ashi Option
The Heikin Ashi candle type can be toggled on or off. Using Heikin Ashi helps smooth out market noise and provides a clearer indication of trend direction.
This is particularly helpful for traders who want to filter out market noise and focus on the primary trend.
4.Table Customization
Table Positioning: The table showing timeframe data can be positioned at different locations on the chart—top, middle, or bottom.
Text and Alignment: The alignment and text size of the table can be customized for better visual clarity.
Color Settings: Users can choose specific colors to indicate buying and selling pressure across timeframes, making it easy to interpret.
5.Strong Movement Indicators
The screener provides an additional visual cue (🔥) for timeframes where the movement is deemed strong, based on a user-defined threshold.
This helps highlight timeframes where significant buying or selling pressure is present, which could signal potential trading opportunities.
How the Screener Works
1.Pressure Calculation
For each selected timeframe, the indicator retrieves the Open, High, Low, and Close (OHLC) values.
It calculates buy pressure (the range between high and low when the closing price is higher than the opening) and sell pressure (the range between high and low when the closing price is equal to or lower than the opening).
The screener computes the pressure ratio, which represents the difference between buying and selling pressure, to determine which side is dominant.
2.Trend Rating and Signal Generation
Based on the calculated pressure, the screener determines a trend rating for each timeframe: "Buy," "Sell," or "Neutral." (▲ ,▼ or •)
Additionally, it generates a signal (▲ or ▼) to indicate the current trend direction and whether the move is strong (based on the user-defined threshold).
If the movement is strong, a fire icon (🔥) is added to indicate that there is significant pressure on that timeframe, signaling a higher confidence in the trend.
3.Customizable Strong Move Thresholds
Strong Move Threshold: The screener uses this value to decide whether a trend is significantly strong. A higher value makes it more selective in determining strong moves.
Strong Movement Threshold: Helps determine when an additional strong signal should be displayed, offering further insight into the strength of market movement.
Inputs and Customization
The Enhanced Pressure MTF Screener is highly customizable to fit the needs of individual traders:
General Settings:
Use Heikin Ashi: Toggle this setting to use Heikin Ashi for a smoother trend representation.
Strong Move Threshold: Defines how strong a move should be to be considered significant.
Strong Movement Threshold: Specifies the level of pressure required to highlight a move with the fire icon.
Table Settings:
Position: Choose the vertical position of the screener table (top, middle, or bottom of the chart).
Alignment: Align the table (left, center, or right) to best suit your chart layout.
Text Size: Adjust the text size in the table for better readability.
Table Color Settings:
Users can set different colors to represent buying and selling signals for better visual clarity, particularly when scanning multiple timeframes.
Timeframe Settings:
The screener provides options to include up to ten different timeframes. Traders can select and customize each timeframe to match their strategy.
Examples of available timeframes include 1 Week, 1 Day, 12 Hours, down to 10 Minutes, allowing for both broad and detailed analysis.
Practical Use Case
Identifying Trend Alignment Across Timeframes:
Imagine you are about to take a long trade but want to make sure that the trend direction is aligned across multiple timeframes.
The screener displays "Buy" ratings across the 4H, 1H, 30M, and 10M timeframes, while higher timeframes (like 1W and 1D) also show "Buy" with strong signals (🔥). This indicates that buying pressure is strong across the board, adding confidence to your trade.
Spotting Reversal Opportunities:
If a downtrend is evident across most timeframes but suddenly a higher timeframe, such as 12H, changes to "Buy" while showing a strong move (🔥), this could indicate a potential reversal.
The screener allows you to spot these discrepancies and consider taking early action.
Benefits for Traders
1.Synchronization Across Timeframes:
One of the main strengths of this screener is its ability to show synchronized buy/sell signals across different timeframes. This makes it easy to confirm the strength and consistency of a trend.
For example, if you see that all the selected timeframes display "Buy," this implies that both short-term and long-term traders are favoring the upside, giving additional confidence to go long.
2.Quick and Visual Trend Overview:
The table offers an at-a-glance summary, reducing the time required to manually inspect each timeframe.
This makes it particularly useful for traders who want to make quick decisions, such as day traders or scalpers.
3.Strong Move Indicator:
The use of fire icons (🔥) provides an easy way to identify significant movements. This is particularly helpful for traders looking for breakouts or strong market conditions that could lead to high probability trades.
To put it short or to summarize
The Enhanced Pressure MTF Screener is a powerful add-on for traders looking to understand how buy and sell pressure aligns across multiple timeframes. It offers:
A clear summary of buying or selling pressure across different timeframes.
Heikin Ashi smoothing, providing an option to reduce market noise.
Strong movement signals to highlight significant trading opportunities.
Customizable settings to fit any trading strategy or style.
The screener and the main indicator are best used together, as the screener provides the multi-timeframe overview, while the main indicator provides an in-depth look at each individual bar and trend.
I hope my indicator helps with your trading, if you guys have any ideas or questions there is the comment section :D

Alpine Predictive BandsAlpine Predictive Bands - ADX & Trend Projection is an advanced indicator crafted to estimate potential price zones and trend strength by integrating dynamic support/resistance bands, ADX-based confidence scoring, and linear regression-based price projections. Designed for adaptive trend analysis, this tool combines multi-timeframe ADX insights, volume metrics, and trend alignment for improved confidence in trend direction and reliability.
Key Calculations and Components:
Linear Regression for Price Projection:
Purpose: Provides a trend-based projection line to illustrate potential price direction.
Calculation: The Linear Regression Centerline (LRC) is calculated over a user-defined lookbackPeriod. The slope, representing the rate of price movement, is extended forward using predictionLength. This projected path only appears when the confidence score is 70% or higher, revealing a white dotted line to highlight high-confidence trends.
Adaptive Prediction Bands:
Purpose: ATR-based bands offer dynamic support/resistance zones by adjusting to volatility.
Calculation: Bands are calculated using the Average True Range (ATR) over the lookbackPeriod, multiplied by a volatilityMultiplier to adjust the width. These shaded bands expand during higher volatility, guiding traders in identifying flexible support/resistance zones.
Confidence Score (ADX, Volume, and Trend Alignment):
Purpose: Reflects the reliability of trend projections by combining ADX, volume status, and EMA alignment across multiple timeframes.
ADX Component: ADX values from the current timeframe and two higher timeframes assess trend strength on a broader scale. Strong ADX readings across timeframes boost the confidence score.
Volume Component: Volume strength is marked as “High” or “Low” based on a moving average, signaling trend participation.
Trend Alignment: EMA alignment across timeframes indicates “Bullish” or “Bearish” trends, confirming overall trend direction.
Calculation: ADX, volume, and trend alignment integrate to produce a confidence score from 0% to 100%. When the score exceeds 70%, the white projection line is activated, underscoring high-confidence trend continuations.
User Guide
Projection Line: The white dotted line, which appears only when the confidence score is 70% or higher, highlights a high-confidence trend.
Prediction Bands: Adaptive bands provide potential support/resistance zones, expanding with market volatility to help traders visualize price ranges.
Confidence Score: A high score indicates a stronger, more reliable trend and can support trend-following strategies.
Settings
Prediction Length: Determines the forward length of the projection.
Lookback Period: Sets the data range for calculating regression and ATR.
Volatility Multiplier: Adjusts the width of bands to match volatility levels.
Disclaimer: This indicator is for educational purposes and does not guarantee future price outcomes. Additional analysis is recommended, as trading carries inherent risks.
