No Gaps - JizzanyNo Gaps – Jizzany
Fill the blanks. Own the patterns.
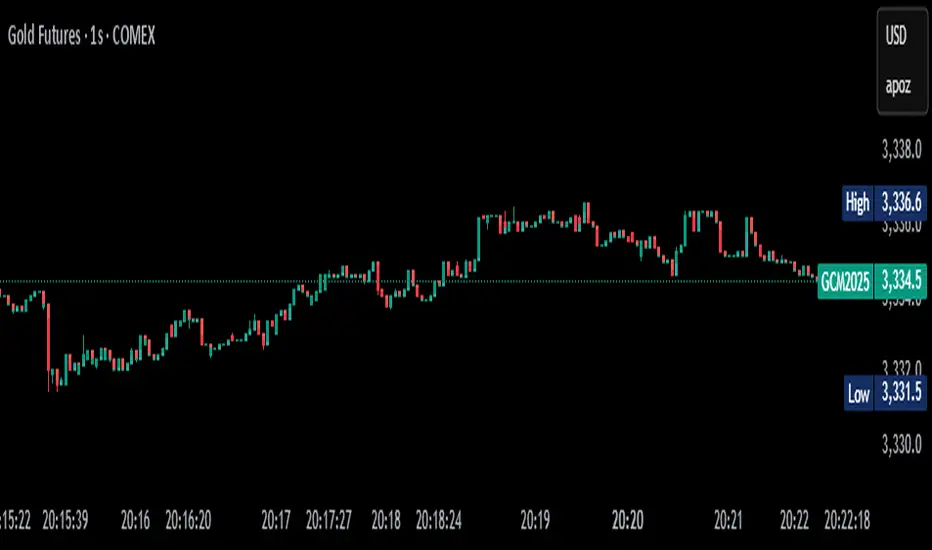
Don’t let thin futures feeds or blazing-fast 1 s bars break your flow—this overlay stitches every missing pixel back into your chart so you can:
🔍 Analyze low-liquidity markets (futures, exotic FX, crypto alt-pairs) without awkward jumps
⏱️ Trade ultra-low timeframes (1 s, tick charts) with full confidence in every wick
📈 Spot price patterns seamlessly, even when your broker’s feed skips a beat
How it works: Auto-detects gaps between sessions or feeds, then draws miniature candles from the prior close to the current open—using real intrabar highs/lows—so nothing ever goes unseen.
Perfect for scalpers, day traders, and anyone who demands continuity in every bar. Try it on your next chart and rediscover the story in every candle.
Turn This
Into This
This
Into
Options
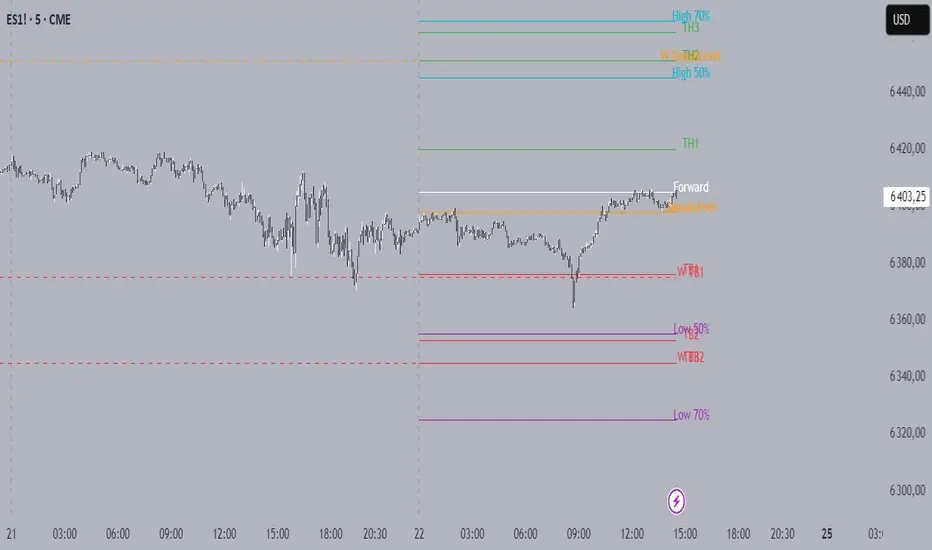
Smash + Proba + BFThis script is designed to automatically display various levels that can be useful for trading.
These levels must be entered in the script as parameters in the form of lists separated by semicolons (";").
There are three groups of levels:
Smash: Levels provided in the Smashelito newsletter
Proba: Probability levels (50% and 70%) of reaching certain price points, calculated using options data
BF: Option-related levels provided by Krechendo Connect / BlackFlag
Example :
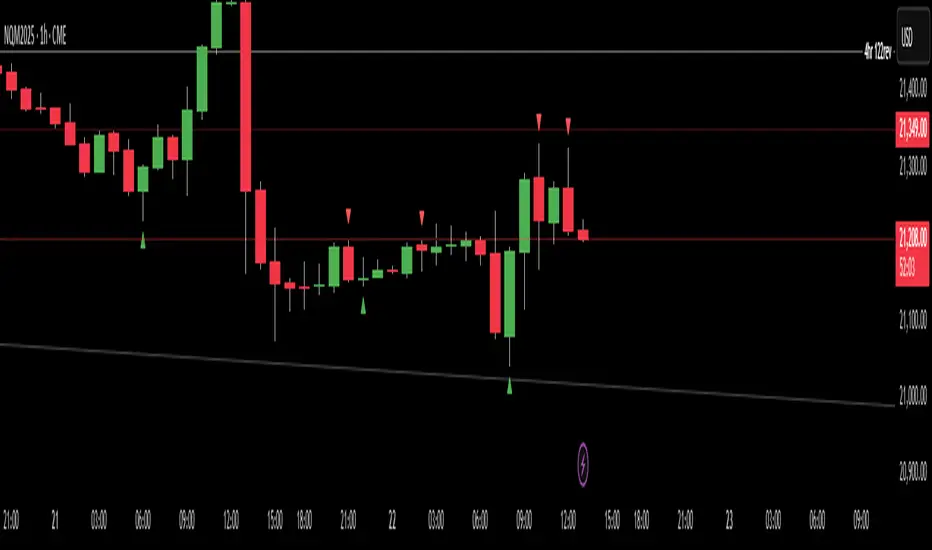
Failed 2s - The StratDescription:
This indicator detects and highlights "Failed 2" candlestick patterns from The Strat methodology — key price action setups signaling potential reversals or continuation points. It automatically identifies Failed 2 Down (Failed 2D) and Failed 2 Up (Failed 2U) signals by analyzing two consecutive bars, with special attention to price interaction at the 50% midpoint of the previous candle.
Visuals:
- Green upward triangles mark Failed 2 Down signals (bullish setups).
- Red downward triangles mark Failed 2 Up signals (bearish setups).
- Special signals that touch the 50% midpoint of the previous candle are emphasized but use the same shapes.
Alerts:
Built-in alert conditions let you receive notifications when these patterns occur, so you never miss a trade opportunity.
How to Use ALERTS in TradingView
- Paste this code into Pine Editor on TradingView.
- Click Add to Chart.
Set alerts:
- Click "Alerts" → "Condition" = your indicator name
- Choose the alert type (e.g. "Failed 2D Bar Alert")
- Set "Once per bar close"
- Customize the notification method (pop-up, app, email, etc.)
Anchored VWAP by Time (Math by Thomas)📄 Description
This tool lets you plot an Anchored Volume Weighted Average Price (VWAP) starting from any specific date and time you choose. Unlike standard VWAPs that reset daily or weekly, this version gives you full control to track institutional pricing zones from precise anchor points—such as key swing highs/lows, market open, or news-driven candles.
It’s especially useful for price action and Smart Money Concepts (SMC) traders who track liquidity, fair value gaps (FVGs), and institutional zones.
🇮🇳 For NSE India Traders
You can anchor VWAP to Indian market open (e.g., 9:15 AM IST) or major events like RBI policy, earnings, or breakout candles.
The time input uses UTC by default, so for Indian Standard Time (IST), remember:
9:15 AM IST = 3:45 AM UTC
3:30 PM IST = 10:00 AM UTC
⚙️ How to Use
Add the indicator to your chart.
Open the settings panel.
Under “Anchor Start Time”, choose the date & time to begin the VWAP.
Use UTC format (adjust from IST if needed).
Customize the line color and thickness to suit your chart style.
The VWAP will begin plotting from that time forward.
🔎 Best Use Cases
Track VWAP from intraday range breakouts
Anchor from swing highs/lows to identify mean reversion zones
Combine with your FVGs, Order Blocks, or CHoCHs
Monitor VWAP reactions during key macro events or expiry days
🔧 Clean Design
No labels are used, keeping your chart clean.
Works on all timeframes (1min to Daily).
Designed for serious intraday & positional traders.

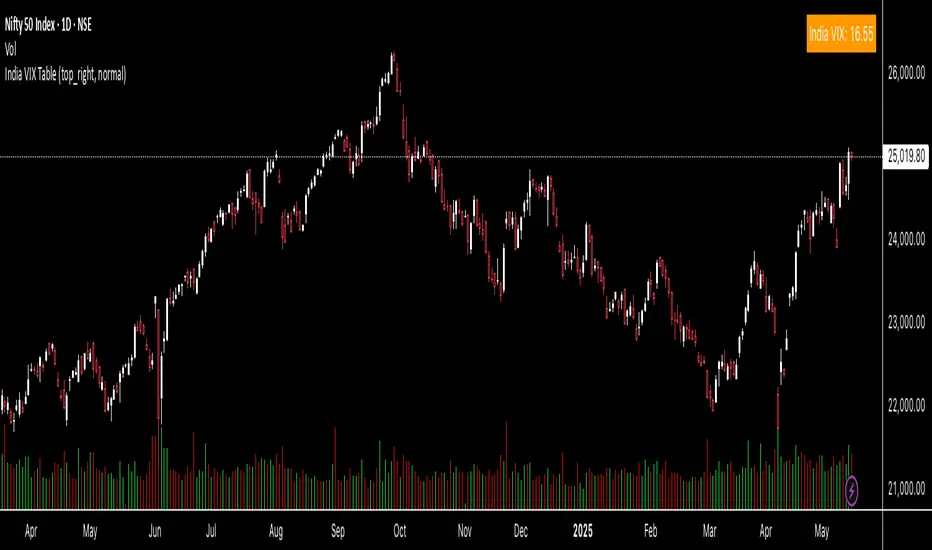
India VIX TableThis indicator gives you the India Vix value in real time on your chart. You can change the position on the chart as per your preference.
GEX and OI levelsIntroduction
Harness the power of institutional options flow analysis with the GEX & OI Levels indicator – an advanced tool that brings professional-grade options analytics directly to your TradingView charts. This comprehensive indicator visualizes Gamma Exposure (GEX) and Open Interest (OI) data, revealing hidden market forces that drive price action and potential reversal points. Designed for serious traders who understand that options positioning often precedes price movement.
What Is GEX & OI Levels?
GEX & OI Levels is a sophisticated indicator that analyzes options market positioning through the lens of dealer gamma exposure and open interest concentration. By visualizing where market makers must hedge their options positions, you can identify potential support/resistance levels, price magnets, and likely volatility zones. The indicator processes strike-by-strike options data to generate actionable insights about institutional positioning and potential price behavior.
Key Features
Complete Gamma Exposure Analysis
Dynamic GEX histogram showing dealer positioning at each strike
Visual identification of positive and negative gamma zones
Smoothed total GEX calculation with customizable parameters
Zero gamma level identification - critical price points where dealer behavior changes
Critical Price Level Identification
Gamma flip points that often act as magnets for price
Gamma walls where significant hedging activity may create support/resistance
Golden strike detection where both call and put OI show unusual concentration
Max pain calculation showing the price point where options expiration causes maximum loss
Dealer Positioning Intelligence
Analysis of dealer hedging requirements for price movements
Calculation of expected dealer behavior during rallies and dips
Signal strength indicators showing potential hedging impact
Delta-adjusted GEX for more accurate near-expiration analysis
Comprehensive Data Visualization
Highly configurable visualization of GEX histogram with logarithmic scaling
Strike-by-strike data table with color-coded gamma values
Top OI levels for both calls and puts with customizable highlighting
Detailed metrics panel showing all key GEX and options analytics
Use Cases
1. Identifying Potential Price Magnets
Gamma flip points often act as magnets for price, especially near expiration
Zero gamma levels show where dealer hedging pressure changes direction
Golden strikes reveal where both call and put sellers have significant exposure
2. Discovering Support & Resistance Zones
Gamma walls indicate where dealer hedging may create price barriers
Top OI levels often become psychological support/resistance points
Max pain level shows where options writers have incentive to push price
3. Predicting Market Volatility
Low GEX environments signal potential for increased volatility
High GEX environments typically lead to price compression and reduced volatility
Dealer positioning metrics indicate whether market makers are dampening or amplifying moves
4. Timing Market Reversals
Extreme dealer positioning often precedes market reversals
Proximity to flip points provides timing signals for potential turns
Signal strength measurement helps quantify the potential impact
5. Enhancing Trading Strategy
Align your trades with or against dealer hedging flows
Use dealer positioning analysis to set more precise stop losses and targets
Combine with technical analysis for high-probability trading setups
Customization Options
The indicator offers extensive customization capabilities:
Data Input & Configuration
CSV data input for option chain information
Adjustable DTE (Days To Expiration) settings
Risk-free rate and implied volatility parameters
Custom symbol formatting for different data providers
Calculation Settings
Gamma weight multiplier for sensitivity adjustment
Strike range limitations to focus on relevant price zones
Gamma scaling options based on strike distance
Static IV mode for environments without option price data
Visualization Options
Customizable histogram appearance including scale and transparency
Color settings for positive/negative GEX, flip points, and gamma walls
OI level display with configurable number of levels
Strike data table with adjustable strike count
Analytics Settings
Delta-adjusted GEX for improved accuracy
Dealer positioning analytics with hedge efficiency parameters
Alerting capabilities for price approaching key levels
Golden strike highlighting for significant option activity zones
How to Use
Apply the indicator to your chart
Input your options data in CSV format using the required structure
Configure the expiration date to match your analysis timeframe
Adjust gamma calculation parameters based on your instrument
Use the GEX histogram and key levels to identify potential price targets
Monitor dealer positioning metrics to anticipate market behavior
Trade with confidence knowing where institutional hedging activity is concentrated
Perfect for options traders, futures traders, swing traders, and anyone who wants to incorporate institutional-level options analysis into their technical trading strategy.
Elevate your trading with GEX & OI Levels - where options positioning reveals future price action.

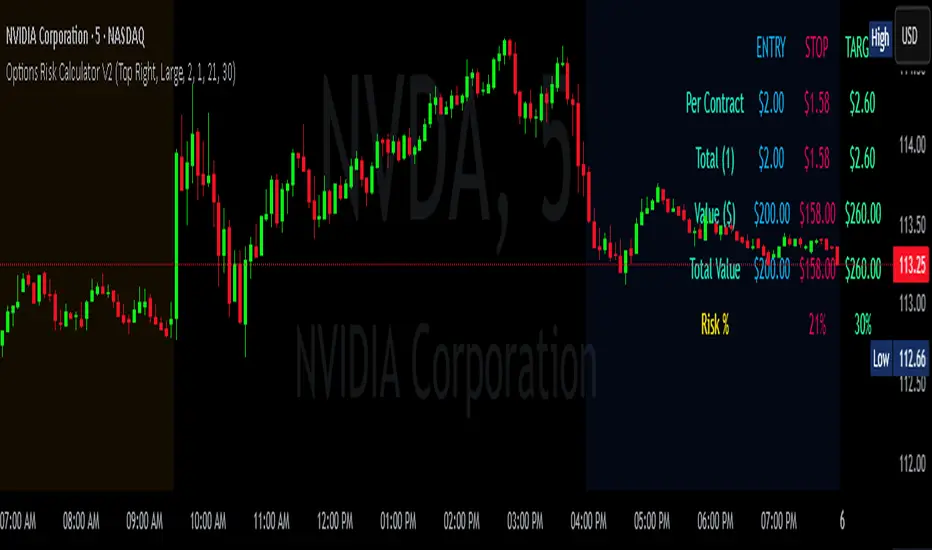
FRP Options Risk CalculatorThe Options Risk Calculator V1.0 is a fast, visual tool designed to help options traders evaluate position sizing, risk exposure, and profit targets in real-time.
🔹 Features:
- Contract-based entry price
- User-defined quantity, stop loss %, and take profit %
- Per-contract and total value breakdown
- Dynamic, color-coded table display
- Adjustable colors to match your theme
📘 How to Use:
1. Set your contract price (e.g. 2.50 = $250)
2. Enter how many contracts you’re buying
3. Set your Stop Loss % (e.g. 21%) and Target % (e.g. 30%)
4. View the on-screen table
→ It updates live with dollar values per contract and total risk/reward
⚠️ Note: This tool is for planning and visualization purposes only. It does not execute or suggest trades.
Source code is protected.
Funding Rate Signal TableDescription
Funding Rate Signal Table computes a rolling “funding rate” value (simulated here as (close–open)/close), smooths it, and presents both a compact on-chart table and clear LONG/SHORT entry signals. It helps you spot when funding dynamics may favor long or short positions and visualizes the last signal’s price level.
1. Why This Mashup?
Funding Rate Trend: A smoothed funding rate highlights shifts in trader funding costs—extremely negative rates can signal bullish opportunity, while very positive rates can warn of bearish pressure.
Difference Filter: Optional “difference” check prevents signals on noisy small changes, requiring a meaningful move before confirming.
Table & Labels: Side-by-side display of current funding rate, prior value, absolute change and text signal makes interpretation immediate. Simultaneous price-level lines reinforce real-time trade reference.
2. Default Parameters & Data Assumptions
Funding Calculation: (close – open) / close * 100, smoothed by a 14-period SMA plus 3-period SMA.
Thresholds:
LONG if funding_rate < –0.01%
SHORT if funding_rate > 0.01%
Optional “difference” threshold of 0.002 (0.2%)
Visuals:
Table positioned top-right with ticker, timeframe, funding values, difference, and signal.
Labels sized Normal by default, drawn just above/below price with optional price text.
Dashed horizontal lines extend 200 bars to mark last LONG/SHORT price.
Note: Because Pine Script cannot natively access actual exchange funding data, this example simulates funding rate. Replace the raw_funding_rate formula with your real funding-feed series for accurate signals.
3. How to Use
Add to Chart → Select “Rolin Long – Funding Rate & Sinyal Tablosu.”
Adjust Settings → Open the indicator’s Inputs:
Period & Smoothing for your instrument’s data frequency.
Thresholds based on historical funding ranges you observe.
Enable “Difference” filter to reduce false triggers.
Toggle Price Levels if you prefer lines marking entry prices.
Interpret Table →
“Funding Rate”: smoothed value for current bar.
“Previous Funding”: last bar’s value.
“Difference”: absolute change.
“Signal”: “LONG ▲ Şartları” or “SHORT ▼ Şartları” when thresholds are met.
Watch for Labels → On a new bar close, a singular LONG or SHORT label appears at the bar where the condition first became true.
Plan Entries/Exits → Use the price-level lines and your own risk rules to size and time trades.
4. Warnings & Disclaimer
This indicator is for educational purposes only. Simulated funding rate may differ from real exchange fees. Always verify with actual funding data, apply your own risk management, and adjust commissions/slippage to your trading environment. Past indicator signals do not guarantee future performance.

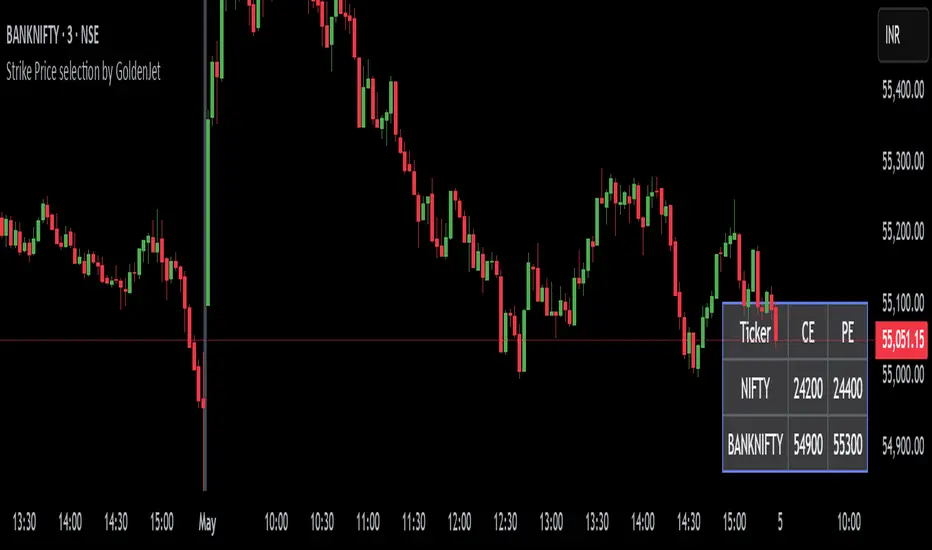
Strike Price selection by GoldenJetThis script is designed to assist options traders in selecting appropriate strike prices based on the latest prices of two financial instruments. It retrieves the latest prices, rounds them to the nearest significant value, and calculates potential strike prices for both call and put options. The results are displayed in a customizable table, allowing traders to quickly see the relevant strike prices for their trading decisions.
The strike prices shown are In-The-Money (ITM), which helps options traders in several ways:
Saving from Theta Decay: On expiry day, ITM options experience less time decay (Theta), which can help preserve the option's value.
Capturing Good Points: ITM options have a higher Delta, meaning they move more in line with the underlying asset's price. This can help traders capture a good amount of points as the underlying asset's price changes.
In essence, this tool simplifies the process of determining strike prices, making it easier for traders to make informed decisions and potentially improve their trading outcomes.
Binary Options Time/Price Entry HelperFor those who like to trade the Nadex 5 minute binary options.
✅ Features:
Marks the start of every 5-minute candle (HH:00, HH:05, HH:10, etc.)
Highlights price action signals:
Bullish Engulfing
Bearish Engulfing
Long rejection wicks (potential reversals)
Designed for 1-minute charts
Ideal for manual binary entries
Look for:
🔽 Gray markers: start of a 5-min cycle
🟩 CALL or 🟥 PUT: bullish or bearish engulfing
🟢 or 🟠 circles: strong rejection wicks
You can take off the 5 minute chart cycle markers and the rejection wick markers for a clean looking chart.
Jump in the trade when the call/put arrows appear. These can be fast moving trades. Be prepared to exit if need be. Nadex lets you exit at any time.
Example: if you enter a call around $75 you can get out at $50 if the trade goes against you. If you enter a put around $25 and the trade goes against you, exit at $50, or as close as possible. If you do this it will keep your rr close to 1:1 - this is VERY important for these trades.
I'm not responsible for how you do on these trades. I've only used it for EURUSD, but it works well. Test it on all the 5 minute binaries if you want and see what you think.
Don't wear yourself out on these. Nadex has 5 minute binaries continuously. Work at it for a couple hours and get good. You can collect the $25 premium several times a day. Just get out if it moves against you.

Multi-Timeframe EMAs with Cross Alerts (Up & Down)📌 Indicator Name:
Multi-Timeframe EMAs with Cross Alerts (Up & Down)
🛠️ Core Features:
✅ 1. Multi-Timeframe EMA Display
The script calculates and displays 6 different Exponential Moving Averages (EMAs).
Each EMA has:
Custom length input (e.g., 9, 21, etc.).
Custom timeframe selection (e.g., 1H, 4H, 1D).
Custom color for easy identification on the chart.
✅ 2. EMA Visualization
Each of the six EMAs is plotted on the chart using the selected color and thickness.
They respond dynamically to different timeframes (current or higher/lower).
✅ 3. Cross Detection Logic
The script can detect crossover and crossunder between EMA pairs:
EMA 1 and EMA 2
EMA 3 and EMA 4
EMA 5 and EMA 6
(Optional: can be extended to other combinations.)
✅ 4. Alert Toggles
Users can enable or disable alerts for each pair independently:
Alert: EMA 1 crosses EMA 2
Alert: EMA 3 crosses EMA 4
Alert: EMA 5 crosses EMA 6
(You added an additional option for EMA 4 vs EMA 6 later.)
✅ 5. Visual Alert Markers
The script uses alert() function to send alert messages when:
An EMA crosses above another (crossover)
An EMA crosses below another (crossunder)
Alerts include clear icons like 🔼 and 🔽 in the messages.
🔔 Use Case Scenarios
Swing traders: Identify longer-term cross signals on higher timeframes.
Scalpers: Use lower-timeframe EMAs with fast alert reactions.
Multi-timeframe analysis: Spot alignment between trend-following EMAs across different periods.
✅ Bonus
Fully customizable — great for adapting to your own strategy, whether it's trend confirmation, re-entry signals, or early reversals
📌 اسم المؤشر:
المتوسطات المتحركة الأسية (EMA) متعددة الفريمات مع تنبيهات تقاطع صاعدة وهابطة
🛠️ الميزات الأساسية:
✅ 1. دعم متعدد للفريمات الزمنية
يقوم السكربت بحساب وعرض 6 متوسطات متحركة أسية (EMA) مختلفة.
يمكن تخصيص كل EMA من حيث:
الطول (مثل: 9، 21...).
الفريم الزمني (مثل: الساعة، الأربع ساعات، اليومي...).
اللون، لتسهيل التمييز بين الخطوط على الشارت.
✅ 2. عرض المتوسطات على الرسم البياني
يتم رسم كل من المتوسطات الستة باستخدام اللون والتنسيق الذي تختاره.
المتوسطات تتفاعل تلقائيًا مع التغييرات في الفريم الزمني.
✅ 3. كشف التقاطعات
يمكن للسكربت كشف تقاطعات (صعودًا أو هبوطًا) بين أزواج المتوسطات التالية:
EMA 1 و EMA 2
EMA 3 و EMA 4
EMA 5 و EMA 6
(ويمكنك إضافة المزيد مثل EMA 4 مع EMA 6 حسب الحاجة)
✅ 4. التحكم في التنبيهات
يمكن للمستخدم تفعيل أو تعطيل التنبيهات لكل زوج من المتوسطات على حدة:
تنبيه عند تقاطع EMA 1 و EMA 2
تنبيه عند تقاطع EMA 3 و EMA 4
تنبيه عند تقاطع EMA 5 و EMA 6
(وأي أزواج إضافية يتم إضافتها لاحقًا)
✅ 5. تنبيهات مرئية برسائل واضحة
السكربت يرسل تنبيهات عبر وظيفة alert() عند حدوث:
تقاطع صاعد (EMA يتقاطع من الأسفل إلى الأعلى).
تقاطع هابط (EMA يتقاطع من الأعلى إلى الأسفل).
التنبيه يحتوي على رموز توضيحية مثل 🔼 و 🔽 ليسهل قراءته.
🎯 مناسب لـ:
المتداولين المتأرجحين (Swing Traders): لاكتشاف تقاطعات على الفريمات الكبرى.
المضاربين (Scalpers): باستخدام EMA سريعة على فريمات صغيرة مع تنبيهات فورية.
محللي الفريمات المتعددة: لتأكيد الاتجاه أو الانعكاس بناءً على تقاطع متوسطات من فريمات مختلفة.
✅ مزايا إضافية:
قابل للتخصيص بشكل كامل حسب استراتيجيتك.
مناسب لعدة أساليب: تأكيد الترند، إعادة الدخول، أو إشارات الانعكاس المبكر.

Binary Strategy (with SMI logic)🧠 How to Use:
Chart Timeframe: 5-minute
Setup: Wait for an arrow to appear
Green arrow = BUY a 20-min binary in uptrend with positive momentum
Red arrow = SELL a 20-min binary in downtrend with negative momentum
SMI Logic: Entry only when SMI crosses its signal line in the trend direction and above/below zero
Works for Nadex 20-Minute $&P 500 Binary
If long at 75 get out at 50, or if short at 25 get out at 50. This allow you to be trading at a 1:1 ratio. (Approx.)

Order Flow Delta Trackerorderflow manager where you
Delta bars: Show net buying/selling per candle.
Cumulative Delta: Helps identify hidden buying/selling pressure.
If price rises but cumulative delta falls → possible hidden selling (divergence).
If price falls but cumulative delta rises → hidden buying.

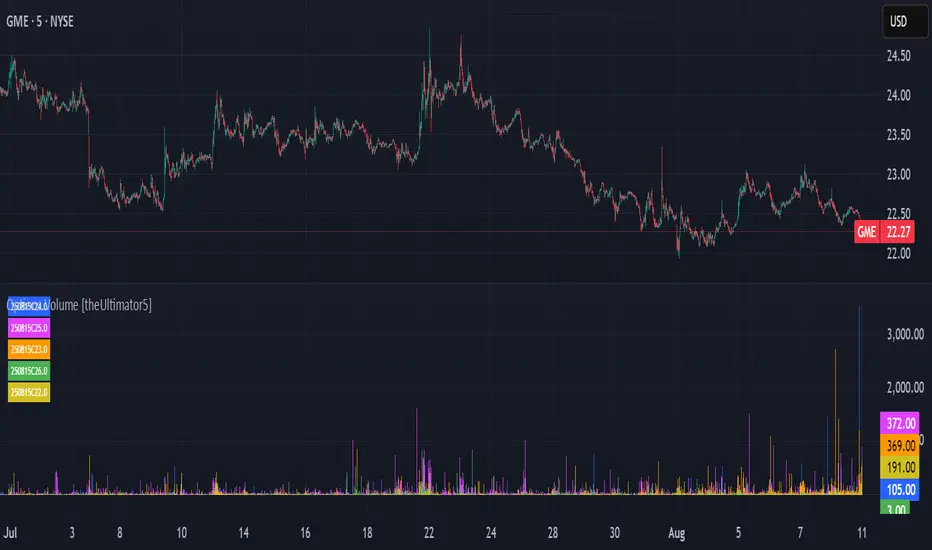
Options Volume [theUltimator5]📊 Option Volume — Multi-Strike Option Flow Visualizer
The Option Volume indicator tracks and visualizes volume activity for up to 10 custom option strike symbols on any ticker. It supports both individual strike analysis and a combined cumulative volume mode, providing an intuitive view of option flow across your selected strikes.
🔧 Features:
Dynamic Strike Control: Select up to 10 strikes and customize each with ticker, expiration date (YYMMDD), and option type (Call or Put).
Volume Display Modes:
🔹 Individual: Shows a separate volume bar for each strike.
🔸 Cumulative: Combines all selected strike volumes into a single bar, colored green for Calls and red for Puts.
Customizable Table Display:
Toggle the option symbol table on/off.
Position the table in any corner of the chart.
Table cell colors match plotted bars in Individual mode, or turn red/green in Cumulative mode based on option type.
Smart Volume Filtering: Only shows volume bars on the bar where volume updates (i.e., no carryover from stale bars).
Input Efficiency: All strike prices are automatically rounded to the nearest 0.5 increment for standardized symbol formatting.
⚙️ How to Use:
Select the ticker you want to analyze.
Input the expiration date and option type (C or P).
Define strike prices (up to 10).
Toggle between Individual or Cumulative volume display.
Adjust the number of visible strikes and table position as needed.
This tool is ideal for traders looking to monitor strike-level option volume behavior, spot flow anomalies, or keep track of high-interest strike activity in real-time.
The indicator currently doesn't support multiple expiration dates or a combination of calls/puts. If you want to view multiple expirations or a both calls and puts at the same time, simply add the indicator multiple times.
TraderFa Automatic FVGhe Fair Value Gap (FVG) indicator is a powerful technical analysis tool that identifies market inefficiencies by highlighting Fair Value Gaps across multiple timeframes. Discover key trading zones where institutions might be active—don’t miss your edge!
Introduction to the FVG Indicator
The Fair Value Gap indicator is designed to automatically detect areas of price imbalance—commonly referred to as Fair Value Gaps (FVGs)—directly on your chart. These zones occur when price moves aggressively in one direction, leaving behind a gap that represents a lack of order matching, and often becomes a magnet for future price action.
The concept is widely used by professional traders and is deeply rooted in liquidity-based analysis and institutional trading logic.
Key Features
Multi-timeframe FVG detection (up to 4 timeframes simultaneously):
Gain a layered perspective by monitoring price gaps on different timeframes all at once.
Automatic detection of bullish and bearish FVGs:
Highlighted zones where price surged or dropped too quickly—potential reaction areas.
Option to display or hide mitigated gaps:
You can choose to keep showing gaps that have already been filled or remove them from view.
Custom color settings for each timeframe:
Assign different colors for bullish and bearish gaps in each timeframe for better visual clarity.
How the Indicator Works
Utilizing the capabilities of Pine Script, the indicator fetches data such as high, low, open, and time from higher timeframes and compares it with current candles to detect valid FVGs.
The detection logic is based on:
A bullish FVG forms when the low of the current candle is higher than the high of two candles ago.
A bearish FVG forms when the high of the current candle is lower than the low of two candles ago.
These gaps are then visualized using boxes and labels, and updated or removed depending on whether the price has returned to fill the gap.
Use Cases in Trading
Reveal hidden liquidity zones:
Institutional traders often place orders around FVGs. Identifying these can help pinpoint high-probability entries.
Set precise entry, exit, or target zones:
Use gaps to identify potential reversal or continuation zones with minimal risk exposure.
Optimize multi-timeframe confluence:
Seeing FVGs from various timeframes simultaneously allows you to discover overlapping zones—excellent for timing trades with confidence.
Customizable Settings :
Enable/disable each of the four timeframes independently
Select your desired timeframe for each layer
Pick unique colors for bullish and bearish gaps
Show or hide mitigated (filled) gaps based on strategy
F inal Thoughts
The FVG indicator is a refined, high-precision tool built for traders who use price action and liquidity principles. Whether you're scalping or trading swing setups, this indicator offers an edge by visually representing inefficiencies in price—helping you anticipate where price is likely to react.
Ready to see the market through the lens of institutional behavior? Add the FVG indicator to your chart today and start spotting the gaps that really matter.

Options Volume ProfileOptions Volume Profile
Introduction
Unlock institutional-level options analysis directly on your charts with Options Volume Profile - a powerful tool designed to visualize and analyze options market activity with precision and clarity. This indicator bridges the gap between technical price action and options flow, giving you a comprehensive view of market sentiment through the lens of options activity.
What Is Options Volume Profile?
Options Volume Profile is an advanced indicator that analyzes call and put option volumes across multiple strikes for any symbol and expiration date available on TradingView. It provides a real-time visual representation of where money is flowing in the options market, helping identify potential support/resistance levels, market sentiment, and possible price targets.
Key Features
Comprehensive Options Data Visualization
Dynamic strike-by-strike volume profile displayed directly on your chart
Real-time tracking of call and put volumes with custom visual styling
Clear display of important value areas including POC (Point of Control)
Value Area High/Low visualization with customizable line styles and colors
BK Daily Range Identification
Secondary lines marking significant volume thresholds
Visual identification of key strike prices with substantial options activity
Value Area Cloud Visualization
Configurable cloud overlays for value areas
Enhanced visual identification of high-volume price zones
Detailed Summary Table
Complete breakdown of call and put volumes per strike
Percentage analysis of call vs put activity for sentiment analysis
Color-coded volume data for instant pattern recognition
Price data for both calls and puts at each strike
Custom Strike Selection
Configure strikes above and below ATM (At The Money)
Flexible strike spacing and rounding options
Custom base symbol support for various options markets
Use Cases
1. Identifying Key Support & Resistance
Visualize where major options activity is concentrated to spot potential support and resistance zones. The POC and Value Area lines often act as magnets for price.
2. Analyzing Market Sentiment
Compare call versus put volume distribution to gauge directional bias. Heavy call volume suggests bullish sentiment, while heavy put volume indicates bearish positioning.
3. Planning Around Institutional Activity
Volume profile analysis reveals where professional traders are positioning themselves, allowing you to align with or trade against smart money.
4. Setting Precise Targets
Use the POC and Value Area High/Low lines as potential profit targets when planning your trades.
5. Spotting Unusual Options Activity
The color-coded volume table instantly highlights anomalies in options flow that may signal upcoming price movements.
Customization Options
The indicator offers extensive customization capabilities:
Symbol & Data Settings : Configure base symbol and data aggregation
Strike Selection : Define number of strikes above/below ATM
Expiration Date Settings : Set specific expiry dates for analysis
Strike Configuration : Customize strike spacing and rounding
Profile Visualization : Adjust offset, width, opacity, and height
Labels & Line Styles : Fully configurable text and visual elements
Value Area Settings : Customize POC and Value Area visualization
Secondary Line Settings : Configure the BK Daily Range appearance
Cloud Visualization : Add colored overlays for enhanced visibility
How to Use
Apply the indicator to your chart
Configure the expiration date to match your trading timeframe
Adjust strike selection and spacing to match your instrument
Use the volume profile and summary table to identify key levels
Trade with confidence knowing where the real money is positioned
Perfect for options traders, futures traders, and anyone who wants to incorporate institutional-level options analysis into their trading strategy.
Take your trading to the next level with Options Volume Profile - where price meets institutional positioning.

Unusual Whale - Unusual Options Volume Data ScreenerHow to Use:
Custom Expiration Date: Use the calendar/date picker to select the expiration date. The chosen date is automatically converted to the "YYMMDD" format.
Custom Base Strike: Enter a round strike value from the options chain (for example, "270"). This value serves as the starting point (at-the-money) for the scan.
Strike Increment: Select the increment (e.g., 0.50, 1.00, 2.5, 5, or 10) to determine how the scan moves outward from the custom base strike.
Options per Side (Max 20): Choose the number of valid option strikes to scan on each side. The script scans downward (for calls) and upward (for puts) from the custom base strike.
Base Symbol: The base symbol is always taken from the chart (using syminfo.ticker); no manual entry is needed.
Scanning & Aggregation: The script automatically constructs option symbols using the base symbol, custom expiration date, option type (C or P), and the formatted strike. It retrieves volume data for these options and aggregates the cumulative volume for calls and puts separately.
Plotting: Cumulative call volume is plotted in green, and cumulative put volume is plotted in red—only if the required number of valid options is found.
Benefits of Scanning Options Volume for Unusual Activity:
Offers a comprehensive view of volume across multiple strikes, making unusual or extreme volume patterns easier to detect.
Helps gauge market sentiment by comparing aggregated call and put volumes, which may signal shifts in investor behavior.
Aggregating volume from several strike levels provides smoother, more reliable data than using a single strike, enhancing your analytical insights.
What to Do If Combinations Don't Yield Results:
Verify Your Inputs: Ensure that the Custom Base Symbol, Expiration Date, and Custom Base Strike are entered correctly and correspond to an active options chain.
Adjust Strike Increment: If the options aren’t loading as expected, try selecting a different strike increment that more closely matches the spacing in your options chain.
Reduce Options per Side: Lower the number of Options per Side (e.g., from 20 to a lower value) if the scan fails to find enough valid strikes.
Review Your Options Chain: Confirm that the contracts for the specified expiration and strike range exist and are available in your data feed.
Check Data Subscription: Make sure your TradingView plan includes access to the options data required for the selected symbols.
Cumulative Call Volume is Green, Put Volume is Red
Gann Percentage of High & Low Prices for Options - Keanu_RiTzThis Indicator is based on the text from Chapter 4 "Percentage of High & Low Prices" page number "30" from the book "WD Gann 45 years in Wall Street".
This Indicator is to be used on Intraday Timeframes and only on Options Charts (CALL & PUT) and not on any other chart.
The following is the text from that page :-
One of the greatest discoveries I ever made was how to figure the percentage of high and low prices on the averages and individual stocks.
The percentages of extreme high and low levels indicate future resistance levels.
There is a relation between every low price to some future high price and a percentage of the low price indicates what levels to expect the next high price.
At this price you can sell out long stocks and sell short with a limited risk.
The extreme high price or any minor tops are related to future bottoms er low levels.
The percentage of the high price tells where to expect low prices in the future and gives you resistance levels where you can buy with a limited risk.
The most important resistance level is 50% of any high or low price.
Second in importance is 100% on the lowest selling price on the averages or individual stocks.
You must also use 200%, 300%, 400%, 500%, 600% or more, depending upon the price and the Time Periods from High and Low.
Third in importance is 25% of the Lowest price or the Highest price.
Fourth in importance is 121/2% of the extreme Low or extreme High price.
Fifth in importance is 61/4% of the Highest price, but this is only to be used when the averages or individual stocks are selling at very high levels.
Sixth in importance is 33 1/3 and 66 2/3%. These percentages should be calculated and watched for resistance next after 25% and after 50%.
You should always have percentage tables made up on the Industrial Averages and on the individual stocks you trade in in order to know where these important resistance levels are located.
Description :
It plots the Intraday % levels from the highest high and lowest low of that day.
The calculation of these levels is based on the text from Chapter 4 "Percentage of High & Low Prices" page number "30" from the book "WD Gann 45 years in Wall Street".
I developed this indicator to see if those percentages work on Options prices or not,
and from my observation I found that it works wonderfully in Options as well.
These % levels work like magic and act as great Dynamic Support and Resistance levels.
Don't trust my words blindly and see for yourself.
This indicator is for educational and research purpose only.
It does not provide any BUY/SELL signals.

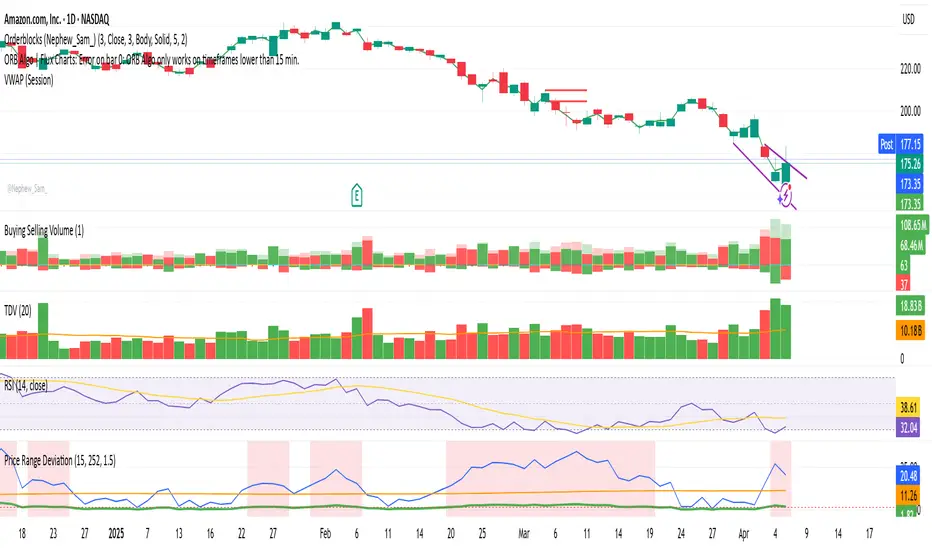
Price Range Deviation📌 Description: Price Range Deviation Indicator
This indicator measures how much a stock has moved over a recent period (e.g., 15 days) and compares that move to the average move of similar-length windows over a longer lookback period (e.g., 1 year or 252 days).
It helps identify when a stock has made an unusually large move compared to its historical norm — which can signal that the move is overextended.
📊 How It Works:
Recent Move ($): The absolute price change over the selected recent period.
Average Move ($): The average absolute price change over rolling windows of the same size across the full lookback period.
Move Ratio: The current move divided by the average move.
When the move ratio exceeds a custom threshold (e.g., 1.5× the average), the background highlights red to signal that the move is unusually large.
💡 Use Case:
Ideal for options traders looking to:
Identify overextended price moves
Sell out-of-the-money calls or puts beyond a high-move zone
Fade price exhaustion with high probability setups
Daily OHLC from 8:00 UTCDisplays Daily Open, High, and Low price levels, resetting at 8:00 AM UTC each day. Ideal for intraday trading reference points.

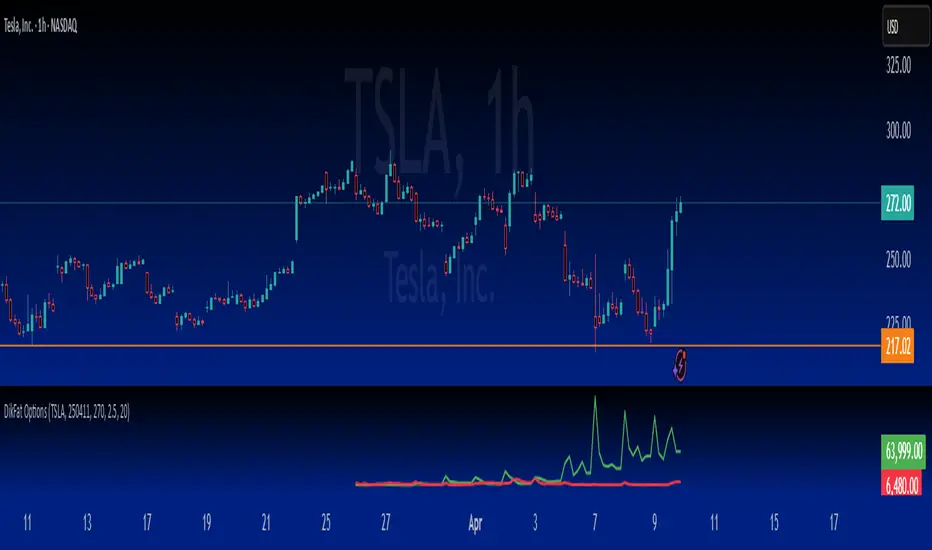
Options Chart Lite [Pt]█ Options Chart Lite
────────────────────────────
█ Introduction
Options Chart Lite is a simplified version of the full Options Chart+ tool — created for traders who want a clean and easy way to visualize option volume around price without extra complexity.
It displays live call and put volume and pricing directly on your TradingView chart, centered around the most relevant strikes for the selected expiry.
────────────────────────────
█ What Is Options Chart Lite ?
Options Chart Lite is a tool that shows real-time call and put activity in a clean, strike-by-strike table.
It provides:
- Side-by-side call/put volume and pricing
- Live table centered on current price
- Total call and put volume summary
- Quick insight into flow without overlays or clutter
────────────────────────────
█ Key Features
Visual Option Table
- Volume and price for calls and puts
- Table auto-centers around current price
- Up to 20 strikes shown
Total Volume Summary
- Call vs put volume shown at the bottom
Formatted Expiry + Timeframe
- Full expiry display (e.g. “Fri Apr 11, 2025”)
- Fixed to 1D timeframe
Reset & Warnings
- Button to reset strike range
- Optional delayed data notice
────────────────────────────
█ Inputs
Option Expiry Date (YYMMDD): Must match a valid expiry
Strike Increment: Strike spacing (e.g., 1, 2.5, 5)
Reference Strike Denominator: Rounds price to valid strike
Font Size Option: Choose Auto, Tiny, Small, or Normal
Reset Button: Re-centers if price moves
Delayed Data Warning: Toggle display of warning
────────────────────────────
█ Use Cases
Spot Key Strikes
See which strikes have the most activity.
Quick Flow Insights
Volume bias without opening an option chain.
Prep Levels
Align price action with strike flow.
Volume Skew Snapshot
Check if calls or puts dominate.
────────────────────────────
█ Known Limitations
- Invalid Expiry or Strike Inputs Will Error
Inputs must match real listed options for the symbol.
- Options Data Must Be Available
Volume will appear as 0 if TradingView data isn’t accessible.
- Strike Range is Limited
Script renders ~20 strikes. Use Reset Indicator if price moves too far.

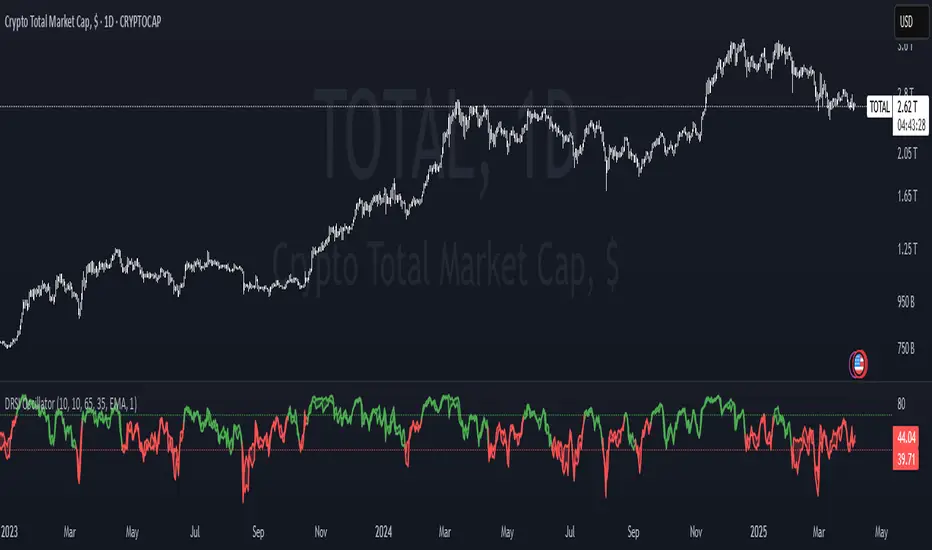
Double RSI OscillatorThe Double RSI Oscillator
Hello Gs,
I came back from the dead and tried to see what a little tweak to RSI could do, and I think it is quite interesting and might be worth checking out.
Warning:
This indicator has lots of false signals unfortunatly
How does the DRSI Oscillator work?
Very simple, the DRSI oscillator at the very base is just 2 RSIs that should smooth each other out, making a smoother trend signal generation for trend analysis. One RSI is set to have lower values, by considering the lowest point of the price, and one RSI is set to have higher values using pretty much the same thing. The trend changes from positive to negative if RSI with higher values crosses negative treshhold, and from negative to positive if RSI with lower value crosses positive treshhold. On top of this I added some additional settings to smooth or speed it further, if these were a good idea, I guess only time will tell :D.
Settings
Here is a guide of what setting changes what and how it might be suitable for you:
RSI Optimism length: length of the RSI with higher values (higher values will be better for longer term, lower for medium term)
RSI Pesimism length: length of the RSI with lower values (higher values will be better for longer term, lower for medium term)
Positive treshhold: The value RSI pesimism needs to pass in order to change trends (in case of using RSI avg. the value the average needs to pass), making this higher can give you faster signals, but expect more false ones
Negative treshholds: The value RSI optimism needs to pass in order to change trends (in case of using RSI avg. the value the average needs to pass), lowering this can give you faster signals, but expect more false ones
Smoothing type: Select the type of smoothing (or none) to smooth your signals as you want, this one you need to play around with.
Smoothing length: The length of your smoothing method (if none is selected it wont change anything)
Use RSI average instead: self-explanatory, go figure
Above/Below Mean Trend: Changes the way trend logic works
Why consider using this indicator?
The DRSI Oscillator is a tool that has huge flexibility (due to tons of settings that base RSI doesnt, like trend treshholds), and is smoother allowing traders and investors to get high quality or high speed signals, allowing great entries and exits
Option Contract Size CalculatorOption Contract Size Calculator
This indicator helps you to figure out the ideal number of contracts for your trade and its only used for options day trading.
The indicator needs to fill the input section in order to give you the information table that includes Contract size .
The input section consists of two sections. The first section requires user entry of the delta of the options contract from the broker chain and the stop loss size on the chart.
The second section allows you to enter your account balance and risk per trade
(2% recommended) .
There is also the option for where you wish to display your table like bottom right , bottom left or top right, top left.
special thanks to @Mohamedawke for the open source script this code is based off
