FVG [Stansbooth]Fair Value Gap (FVG) Indicator
Spot Institutional Imbalances. Trade the Rebalance.
Fair Value Gaps reveal where price moved so aggressively that it left behind untraded zones—areas where smart money is likely to return.
What It Detects
Bullish FVG : Gap between Candle 1's high and Candle 3's low — expect price to retrace here for longs
Bearish FVG : Gap between Candle 1's low and Candle 3's high — watch for shorts on the pullback
Why Traders Love It
Markets hate inefficiency. When price rockets through a zone without proper auction, it creates a magnet for future price action. This indicator automatically identifies these imbalances so you can anticipate high-probability reversal and continuation zones.
Features
Auto-detection of bullish and bearish FVGs
Customizable gap visualization
Works on all timeframes and instruments
Clean, non-repainting logic
Best Used With
Order blocks, liquidity sweeps, and market structure breaks for confluence-based entries aligned with ICT and smart money concepts.
Trade where institutions trade. Let price come to you.
Orderblocks

QuantMotions - FVG with Volume TrackingFair Value Gap Detector with Dynamic Shrinking & Volume Analysis
Overview
Advanced Fair Value Gap (FVG) detection indicator with real-time box shrinking and volume delta analysis. Automatically identifies price inefficiencies and tracks institutional volume flow within each gap.
What are Fair Value Gaps?
Fair Value Gaps occur when price moves so rapidly that a "gap" is left between three consecutive candles, creating an inefficiency where no trading occurred. These gaps often act as support/resistance zones that price tends to revisit.
Detection:
- Bullish FVG: When low > high (upward price inefficiency)
- Bearish FVG: When high < low (downward price inefficiency)
Key Features
Dynamic Box Shrinking
FVG boxes automatically shrink as price enters them:
- Bullish FVGs shrink from top as price moves down into the gap
- Bearish FVGs shrink from bottom as price moves up into the gap
- Provides precise visualization of remaining unfilled gap area
Volume Delta Analysis
Tracks volume characteristics for the 3-candle FVG formation:
- Total Volume: Sum of volume from all three FVG candles
- Up/Down Split: Separates buying vs selling pressure
- Delta %: Shows directional bias of volume flow
- Color Coding: Green/Red when volume confirms direction, Orange when it doesn't
Smart Filtering
- ATR-based minimum gap size - Filters out insignificant noise gaps
- Auto-cleanup - Removes fully filled FVGs automatically
- Maximum display limit - Keeps charts clean by limiting visible FVGs
Live Statistics
Real-time stats table showing:
- Active bullish/bearish FVG count
- Average volume delta for each direction
- Fill progress tracking
Settings
Min Gap Size (ATR): Minimum gap size as multiple of ATR(14). Default: 0.3
- Lower values (0.1-0.3): More sensitive, shows smaller gaps
- Higher values (0.5-1.0): More selective, only significant gaps
Max FVGs: Maximum number of FVG boxes to display (5-100)
Remove Fully Filled: Automatically remove FVGs when price completely fills them
Shrink on Partial Fill: Enable dynamic box shrinking as price enters gaps
Show Volume Info: Display volume delta labels at box edges
How to Use
1. Confluence Trading: Look for FVGs that align with your support/resistance levels
2. Volume Confirmation: Check volume delta - strong directional volume increases probability
3. Partial Fills: Watch for price reactions at shrinking FVG boundaries
4. Multiple Timeframes: Use on higher timeframes (4H+) for swing trading, lower timeframes for scalping
Best Practices
- Combine with trend analysis - FVGs in trend direction have higher fill rates
- Pay attention to volume delta - gaps with confirming volume are more reliable
- Use on liquid markets for accurate volume data
- Higher timeframe FVGs typically carry more significance
Notes
- Works on all timeframes and instruments
- Volume data accuracy depends on your data provider
- FVGs are not guaranteed support/resistance - use proper risk management
- This indicator shows historical inefficiencies, not future predictions
Disclaimer: This indicator is for educational purposes only. Past performance does not guarantee future results. Always use proper risk management.

The 'Qualified' POI Scorer [PhenLabs]📊 The “Qualified” POI Scorer (Q-POI)
Version: PineScript™ v6
📌 Description
The “Qualified” POI Scorer helps intermediate traders overcome "analysis paralysis" by filtering Smart Money Concepts (SMC) structures based on their probability. Instead of flooding your chart with every possible Order Block, this script assigns a proprietary “Quality Score” (0-100) to each zone. It analyzes the strength of the displacement, the presence of imbalances (FVG), and liquidity mechanics to determine which zones are worth your attention. It is designed to clean up your charts and enforce discipline by visually fading out low-quality setups.
🚀 Points of Innovation
Dynamic “Glass UI” Transparency that automatically fades weak zones based on their score.
Proprietary Scoring Algorithm (0-100) based on three distinct institutional factors.
Visual Icon System that prints analytical context (💧— 🚀/🐌—🧱) directly on the chart.
Automated Mitigation Tracking that changes the visual state of zones after they are tested.
Displacement Velocity calculation using ATR to verify institutional intent.
🔧 Core Components
Liquidity Sweep Engine: Detects if a pivot point grabbed liquidity from the previous X bars before reversing.
FVG Validator: Checks if the move away from the zone created a valid Fair Value Gap.
Momentum Scorer: Calculates the size of the displacement candle relative to the Average True Range (ATR).
🔥 Key Features
Quality Filtering: Automatically hides or dims zones that score below 50 (user configurable).
State Management: Zones turn grey when mitigated and delete themselves when invalidated.
Visual Scorecard: Displays the exact numeric score on the zone for quick decision-making.
Time-Decay Logic: Keeps the chart clean by managing the lifespan of old zones.
🎨 Visualization
High Score Zones (80-100): Display as bright, semi-solid boxes indicating high probability.
Medium Score Zones (50-79): Display as translucent “glass” boxes.
Low Score Zones (<50): Display as faint “ghost” boxes or are completely hidden.
Rocket Icon (🚀): Indicates high momentum displacement.
Snail Icon (🐌): Indicates low momentum displacement.
Drop Icon (💧): Indicates the zone swept liquidity.
Brick Icon (🧱): Indicates the zone is supported by an FVG.
📖 Usage Guidelines
Swing Structure Length (Default: 5): Controls the sensitivity of the pivot detection; lower numbers create more zones, higher numbers find major swing points.
ATR Length (Default: 14): Determines the lookback period for calculating relative momentum.
Minimum Quality Score (Default: 50): The threshold for which zones are considered “valid” enough to be fully visible.
Bullish/Bearish Colors: Fully customizable colors that adapt their own transparency based on the score.
Show Weak Zones (Default: False): Toggles the visibility of zones that failed the quality check.
✅ Best Use Cases
Filtering noise during high-volatility sessions by focusing only on Score 80+ zones.
Confirming trend continuation entries by looking for the Rocket (🚀) momentum icon.
Avoiding “stale” zones by ignoring any box that has turned grey (Mitigated).
⚠️ Limitations
The indicator is reactive to closed candles and cannot predict news-driven spikes.
Scoring is based on technical structure and does not account for fundamental drivers.
In extremely choppy markets, the ATR filter may produce lower scores due to lack of displacement.
💡 What Makes This Unique
It transforms subjective SMC analysis into an objective, quantifiable score.
The visual hierarchy allows traders to assess chart quality in milliseconds without reading data.
It integrates three separate SMC concepts (Liquidity, Imbalance, Structure) into a single tool.
🔬 How It Works
Step 1: The script identifies a Swing High or Low based on your length input.
Step 2: It looks backward to see if that swing swept liquidity, and looks forward to check for an FVG and displacement.
Step 3: It calculates a weighted score (30pts for Sweep, 30pts for FVG, 40pts for Momentum).
Step 4: It draws the zone with a transparency level designated by the score and appends the relevant icons.
💡 Note:
For the best results, use this indicator on the timeframe you execute trades on (e.g., 15m or 1h). Do not use it to find entries on the 1m chart if your analysis is based on the 4h chart.

Smart Money Concepts [Riz]Smart Money Concepts is a comprehensive technical analysis tool for identifying institutional trading patterns and market structure. This indicator combines Smart Money Concepts (SMC), ICT methodology, and Wyckoff principles into one professional tool.
✨ KEY FEATURES
📊 VOLUMETRIC ORDER BLOCKS
• Visual representation of supply/demand zones with volume distribution
• Horizontal volume bars showing buy/sell composition inside each Order Block
• Automatic mitigation tracking
• Breaker Block detection (invalidated OBs acting as reversal zones)
• Strength rating system: ★ Weak, ★★ Medium, ★★★ Strong
• ATR-based size filtering to show only significant zones
📈 MARKET STRUCTURE DETECTION
• Break of Structure (BOS) and Change of Character (CHoCH) identification
• Higher Highs (HH), Higher Lows (HL), Lower Highs (LH), Lower Lows (LL) labels
• Internal structure pivots (iH/iL) for intraday analysis
• Auto-adjusting swing length based on timeframe
• Configurable confirmation methods (Close vs Wick-based)
💎 FAIR VALUE GAPS (FVG)
• Automatic detection of bullish and bearish imbalances
• Configurable mitigation percentage (default 50%)
• Visual tracking until gaps are filled
• Separate color schemes for clarity
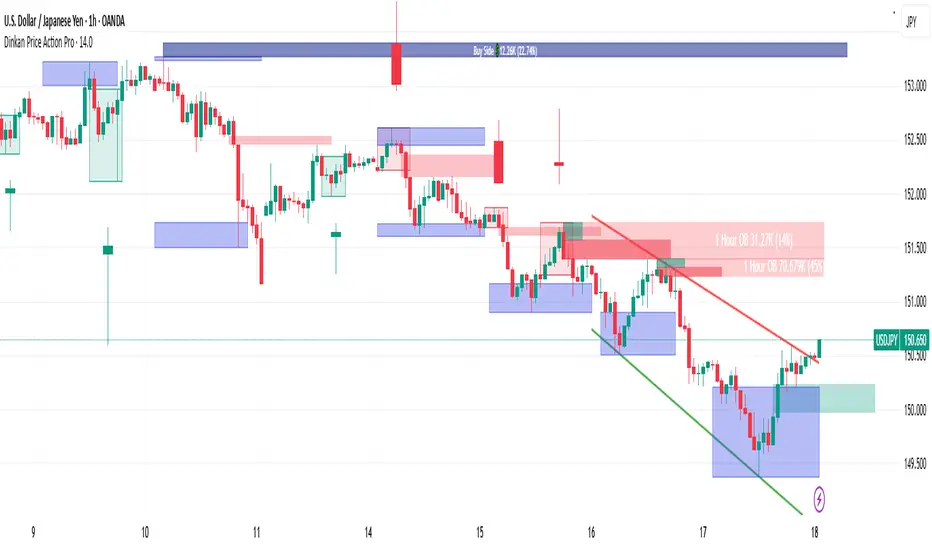
💧 LIQUIDITY ANALYSIS
• Buy Side Liquidity (BSL) identification at swing highs
• Sell Side Liquidity (SSL) identification at swing lows
• Automatic sweep detection with visual confirmation
• Real-time alerts when liquidity is taken
⚖️ PREMIUM & DISCOUNT ZONES
• Dynamic range calculation based on configurable lookback period
• Equilibrium (EQ) level identification
• Previous Day High (PDH) and Previous Day Low (PDL) levels
• Helps identify favorable entry zones
📊 REAL-TIME DASHBOARD
• Live statistics on all detected patterns
• Active Order Blocks and FVGs count
• BOS/CHoCH occurrence tracking
• Liquidity sweep counters
• Recent market activity indicators
• Current trend bias display
• Fully customizable position and size
⚙️ CUSTOMIZATION OPTIONS
All aspects are fully customizable:
• Swing Length (1-50 bars) with auto-adjust for timeframe
• Max Active Order Blocks (10-100)
• Volume bar position (Left/Right) with mirror option
• Volume bar width percentage (10-50%)
• ATR size filter for Order Blocks
• Strength rating method (Touches/Age/Distance/Volume/Combined)
• All colors and transparency levels
• Dashboard position (9 locations available)
• Comprehensive alert system for all events
🎓 HOW IT WORKS
ORDER BLOCKS: Identified at the last candle before a Break of Structure. These represent institutional supply and demand zones. Volume is estimated based on candle characteristics and displayed as horizontal bars.
MARKET STRUCTURE: Tracks pivot highs and lows to determine if price is making Higher Highs/Higher Lows (bullish structure) or Lower Highs/Lower Lows (bearish structure). BOS indicates trend continuation, while CHoCH signals potential trend reversal.
LIQUIDITY: Swing highs represent Buy Side Liquidity where short positions have their stop losses. Swing lows represent Sell Side Liquidity where long positions have stop losses. The indicator tracks when these levels are "swept" by price.
FAIR VALUE GAPS: Three-candle patterns where the current candle's range doesn't overlap with the candle two bars ago, creating price imbalances that often get filled later.
📚 BEST PRACTICES
• Use on all timeframes - Auto-adjust feature optimizes settings automatically
• Look for confluence - Best setups occur when multiple concepts align (e.g., Order Block + liquidity sweep + discount zone)
• Consider risk/reward - Use Premium/Discount zones to identify favorable entry areas
• Respect market context - Order Blocks in the direction of overall trend tend to be more reliable
• Volume matters - Higher volume percentages in the expected direction may indicate stronger zones
⚠️ IMPORTANT NOTES
EDUCATIONAL TOOL: This indicator is designed for analysis and education, not as trading signals or investment advice.
VOLUME ESTIMATION: Buy/sell volume distribution is estimated based on candle characteristics since true buy/sell volume data is not available in Pine Script.
NO GUARANTEES: Past performance is not indicative of future results. All trading involves substantial risk.
RISK MANAGEMENT: Always use proper risk management and seek additional confirmation before making trading decisions.
OBJECT LIMITS: On very fast timeframes (1m, 5m) in highly volatile markets, the indicator may approach Pine Script's 500-object limit. Reduce max OBs/FVGs in settings if needed.
🔧 TECHNICAL SPECIFICATIONS
• Pine Script Version: v6
• Indicator Type: Overlay (displays on price chart)
• Maximum Objects: Optimized to stay within Pine Script limits
• Performance: Efficient rendering with configurable history management
• Updates: Real-time on every bar close
📖 METHODOLOGY
This indicator combines concepts from:
• Inner Circle Trader (ICT) methodology
• Smart Money Concepts (SMC) framework
• Wyckoff market analysis principles
• Order flow and volume spread analysis
⚖️ DISCLAIMER
This indicator is for educational and informational purposes only. It is not financial advice. Trading financial instruments carries substantial risk and may not be suitable for all investors. Past performance is not indicative of future results. Always conduct your own research and consult with a licensed financial advisor before making any investment decisions. The author assumes no responsibility for any losses incurred from using this indicator.

Quantum Market Analyzer X7Quantum Market Analyzer X7 - Complete Study Guide
Table of Contents
1. Overview
2. Indicator Components
3. Signal Interpretation
4. Live Market Analysis Guide
5. Best Practices
6. Limitations and Considerations
7. Risk Disclaimer
________________________________________
Overview
The Quantum Market Analyzer X7 is a comprehensive multi-timeframe technical analysis indicator that combines traditional and modern analytical methods. It aggregates signals from multiple technical indicators across seven key analysis categories to provide traders with a consolidated view of market sentiment and potential trading opportunities.
Key Features:
• Multi-Indicator Analysis: Combines 20+ technical indicators
• Real-Time Dashboard: Professional interface with customizable display
• Signal Aggregation: Weighted scoring system for overall market sentiment
• Advanced Analytics: Includes Order Block detection, Supertrend, and Volume analysis
• Visual Progress Indicators: Easy-to-read progress bars for signal strength
________________________________________
Indicator Components
1. Oscillators Section
Purpose: Identifies overbought/oversold conditions and momentum changes
Included Indicators:
• RSI (14): Relative Strength Index - momentum oscillator
• Stochastic (14): Compares closing price to price range
• CCI (20): Commodity Channel Index - cycle identification
• Williams %R (14): Momentum indicator similar to Stochastic
• MACD (12,26,9): Moving Average Convergence Divergence
• Momentum (10): Rate of price change
• ROC (9): Rate of Change
• Bollinger Bands (20,2): Volatility-based indicator
Signal Interpretation:
• Strong Buy (6+ points): Multiple oscillators indicate oversold conditions
• Buy (2-5 points): Moderate bullish momentum
• Neutral (-1 to 1 points): Balanced conditions
• Sell (-2 to -5 points): Moderate bearish momentum
• Strong Sell (-6+ points): Multiple oscillators indicate overbought conditions
2. Moving Averages Section
Purpose: Determines trend direction and strength
Included Indicators:
• SMA: 10, 20, 50, 100, 200 periods
• EMA: 10, 20, 50 periods
Signal Logic:
• Price >2% above MA = Strong Buy (+2)
• Price above MA = Buy (+1)
• Price below MA = Sell (-1)
• Price >2% below MA = Strong Sell (-2)
Signal Interpretation:
• Strong Buy (6+ points): Price well above multiple MAs, strong uptrend
• Buy (2-5 points): Price above most MAs, bullish trend
• Neutral (-1 to 1 points): Mixed MA signals, consolidation
• Sell (-2 to -5 points): Price below most MAs, bearish trend
• Strong Sell (-6+ points): Price well below multiple MAs, strong downtrend
3. Order Block Analysis
Purpose: Identifies institutional support/resistance levels and breakouts
How It Works:
• Detects historical levels where large orders were placed
• Monitors price behavior around these levels
• Identifies breakouts from established order blocks
Signal Types:
• BULLISH BRK (+2): Breakout above resistance order block
• BEARISH BRK (-2): Breakdown below support order block
• ABOVE SUP (+1): Price holding above support
• BELOW RES (-1): Price rejected at resistance
• NEUTRAL (0): No significant order block interaction
4. Supertrend Analysis
Purpose: Trend following indicator based on Average True Range
Parameters:
• ATR Period: 10 (default)
• ATR Multiplier: 6.0 (default)
Signal Types:
• BULLISH (+2): Price above Supertrend line
• BEARISH (-2): Price below Supertrend line
• NEUTRAL (0): Transition period
5. Trendline/Channel Analysis
Purpose: Identifies trend channels and breakout patterns
Components:
• Dynamic trendline calculation using pivot points
• Channel width based on historical volatility
• Breakout detection algorithm
Signal Types:
• UPPER BRK (+2): Breakout above upper channel
• LOWER BRK (-2): Breakdown below lower channel
• ABOVE MID (+1): Price above channel midline
• BELOW MID (-1): Price below channel midline
6. Volume Analysis
Purpose: Confirms price movements with volume data
Components:
• Volume spikes detection
• On Balance Volume (OBV)
• Volume Price Trend (VPT)
• Money Flow Index (MFI)
• Accumulation/Distribution Line
Signal Calculation: Multiple volume indicators are combined to determine institutional activity and confirm price movements.
________________________________________
Signal Interpretation
Overall Summary Signals
The indicator aggregates all component signals into an overall market sentiment:
Signal Score Range Interpretation Action
STRONG BUY 10+ Overwhelming bullish consensus Consider long positions
BUY 4-9 Moderate to strong bullish bias Look for long opportunities
NEUTRAL -3 to 3 Mixed signals, consolidation Wait for clearer direction
SELL -4 to -9 Moderate to strong bearish bias Look for short opportunities
STRONG SELL -10+ Overwhelming bearish consensus Consider short positions
Progress Bar Interpretation
• Filled bars indicate signal strength
• Green bars: Bullish signals
• Red bars: Bearish signals
• More filled bars = stronger conviction
________________________________________
Live Market Analysis Guide
Step 1: Initial Assessment
1. Check Overall Summary: Start with the main signal
2. Verify with Component Analysis: Ensure signals align
3. Look for Divergences: Identify conflicting signals
Step 2: Timeframe Analysis
1. Set Appropriate Timeframe: Use 1H for intraday, 4H/1D for swing trading
2. Multi-Timeframe Confirmation: Check higher timeframes for trend context
3. Entry Timing: Use lower timeframes for precise entry points
Step 3: Signal Confirmation Process.
For Buy Signals:
1. Oscillators: Look for oversold conditions (RSI <30, Stoch <20)
2. Moving Averages: Price should be above key MAs
3. Order Blocks: Confirm bounce from support levels
4. Volume: Check for accumulation patterns
5. Supertrend: Ensure bullish trend alignment.
For Sell Signals:
1. Oscillators: Look for overbought conditions (RSI >70, Stoch >80)
2. Moving Averages: Price should be below key MAs
3. Order Blocks: Confirm rejection at resistance levels
4. Volume: Check for distribution patterns
5. Supertrend: Ensure bearish trend alignment.
Step 4: Risk Management Integration
1. Signal Strength Assessment: Stronger signals = larger position size
2. Stop Loss Placement: Use Order Block levels for stops
3. Take Profit Targets: Based on channel analysis and resistance levels
4. Position Sizing: Adjust based on signal confidence
________________________________________
Best Practices
Entry Strategies
1. High Conviction Entries: Wait for STRONG BUY/SELL signals
2. Confluence Trading: Look for multiple components aligning
3. Breakout Trading: Use Order Block and Trendline breakouts
4. Trend Following: Align with Supertrend direction.
Risk Management
1. Never Risk More Than 2% Per Trade: Regardless of signal strength
2. Use Stop Losses: Place at invalidation levels
3. Scale Positions: Stronger signals warrant larger (but still controlled) positions
4. Diversification: Don't rely solely on one indicator.
Market Conditions
1. Trending Markets: Focus on Supertrend and MA signals
2. Range-Bound Markets: Emphasize Oscillator and Order Block signals
3. High Volatility: Reduce position sizes, widen stops
4. Low Volume: Be cautious of breakout signals.
Common Mistakes to Avoid
1. Signal Chasing: Don't enter after signals have already moved significantly
2. Ignoring Context: Consider overall market conditions
3. Overtrading: Wait for high-quality setups
4. Poor Risk Management: Always use appropriate position sizing
________________________________________
Limitations and Considerations
Technical Limitations
1. Lagging Nature: All technical indicators are based on historical data
2. False Signals: No indicator is 100% accurate
3. Market Regime Changes: Indicators may perform differently in various market conditions
4. Whipsaws: Possible in choppy, sideways markets.
Optimal Use Cases
1. Trending Markets: Performs best in clear trending environments
2. Medium to High Volatility: Requires sufficient price movement for signals
3. Liquid Markets: Works best with adequate volume and tight spreads
4. Multiple Timeframe Analysis: Most effective when used across different timeframes.
When to Use Caution
1. Major News Events: Fundamental analysis may override technical signals
2. Market Opens/Closes: Higher volatility can create false signals
3. Low Volume Periods: Signals may be less reliable
4. Holiday Trading: Reduced participation affects signal quality
________________________________________
Risk Disclaimer
IMPORTANT LEGAL DISCLAIMER FROM aiTrendview
WARNING: TRADING INVOLVES SUBSTANTIAL RISK OF LOSS
This Quantum Market Analyzer X7 indicator ("the Indicator") is provided for educational and informational purposes only. By using this indicator, you acknowledge and agree to the following terms:
No Investment Advice
• The Indicator does NOT constitute investment advice, financial advice, or trading recommendations
• All signals generated are based on historical price data and mathematical calculations
• Past performance does not guarantee future results
• No representation is made that any account will achieve profits or losses similar to those shown.
Risk Acknowledgment
• TRADING CARRIES SUBSTANTIAL RISK: You may lose some or all of your invested capital
• LEVERAGE AMPLIFIES RISK: Margin trading can result in losses exceeding your initial investment
• MARKET VOLATILITY: Financial markets are inherently unpredictable and volatile
• TECHNICAL ANALYSIS LIMITATIONS: No technical indicator is infallible or guarantees profitable trades.
User Responsibility
• YOU ARE SOLELY RESPONSIBLE for all trading decisions and their consequences
• CONDUCT YOUR OWN RESEARCH: Always perform independent analysis before making trading decisions
• CONSULT PROFESSIONALS: Seek advice from qualified financial advisors
• RISK MANAGEMENT: Implement appropriate risk management strategies
No Warranties
• The Indicator is provided "AS IS" without warranties of any kind
• aiTrendview makes no representations about the accuracy, reliability, or suitability of the Indicator
• Technical glitches, data feed issues, or calculation errors may occur
• The Indicator may not work as expected in all market conditions.
Limitation of Liability
• aiTrendview SHALL NOT BE LIABLE for any direct, indirect, incidental, or consequential damages
• This includes but is not limited to: trading losses, missed opportunities, data inaccuracies, or system failures
• MAXIMUM LIABILITY is limited to the amount paid for the indicator (if any)
Code Usage and Distribution
• This indicator is published on TradingView in accordance with TradingView's house rules
• UNAUTHORIZED MODIFICATION or redistribution of this code is prohibited
• Users may not claim ownership of this intellectual property
• Commercial use requires explicit written permission from aiTrendview.
Compliance and Regulations
• VERIFY LOCAL REGULATIONS: Ensure compliance with your jurisdiction's trading laws
• Some trading strategies may not be suitable for all investors
• Tax implications of trading are your responsibility
• Report trading activities as required by law
Specific Risk Factors
1. False Signals: The Indicator may generate incorrect buy/sell signals
2. Market Gaps: Overnight gaps can invalidate technical analysis
3. Fundamental Events: News and economic data can override technical signals
4. Liquidity Risk: Some markets may have insufficient liquidity
5. Technology Risk: Platform failures or connectivity issues may prevent order execution.
Professional Trading Warning
• THIS IS NOT PROFESSIONAL TRADING SOFTWARE: Not intended for institutional or professional trading
• NO REGULATORY APPROVAL: This indicator has not been approved by any financial regulatory authority
• EDUCATIONAL PURPOSE: Designed primarily for learning technical analysis concepts
FINAL WARNING
NEVER INVEST MONEY YOU CANNOT AFFORD TO LOSE
Trading financial instruments involves significant risk. The majority of retail traders lose money. Before using this indicator in live trading:
1. Practice on paper/demo accounts extensively
2. Start with small position sizes
3. Develop a comprehensive trading plan
4. Implement strict risk management rules
5. Continuously educate yourself about market dynamics
By using the Quantum Market Analyzer X7, you acknowledge that you have read, understood, and agree to this disclaimer. You assume full responsibility for all trading decisions and their outcomes.
Contact: For questions about this disclaimer or the indicator, contact aiTrendview through official TradingView channels only.
________________________________________
This study guide and indicator are published on TradingView in compliance with TradingView's community guidelines and house rules. All users must adhere to TradingView's terms of service when using this indicator.
Document Version: 1.0
Publisher: aiTrendview
________________________________________
Disclaimer
The content provided in this blog post is for educational and training purposes only. It is not intended to be, and should not be construed as, financial, investment, or trading advice. All charting and technical analysis examples are for illustrative purposes. Trading and investing in financial markets involve substantial risk of loss and are not suitable for every individual. Before making any financial decisions, you should consult with a qualified financial professional to assess your personal financial situation.

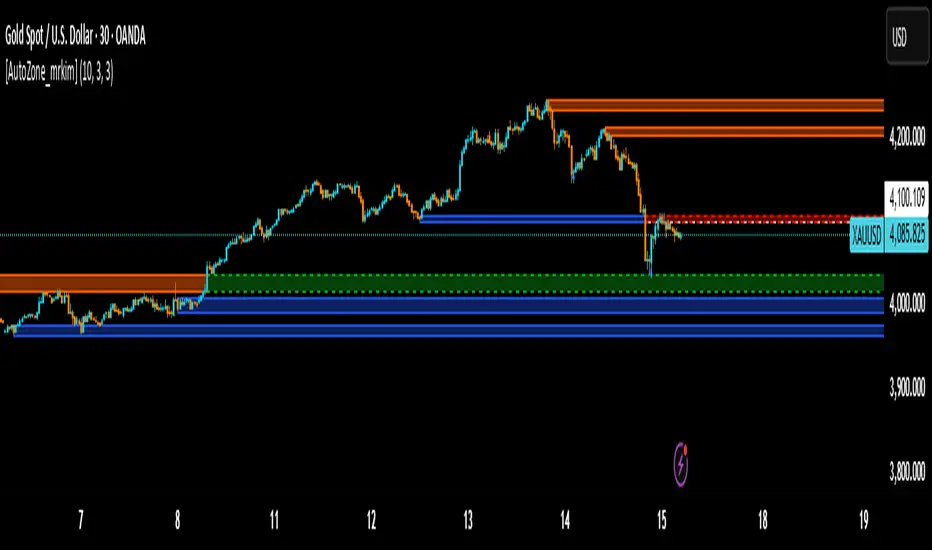
[AutoZone_mrkim]Title:
AutoZone_mrkim — Multi-Timeframe Order Block Auto Zone
Description:
This indicator automatically identifies and draws Order Block zones for every timeframe.
It helps traders visualize potential supply and demand areas more clearly and react faster to market structure changes.
Main Features:
Automatically detects bullish and bearish Order Block zones
Multi-timeframe zone generation (supports all chart timeframes)
Auto-color change when a zone is broken
Clean visualization for trend continuation and reversal setups
Useful for scalpers, intraday traders, and swing traders
Adjustable display options for zone size and transparency
How to Use:
Use the newest zone for short-term intraday signals
Confirm zone strength using structure breaks
Combine with trend analysis for higher accuracy
Disclaimer:
This indicator is a tool to assist decision making, not a guaranteed trading system.
Use responsibly.
Buy Sell Entry Filter SYS (SMC IDM LIT)BUY SELL Entry FILTER
An advanced market analysis tool. It provides visual Buy/Sell signals in the form of triangles (▲▼), as well as analytical elements such as Entry/Stop Loss lines, a delta table, overbought and oversold zones, structural market elements with breakouts, displays information from higher time frames, and most importantly, liquidity blocks that trigger reactions. The indicator has a number of built-in filters that help remove unnecessary Buy/Sell signals from the chart. This allows you to create several profitable strategies. You don't need to sit in front of the charts; the alert system (ALERTS) will tell you when to pay attention to the chart and quickly enter a trade.
There are many signals, and the ▲▼ lines themselves are not an entry point. You need to filter them using other tools, such as liquidity blocks (LB and HTF LB), trend, OS/OB, Delta, and Pullback breakout.
If the ▲▼ appears in the right place, for example, in the liquidity block with the correct trend and the correct delta, then you can enter a trade!
Ideally, take short trades of 1/3 – 1/5 RR on a 1-minute timeframe and be sure to set a stop loss.
Remember! You are solely responsible for your deposit!
Buy/Sell, Entry/SL, OS/OB, Filter, EMA, Delta
This main group of settings is responsible for generating buy and sell signals, setting filters, and displaying moving averages.
1. Buy/Sell Main: Enables/disables the display of the main Buy/Sell signal as a ▲▼. This is a specific pattern that identifies potential trend reversals or continuations.
Buy/Sell Simple: Toggles the display of a simplified Buy/Sell signal in the ▲▼ pattern.
This pattern is less powerful than the main one, but works well in certain contexts.
2. Trend Delta Table: Displays a table on the chart showing the cumulative volume delta for the current trend, as well as the percentage. Useful for assessing the strength of a trend.
3. Entry/SL: When enabled, draws horizontal lines on the chart for Entry and Stop Loss.
4. Filters (Delta, Trend, OS/OB, HTF OS/OB):
These filters help filter out false signals. A Buy/Sell signal is displayed only if it passes all enabled filters:
Delta Filter: A signal is generated if the volume percentage delta (set by the user) matches the signal direction (positive for Buy, negative for Sell).
Trend Filter (EMA): A signal is generated if it matches the trend direction.
OS/OB Filter (RSI): A signal is generated if the price where the signal formed is in the desired zone (below Oversold for Buy, above Overbought for Sell).
HTF OS/OB Filter (RSI): Same as OS/OB, but uses the RSI on a higher timeframe (HTF).
EMA 1 & EMA 2: Displays two exponential moving averages on the chart (default 50 and 100). The line color changes (e.g., green if EMA1 is above EMA2).
Overbought/oversold zone
This group configures overbought/oversold levels and zones, both on the current and higher timeframes.
1. OS/OB zone: Enables/disables the display of dynamic overbought (Oversold) and oversold (Overbought) levels. These levels "float," adapting to the current price. 2. Period: Period for calculating zones (default 50)
OS: Level below which the Oversold zone is defined (default 40).
OB: Level above which the Overbought zone is defined (default 60).
Labels: Toggles the display of text labels (--- OB, --- OS) next to the corresponding levels.
Mid: Toggles the display of the center level and its color.
HTF Zones & Labels: Same as for OS/OB, but for levels on a higher timeframe (HTF).
Smooth: Enables smoothing for calculated price levels of zones, making the lines less sharp.
Structure / Breakout line
This setting adds structural analysis elements and breakout lines to the chart. 1. BO Lines (Breakout Lines): Displays horizontal lines on the chart when the price breaks through the external pullback against the trend, thus showing ChoCh.
2. HH/LL: Displays markers (HH - LL - HL - LH) on the chart to indicate key market structural points.________________________________________
Pullbacks EXT/INT
This setting is responsible for the visualization of pullback lines (Pullback) at external (EXT) and internal (INT) levels.
1. Ext (External): Displays lines connecting external extremes (Pullback), showing potential pullback levels.
2. Int (Internal): Displays lines connecting internal extremes (Pullback).
3. Pending Ext/Int: Displays potential pullback lines that may form if the price reaches the next extreme.
Liquidity blocks
Adds visual rectangles (blocks) to the chart, representing potential liquidity zones (where large orders were placed).
1. LB tune: Parameter determining how many candles are used to determine the pattern for a block.
2. High zone: Color of the line inside the block, indicating the strongest part of the block.
3. Show deleted: Shows deleted (broken) blocks in a different color.
4. Volume LB: Enables/disables the display of the volume value in the block.
Quick liquidity blocks
Similar to main blocks, but creates quick blocks. If a quick block is confirmed, it becomes the main LB; if not, it disappears.
1. Quick LB: Enables/disables quick blocks.
2. QLB tune: Pattern length parameter for quick blocks.
HTF liquidity blocks
Displays LB from a higher timeframe (HTF), using the same principles as main blocks. 1. HTF: Enable/disable HTF blocks.
2. Select a timeframe for calculation.
Alerts
A system for alerting you to important indicator actions. Alerts are triggered by certain events.
1. Bull PB Breakout / Bear PB Breakout: Alert when the external pullback is broken and a ChoCh is formed.
2. Trend Change: Alert when a trend changes.
3. New Block: Alert when a new main liquidity block is formed.
4. New HTF Block: Alert when a new HTF liquidity block is formed.
5. Touch Block: Alert when the price of the main liquidity block is touched.
6. Touch HTF Block: Alert when the price of the HTF liquidity block is touched.
7. Touch mode / Touch mode HTF: Select the alert frequency (before or after the bar closes).
This indicator provides a powerful and flexible tool for market analysis, combining several approaches in a single interface.

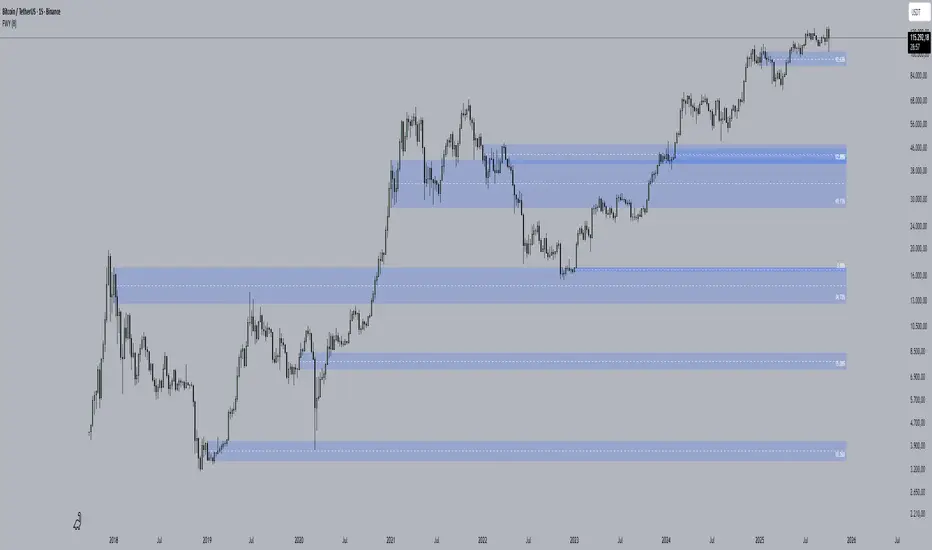
Volume Cluster Support and Resistance Levels [QuantAlgo]🟢 Overview
This indicator identifies statistically significant support and resistance levels through volume cluster analysis, isolating price zones characterized by elevated trading activity and institutional participation. By quantifying areas where volume concentration exceeded historical norms, it reveals price levels with demonstrated supply-demand imbalances that exhibit persistent influence on subsequent price action. The methodology is asset-agnostic and timeframe-independent, applicable across equities, cryptocurrencies, forex, and commodities from intraday to weekly intervals.
🟢 Key Features
1. Support and Resistance Levels
The indicator scans historical price data to identify bars where volume exceeds a user-defined threshold multiplier relative to the rolling average. For each qualifying bar, a representative price is calculated using the average of high, low, and close. Proximate price levels within a specified percentage range are then aggregated into discrete clusters using volume-weighted averaging, eliminating redundant signals. Clusters are ranked by cumulative volume to determine statistical significance. Finally, the indicator plots horizontal levels at each cluster price: support levels (green) below current price indicate zones where historical buying pressure exceeded selling pressure, while resistance levels (red) above current price mark zones where sellers historically dominated. These levels represent areas of established liquidity and price discovery, where institutional order flow previously concentrated.
The Touch Count (T) metric quantifies historical price interaction frequency, while Total Volume (TV) measures aggregate trading activity at each level, providing objective criteria for assessing level strength and trade execution decisions.
2. Volume Histogram
A histogram appears below the price chart, displaying relative volume for each bar within the lookback period, with bar height scaled to the maximum volume observed. Green bars represent up-periods (close > open) indicating buying pressure, while red bars show down-periods (close < open) indicating selling pressure. This visualization helps you confirm the validity of support/resistance levels by seeing where volume actually spiked, identify accumulation/distribution patterns, and validate breakouts by checking if they occur on above-average volume.
3. Built-in Alerts
Automated alerts trigger when price crosses below support levels or breaks above resistance levels, allowing you to monitor multiple assets without constant chart-watching.
4. Customizable Color Schemes
The indicator provides four preset color configurations (Classic, Aqua, Cosmic, Custom) optimized for visual clarity across different charting environments. Each scheme maintains consistent color mapping for support and resistance zones across both level lines and volume histogram components. The Custom configuration permits full color specification to accommodate individual charting setups, ensuring optimal visual contrast for extended analysis sessions.
Classic:
Aqua:
Cosmic:
Custom:
🟢 Pro Tips
→ Trade entry optimization: Execute long positions at support levels with high touch counts or upon confirmed resistance breakouts accompanied by above-average volume
→ Risk parameter definition: Position stop-loss orders near identified support/resistance zones with statistical significance to minimize premature exits
→ Breakout validation: Require volume confirmation exceeding historical average when price penetrates resistance to filter false breakouts
→ Level strength assessment: Prioritize levels with higher touch counts and total volume metrics for enhanced probability trade setups
→ Multi-timeframe confluence: Synthesize support/resistance levels across multiple timeframes to identify high-conviction zones where daily support aligns with 4-hour resistance structures

Order Blocks & Market Structure (SMC)# Order Blocks & Market Structure (SMC)
## 📊 Overview
A Smart Money Concepts indicator that identifies institutional order blocks (OB), market structure breaks (MSB), and breaker blocks (BB) with volume-based strength analysis. Designed for traders seeking to identify institutional accumulation/distribution zones and market structure shifts.
## 🎯 Originality Statement
This indicator combines multiple analytical approaches into a unified system:
- **Multi-level OB strength classification** using volume spike detection and body ratio analysis (OB/OB+/OB++)
- **Automatic lifecycle tracking** that converts invalidated Order Blocks to Breaker Blocks with polarity reversal
- **Volume context integration** showing buyer/seller dominance percentage at block formation
- **Dynamic zone extension** that updates OB boundaries until price interaction or invalidation
- **Delayed touch alerts** (5-bar minimum) to filter premature retest signals
Unlike simple order block scripts that only mark zones, this tool provides strength assessment, volume analysis, and intelligent state management throughout the block lifecycle.
## ⚙️ Technical Methodology
**Market Structure Detection:**
Uses pivot-based swing point analysis to identify trend changes. When price closes above a pivot high (bullish MSB) or below a pivot low (bearish MSB), the structure is marked with horizontal reference lines.
**Order Block Identification:**
Searches the specified lookback period for the lowest low (bullish MSB) or highest high (bearish MSB). When a strong directional candle is found (opposite color to trend direction), its range becomes an OB zone.
**Strength Analysis:**
- Compares candle volume against 20-period SMA with configurable multiplier (1.2-3.0x)
- Calculates body-to-range ratio to assess candle strength (0.4-0.8 threshold)
- Assigns strength levels: Standard (no conditions), Strong (one condition), Premium (both conditions)
**Breaker Block Conversion:**
When price closes completely through an OB zone (bullish OB broken downward or bearish OB broken upward), the zone automatically converts to BB with reversed polarity and color.
## 📋 Features
**Market Structure (MSB):**
- Detects bullish and bearish structure breaks
- Configurable swing length (5-50 bars)
- Visual markers with horizontal lines
**Order Blocks (OB):**
- Three strength tiers: OB (standard), OB+ (strong), OB++ (premium)
- Volume percentage display (buyer vs seller dominance)
- Dynamic zone extension until invalidation
**Breaker Blocks (BB):**
- Automatic conversion from failed OBs
- Polarity tracking (bullish ↔ bearish)
- Fixed zones after conversion
## 🔧 Settings Documentation
**Market Structure Group:**
*Show Market Structure* - Enable/disable MSB detection and line drawing
- Default: ON
- When OFF: No structure lines or labels appear
*MSB Labels* - Display text labels at structure break points
- Default: ON
- Labels show "MSB" at the break candle
*Swing Length* - Lookback period for pivot point detection
- Range: 5-50 bars
- Default: 10
- Higher values = longer-term structure, fewer signals
- Lower values = short-term structure, more signals
*Bull Color* - Color for bullish elements (MSB, bullish OB, bullish BB)
- Default: #089981 (green)
*Bear Color* - Color for bearish elements (MSB, bearish OB, bearish BB)
- Default: #f23645 (red)
**Order Block Group:**
*Order Blocks* - Enable/disable OB detection and zone drawing
- Default: ON
- When OFF: No boxes appear (MSB lines still show if enabled)
*OB Strength* - Enable multi-level strength classification
- Default: ON
- When ON: Labels show OB/OB+/OB++ based on analysis
- When OFF: All zones labeled simply as "OB"
*Volume %* - Display buyer/seller volume percentage
- Default: ON
- Shows "X% Buy" or "X% Sell" inside zones
- Calculated over 10 bars from zone formation
*OB Lookback* - How many bars to search for OB candle
- Range: 5-30 bars
- Default: 10
- Searches for lowest low (bullish) or highest high (bearish) within this range
*Vol Threshold* - Minimum volume multiplier for strength upgrade
- Range: 1.2-3.0x
- Default: 1.5x
- Volume must exceed (20-period SMA × threshold) for OB+ or OB++
*Body Ratio* - Minimum body-to-range ratio for strength upgrade
- Range: 0.4-0.8
- Default: 0.6
- Candle body must be at least this proportion of total range for OB+ or OB++
## 📖 How to Use
**For Trend Following:**
1. Wait for MSB in your desired direction
2. OB forms in the breakout area (the institutional entry zone)
3. Price may immediately continue or pull back to retest OB
4. Enter on OB retest with "OB Touch" alert (after 5+ bars from creation)
5. Higher strength OB (OB+, OB++) indicates stronger institutional activity
**For Reversal Trading:**
1. Identify Breaker Blocks (former OBs that failed)
2. BB represents potential reversal zone with opposite polarity
3. Wait for MSB in BB direction for confirmation
4. Enter on pullback to BB zone
**Volume Analysis:**
- 70%+ Buy/Sell dominance = strong institutional bias
- 60-70% = moderate bias
- 50-60% = weak bias, use caution
**Optimal Conditions:**
- Works best on trending markets (4H, Daily, Weekly timeframes)
- Less effective in tight ranges or low-volume periods
- Major pairs/assets with good liquidity recommended
## 🔔 Alert Conditions (8 Types)
The indicator provides the following alerts:
1. **Bullish MSB** - Upward market structure break detected
2. **Bearish MSB** - Downward market structure break detected
3. **Bullish OB Created** - New bullish order block formed
4. **Bearish OB Created** - New bearish order block formed
5. **Bullish BB Created** - Bearish OB converted to bullish BB
6. **Bearish BB Created** - Bullish OB converted to bearish BB
7. **Bullish OB Touch** - Price revisited bullish OB (minimum 5 bars after creation)
8. **Bearish OB Touch** - Price revisited bearish OB (minimum 5 bars after creation)
Touch alerts include a 5-bar delay to avoid alerting on immediate continuation moves.
## ⚠️ Limitations & Risk Disclosure
**Known Limitations:**
- MSB signals can produce whipsaws in ranging or choppy markets
- Not all OB touches result in successful trades
- OB zones may be tested multiple times before activation
- Volume data may be unavailable or unreliable on some instruments/exchanges
- Strength analysis requires sufficient volume history
- Historical repainting: OB zones extend dynamically as price interacts with them
**Risk Considerations:**
This indicator is designed for educational and analytical purposes. It identifies potential institutional zones but does not predict price movement. Past identification of zones does not guarantee future trading success. OB and BB zones represent areas of interest, not guaranteed support/resistance. Always use proper risk management, combine with other analysis methods, and never risk more than you can afford to lose.
## 🎨 Visual Guide
**Colors & Symbols:**
- 🟢 Green boxes = Bullish Order Blocks / Bullish Breaker Blocks
- 🔴 Red boxes = Bearish Order Blocks / Bearish Breaker Blocks
- Horizontal lines = Market Structure Break levels
- "MSB" labels = Structure break points (above/below line)
- "OB" / "OB+" / "OB++" labels = Order Block strength (right side of box)
- "BB" labels = Breaker Block (converted from OB)
- "X% Buy/Sell" labels = Volume analysis (center of box)
**Box Behavior:**
- OB zones extend to the right as long as price interacts with them (not broken)
- When OB is invalidated, it stops extending and converts to BB
- BB zones remain fixed at their invalidation point
## 💡 Best Practices
- Focus on OB+ and OB++ zones for higher probability setups
- Confirm OB touches with price action (rejection wicks, engulfing patterns)
- Use multiple timeframe analysis (Daily OB + 4H entry)
- Avoid trading in the first 1-2 bars after OB creation (wait for touch alert)
- Consider volume % - avoid zones with <60% dominance
- Combine with other confluence factors (Fibonacci, support/resistance)
- Set realistic stop losses beyond the OB/BB zone
---
**Version:** 1.0
**Pine Script:** Version 6
**Category:** Smart Money Concepts, Order Flow, Market Structure
For questions or suggestions, use the TradingView comments section below.
AI MEDEA FORECASTAI MEDEA searches for similar historical patterns and uses them to generate predictions. The longer it runs, the more data it gathers and the better the predictions become.
Important:
The indicator must remain enabled to:
- Collect predictions and check their accuracy
- Have as much data as possible for comparison
- Provide more accurate results
Recommendation:
Let the indicator run for several days on different timeframes (15m, 30m, 1H, 4H). The accuracy table will show the actual accuracy only after gathering enough predictions.

Synapse Dynamics - Market Structure📊 SYNAPSE DYNAMICS - MARKET STRUCTURE INDICATOR
An educational tool for learning and practicing Smart Money Concepts (SMC) methodology through visual representation of institutional price action patterns.
═══════════════════════════════════════════════════
🎯 WHAT THIS INDICATOR DISPLAYS
This indicator visualizes Smart Money Concepts patterns on your chart:
- Order Blocks (OB) - Supply and demand zones based on institutional order flow theory. The indicator identifies these areas using price action criteria including the final opposing candle before a strong directional move.
- Breaker Blocks - Failed order blocks that may act as support/resistance. These occur when an order block is invalidated but price returns to the zone, potentially reversing its role.
- Fair Value Gaps (FVG) - Three-candle imbalance patterns where price gaps create inefficiencies. The indicator marks these zones for reference in analysis.
- Market Structure - Break of Structure (BOS) and Change of Character (CHoCH) patterns based on swing high/low breaks. These help identify potential trend continuation or reversal points.
- Reference Entry Signals - The indicator calculates potential entry zones with accompanying stop loss and take profit reference levels based on order block and FVG locations. These are for educational reference only.
- Higher Timeframe Context - Optional filter that displays the higher timeframe trend direction to provide additional market context.
- Information Panel - On-screen dashboard showing active reference signals, their status, and relevant price levels.
- Swing Point Mapping - Labels recent higher highs (HH), higher lows (HL), lower highs (LH), and lower lows (LL) based on configurable swing detection parameters.
═══════════════════════════════════════════════════
⚙️ HOW IT WORKS
The indicator uses the following methodology:
**Order Block Detection:** Identifies the last opposing candle before a strong directional move that breaks structure. Filters blocks by size to reduce noise.
**Market Structure Analysis:** Tracks swing points and identifies when price breaks previous highs/lows to determine BOS or CHoCH patterns.
**Fair Value Gap Identification:** Detects three-candle patterns where candle 1's high/low doesn't overlap with candle 3's low/high, creating an imbalance zone.
**Reference Signal Generation:** Combines order block proximity, FVG presence, and market structure breaks to suggest potential study areas. Optional HTF trend filter can be enabled.
**Timeframe Adaptation:** Automatically adjusts swing detection sensitivity based on the chart timeframe (using multipliers for intraday vs. higher timeframes).
═══════════════════════════════════════════════════
📚 EDUCATIONAL PURPOSE & IMPORTANT LIMITATIONS
**This indicator is designed as an educational tool for:**
- Learning Smart Money Concepts methodology
- Practicing pattern recognition
- Understanding institutional price action theories
- Analyzing market structure visually
**Critical Understanding:**
- All signals and levels are REFERENCE POINTS for study - not trading recommendations
- The indicator displays patterns based on historical price action - it cannot predict future movements
- Smart Money Concepts is a theoretical framework - market behavior varies
- Backtested or historical results shown do not guarantee future performance
- No indicator can account for all market variables, news events, or changing conditions
**Proper Use:**
This tool is meant to assist in learning technical analysis concepts. Users must develop their own analysis skills, risk management strategies, and trading plans. The displayed patterns require interpretation within broader market context.
═══════════════════════════════════════════════════
⚙️ CUSTOMIZATION OPTIONS
**Adjustable Parameters:**
- Order Block: Minimum size threshold, maximum count displayed
- Fair Value Gaps: Toggle visibility, maximum count
- Market Structure: Swing detection length, BOS/CHoCH display
- Signals: Entry/SL/TP calculation method, HTF filter toggle
- Visual Settings: Colors, line styles, label sizes, panel position
**Timeframe Compatibility:**
Works on all timeframes from 1-minute to monthly charts. The swing detection automatically scales based on timeframe.
═══════════════════════════════════════════════════
⚠️ DISCLAIMER
This indicator is for educational and informational purposes only. It does not constitute financial advice or trading recommendations. Trading involves substantial risk of loss. Past patterns and historical analysis do not indicate future results. Users are responsible for their own trading decisions and risk management. The author assumes no liability for trading losses.
═══════════════════════════════════════════════════
🔧 ALERT FUNCTIONALITY
Built-in alert conditions notify you when:
- New order blocks are detected
- Market structure changes occur (BOS/CHoCH)
- Reference entry signals appear
Configure alerts through TradingView's alert system.

Smart Money Concepts Pro – OB, FVG, Liquidity + Trade SetupsThis script is a complete Smart Money Concepts (SMC) toolkit designed for traders who want clean and actionable charts without clutter.
It combines the most important institutional concepts into one indicator:
Order Blocks (OB): auto-detection of bullish and bearish order blocks with mitigation tracking, merging and TTL (time-to-live).
Fair Value Gaps (FVG): automatic gap recognition with size filters, mitigation tracking and lifetime control.
Liquidity Pools (EQH/EQL): equal highs and equal lows marked with tolerance (ATR-based or fixed).
Break of Structure (BOS): up/down structure shifts plotted directly on the chart.
Multi-Timeframe (HTF): option to use higher timeframe data (e.g. H4, Daily) for stronger zones.
Trend Filter: show zones only in the direction of market structure.
Trade Setups: automatic signals for OB Retest + Trend setups, with entry, stop-loss and take-profit levels (custom R-R).
Flexible Zone Extension: choose between extending zones to the live bar or fixed box width for a cleaner look when scrolling.
Features
Fully customizable (pivot length, ATR filters, box width, TTL, zone colors)
Separate presets for Scalping, Intraday, Swing trading styles
Visual trade planning with entry/SL/TP lines and optional labels
Works across all markets (crypto, forex, indices, stocks)
How to use
Bias: identify overall direction (BOS + HTF zones).
Wait: for price to return to an unmitigated OB or FVG.
Entry: take the setup signal (OB retest + trend filter).
Risk: stop-loss at opposite OB boundary.
Target: TP based on chosen R-R multiple (default 2R).
⚡ Whether you scalp short-term moves or swing trade HTF zones, this indicator gives you a clear institutional edge in spotting supply/demand imbalances and high-probability setups.

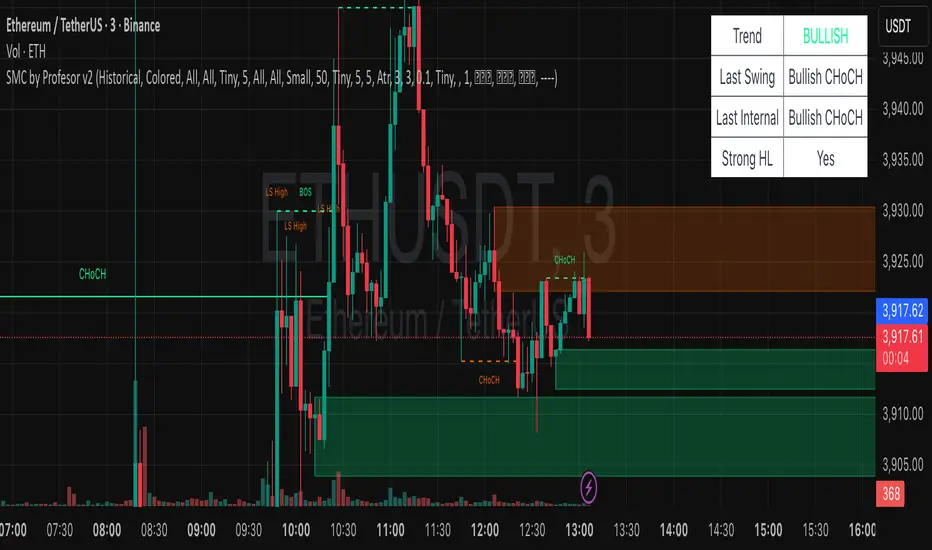
SMC by ProfesorSMC by Profesor
Discover market structure mastery with SMC by Profesor – your ultimate Smart Money Concepts toolkit for TradingView. Identify bullish/bearish BOS & CHoCH breaks, plot internal/swing order blocks, detect EQH/EQL levels, highlight FVGs, and zone premium/discount areas. Visualize swing points, PDH/PDL lines, and trend-colored candles. Receive instant alerts for breakouts, gaps, and more. Perfect for ICT traders seeking precision in any timeframe. Historical or real-time mode – elevate your edge today!
Dinkan Price Action Pro | Pure Price Action Toolkit🔸 Overview
Dinkan Price Action Pro is a pure price-action research toolkit that automatically detects and visualizes Order Blocks (OB), Fair Value Gaps (FVG), merged-candle hidden structures, liquidity zones (including HTF bias liquidity), and trendline & chart-pattern liquidity.
This indicator helps traders align with the Higher Time Frame (HTF) bias — the direction of the dominant institutional wave — and uncover hidden candlestick structures that normal timeframe charts never show.
⚙️ Core Features
✅ Automatic Order Block detection (bullish & bearish)
✅ Fair Value Gaps with real-time fill tracking
✅ Merged-Candle Engine — reveals hidden structures between standard timeframes
✅ Liquidity Zones — equal highs/lows, trendline liquidity & HTF liquidity pools
✅ HTF Bias Engine — detect directional bias across multiple timeframes
✅ Auto Trendlines & Chart Pattern Liquidity
🔍 How It Works (Step by Step)
🕯️ A. Merged Candle Engine (Hidden Structure)
1️⃣ Choose how many candles to merge (e.g., 3–5).
2️⃣ The script groups candles backward from the current bar in continuous sets.
3️⃣ Each merged candle forms using:
• Open = first candle’s open • Close = last candle’s close
• High = highest high • Low = lowest low
4️⃣ These new candles expose “hidden” structures between fixed timeframes — revealing true base-impulse patterns missed by normal charts.
🟩 B. Order Block Detection
Detects consolidation (base) followed by strong impulse.
Marks demand (green) and supply (red) zones automatically.
Strength calculated using impulse range (and volume, if available).
Older, mitigated OBs can be hidden for clarity.
🟦 C. Fair Value Gaps (FVG)
Automatically detects imbalances between consecutive candles.
Unfilled FVGs are highlighted; once filled, zones fade or gray out.
Works dynamically across merged and standard candles.
🟧 D. Liquidity Zones
Finds equal highs/lows, wick clusters, and structural liquidity.
Trendline liquidity and chart-pattern liquidity detected in real time.
Projects HTF liquidity zones from higher charts down to current timeframe.
🔺 E. HTF Bias Engine
Analyzes higher and medium timeframes (HTF/MTF) using CISD-style confirmation.
Bias auto-adjusts or can be manually selected.
🧭 Purpose: Identify the dominant institutional flow and trade in its direction.
⏰ Timeframe Alignment
Recommended structure:
HTF: 4H or 1D
MTF: 1H or 30M
LTF: 15M or 5M
Users may let the script auto-adjust or manually configure each timeframe combination.
📘 Inputs & Settings
🔹 OB sensitivity (Low / Medium / High)
🔹 Volume weighting toggle
🔹 HTF & MTF selection (Auto / Manual)
🔹 Multi-symbol mode
🔹 Visual toggles (OB, FVG, trendlines, merged candles, bias labels)
🔹 Alert toggles (zone touch, bias flip, hidden structure detection)
📊 How to Use — Workflow Example
1️⃣ Load the indicator on your chart.
2️⃣ Check the HTF Bias direction — trade only in that direction.
3️⃣ Identify nearby Order Blocks or FVGs inside HTF liquidity areas.
4️⃣ Watch the Merged Candle View to confirm hidden structures (base + impulse).
5️⃣ Wait for LTF confirmation (e.g., small structure break, wick rejection).
6️⃣ Place stop beyond the opposite OB edge; target next liquidity cluster.
🎯 This workflow aligns your lower-timeframe trades with the dominant higher-timeframe flow.
🧱 Repainting & Stability
Completed OBs and FVGs remain static — they do not repaint.
Real-time zones during candle formation can update until candle closes (standard behavior).
Merged candles are recalculated each bar; once a group closes, it remains fixed historically.
⚠️ Limitations
This is not a buy/sell signal generator.
Volume-weighted features require volume data.
Use responsible risk management and independent confirmation methods.
🔒 Invite-Only / Locked Code
The script is published as invite-only to protect proprietary implementations of:
The merged-candle engine
Liquidity and bias-detection heuristics
Invite-only publishing complies with TradingView rules.
All logic, purpose, and usage are fully described here for transparency.
🧩 Originality & Usefulness
This script is an original integrated system, not a simple mashup.
Each module is interconnected to provide a unified analytical process:
The Merged Candle Engine creates hybrid bars that expose hidden base–impulse patterns.
These merged bars feed into the Order Block and Fair Value Gap logic, refining zone accuracy.
The Liquidity Detector references those zones and merged bars to locate valid structural pools.
Finally, the HTF Bias Engine confirms directional context across multiple pairs and timeframes.
Together, these elements form a dynamic framework that interprets institutional footprints and structure flow — something no single indicator can achieve individually.
The combination produces new analytical value: a precise, adaptive HTF bias alignment and structure-based liquidity map in one visual system.
📜 Disclaimer
This tool is for educational and analytical use only.
It does not constitute financial advice.
Trading involves risk — always perform independent analysis and practice sound risk management.
Past performance does not guarantee future results.
HTF Order Blocks [TradeWithRon]HTF Order Blocks is a clean, multi-timeframe order-flow tool that maps bullish/bearish order blocks and optional breaker blocks from higher timeframes onto your current chart. It’s built for clarity and speed: minimal clutter, configurable labels, and optional Fibonacci extensions for quick projection work.
What it does
Identifies Order Blocks (OBs) using swing structure (configurable lookback).
Marks Breaker Blocks when an OB is breached and market structure flips.
Projects HTF zones from up to two higher timeframes (HTF1 & HTF2), with separate color themes.
Clean visuals: open lines, and smart label placement.
Optional Fibonacci extensions from each OB for quick confluence checks.
Alert-ready: receive alerts on creation of Bullish/Bearish OBs and Breakers.
Key Features
Multi-Timeframe Mapping
Enable HTF1 and/or HTF2 and project their OBs on your active chart.
Uses request.security() with lookahead_off to avoid future-bar leakage.
Fibonacci Add-On (optional)
How it works (logic overview)
Swing detection: Finds recent pivots using a lookback window.
OB creation:
Bullish OB: Created after price closes above a prior swing high, then scans the upswing for the most meaningful base candle range (high/low/open/close).
Bearish OB: Created after price closes below a prior swing low, with symmetric logic.
Breaker state:
A bullish OB turns breaker if price later closes below its base;
A bearish OB turns breaker if price closes above its base.
Cleanup: Breakers are removed if price subsequently recovers past the opposing OB boundary.
HTF OBs are detected on their native timeframe and projected to the active chart; confirmation occurs on the HTF bar’s close.
Orderblocks & BreakersThis indicator identifies potential orderblocks and breakers based on recent swing highs and lows. It is built to offer a structured, customizable, and noise-controlled view of how price interacts with supply and demand levels.
The script applies pivot-based swing detection to identify swing highs and lows.
Bullish Orderblocks: The script Identifies and stores the last down candle before a swing high is breached and confirms and plots the orderblock with a market structure break (close above the swing high).
Bearish Orderblocks: The script Identifies and stores the last up candle before a swing low is breached and confirms and plots the orderblock with a market structure break (close below the swing low).
When price later closes through an existing orderblock, it is reclassified as a Breaker and recolored accordingly. (all colors can be changed in the settings)
What Makes It Different
Unlike most orderblock tools that simply mark every swing-based block, this version introduces:
1. Chop Control – automatically hides breakers that price repeatedly closes through (2 closes after the orderblock becomes a breaker), keeping only relevant zones visible.
2. Recent Block Filtering – limits how many of the recent orderblocks or breakers are displayed, preventing chart clutter.
3. Dynamic Updating – orderblocks automatically convert to breakers when price closes beyond them, with clear color changes.
These features make it easier to study cleaner price structure without manually managing old or invalid zones. The optional Chop Control filter can reduce overlapping or repeatedly invalidated zones to keep the chart clearer.
Customizable Parameters
- Swing detection length (shorter means more aggressive pivot detection, longer means less aggressive so less highs/lows detected)
- Number of recent blocks to display
- Visibility toggles for orderblocks or breakers
- Color and transparency controls for each type
Alerts
Alerts can be set to trigger when price tests any defined zone.
Purpose
This indicator is designed as a price structure visualization and study tool.
It may assist in understanding how price interacts with previously active regions, but it does not produce signals or trade recommendations.

OrderBlocks by exp3rts (Non-Repainting)The OrderBlocks by exp3rts indicator automatically identifies and visualizes bullish and bearish order blocks using confirmed, non-repainting fractals combined with Fair Value Gap (FVG) validation for enhanced accuracy.
This tool is designed to help traders spot high-probability institutional price zones — areas where large buy or sell orders previously caused significant moves — allowing you to anticipate potential reversal, continuation, or mitigation levels with precision.
Core Features
✅ Non-Repainting Logic: Uses confirmed 3- or 5-bar fractals only after full pattern completion.
📈 Dynamic Order Block Detection: Marks both bullish and bearish OBs automatically.
⚖️ FVG Filter (Optional): Optionally require a Fair Value Gap within a user-defined distance to confirm valid OBs.
🎯 Customizable OB Lines: Adjust color, style (solid, dashed, dotted), width, and body/wick placement.
🧹 Auto-Cleanup: Option to remove order block lines once price has been mitigated (touched/filled).
🔺🔻 Fractal Display: Toggle fractal highs/lows on or off for extra structure clarity.
⚡ Optimized for Performance: Uses efficient array management to run smoothly within TradingView’s bar processing limits.
How to Use
Add the indicator to your chart.
Adjust settings such as Fractal Filter (3/5), FVG distance, and Line Style to match your trading preference.
Watch for bullish OBs (green lines) near potential demand zones and bearish OBs (red lines) near supply zones.
Use in confluence with market structure and liquidity concepts for best results.
Settings Overview
Fractal Filter: Choose between 3-bar or 5-bar swing fractals.
Order Block Type: Detect OBs based on Close or High/Low break structure.
FVG Filter: Optionally require nearby Fair Value Gaps.
Delete After Fill: Automatically remove mitigated OBs.
Visuals: Customize line color, thickness, and style for clear chart integration.
Made for any timeframe & any market.
First week of the yearA very simple indicator that marks a channel on the candlestick for the first week of the year.
The channel can serve as an entry/exit point with a medium and long term focus.
Note: This indicator should be observed exclusively on the weekly timeframe.
BND Trader (By Vahid.Jz) 🇮🇷🎉 The first Persian indicator on TradingView, released for free to celebrate my daughter's birthday. 🎉
**Trading Assistant (by Vahid.Jz)** is an all-in-one tool designed to simplify analysis and improve accuracy. It acts as an intelligent trading partner.
**Features:**
- Market Structure detection
- Multi-Timeframe “Third Eye” analysis
- Professional Order Blocks recognition
- Fair Value Gaps (FVGs) detection
- Customizable alerts
- Fully Persian interface
- Create Custom Alarm
Developed with love by **Vahid.Jz**, a trader and Pine Script enthusiast.
*“Trading is not a destination; it’s the journey — a path of learning, growth, and experience.”*

Supply & Demand Zones [QuantAlgo]🟢 Overview
The Supply & Demand (Support & Resistance) Zones indicator identifies price levels where significant buying and selling pressure historically emerged, using swing point analysis and pattern recognition to mark high-probability reversal and continuation areas. Unlike conventional support/resistance tools that draw arbitrary horizontal lines, this indicator can automatically detect structural zones, offering traders systematic entry and exit levels where institutional order flow likely congregates across any market or timeframe.
🟢 How to Use
# Zone Types:
Green/Demand Zones: Support areas where buying pressure historically emerged, representing potential long entry opportunities where price may bounce or consolidate before moving higher. These zones mark levels where buyers previously overcame sellers.
Red/Supply Zones: Resistance areas where selling pressure historically dominated, indicating potential short entry opportunities where price may reverse or stall before declining. These zones identify levels where sellers previously overwhelmed buyers.
# Zone Pattern Types:
Wick Rejection Zones: Zones created from candles with exceptionally long wicks showing violent price rejection. A demand rejection occurs when price drops sharply but closes well above the low, forming a long lower wick (relative to the total candle range) that demonstrates buyers aggressively defending that level. A supply rejection shows price spiking higher but closing well below the high, with the long upper wick proving sellers rejected that price aggressively. These zones often represent major institutional orders that absorbed significant market pressure. The rejection wick ratio setting controls how prominent the wick must be (higher ratios require more dramatic rejections and produce fewer but higher-quality zones).
Continuation Demand Zones: Areas where price rallied upward, paused in a brief consolidation base, then rallied again. This pattern confirms strong buying continuation (the consolidation represents profit-taking or minor pullbacks that failed to attract meaningful selling). When price returns to these zones, buyers who missed the initial rally often provide support, making them high-probability long entries within established uptrends. These zones follow the classic Rally-Base-Rally structure, demonstrating that buyers remain in control even during temporary pauses.
Reversal Demand Zones: Zones where price dropped, formed a consolidation base, then reversed into a rally. This structure marks potential trend reversals or major swing lows where buyers finally overwhelmed sellers after a decline. The base period represents accumulation by stronger hands, and these zones frequently appear at market bottoms or as significant pullback support within larger uptrends, signaling shifts in market control. These zones follow the Drop-Base-Rally pattern, showing the moment when selling pressure exhausted and buying interest emerged.
Continuation Supply Zones: Areas where price dropped, consolidated briefly, then dropped again. This pattern demonstrates strong selling continuation (the pause represents temporary buying attempts that failed to generate meaningful recovery). When price returns to these zones, sellers who missed the initial decline often provide resistance, creating short entry opportunities within established downtrends. These zones follow the Drop-Base-Drop structure, confirming that sellers maintain dominance even during temporary consolidations.
Reversal Supply Zones: Zones where price rallied upward, formed a consolidation base, then reversed into a decline. This formation identifies potential trend reversals or major swing highs where sellers overcame buyers after an advance. The base period often represents distribution by institutional participants, and these zones commonly appear at market tops or as key pullback resistance within larger downtrends, marking transfers of market control from buyers to sellers. These zones follow the Rally-Base-Drop pattern, capturing the transition point when buying exhaustion meets aggressive selling.
# Zone Mitigation Methods:
Wick Mitigation: Zones become invalidated immediately upon first contact by any wick. This assumes zones work only on their initial test, reflecting the belief that institutional orders concentrated at these levels get completely filled on first touch. Best for traders seeking only the highest-probability, untested zones and willing to accept that zones invalidate frequently in volatile markets. When price touches a zone boundary with even a single wick, that zone is considered "used up" and becomes mitigated.
Close Mitigation: Zones remain valid through wick penetration but become invalidated only when a candle closes through the zone boundary. This method allows price to briefly probe the zone with wicks while requiring actual commitment (a close) for invalidation. Suitable for traders who recognize that zones can withstand initial tests and prefer filtering out false breakouts caused by temporary volatility or liquidity hunts. A zone stays active as long as candles close within or outside it, regardless of wick penetration, until a close occurs beyond the boundary.
Full Body Mitigation: Zones stay valid until an entire candle body exists completely beyond the zone boundary, meaning both the open and close must be outside the zone. This approach maintains zone validity through partial penetrations, accommodating the reality that institutional zones can absorb considerable price action before exhausting. Ideal for volatile markets or traders who believe zones represent price ranges rather than precise levels, and who want zones to persist through aggressive but ultimately rejected breakout attempts. Only when both the open and close of a candle are beyond the zone does it become mitigated.
🟢 Pro Tips for Trading and Investing
→ Preset Selection: Choose presets matching your preferred timeframe - Scalping (M1-M30) for aggressive detection on minute charts, Intraday (H1-H12) for balanced filtering on hourly timeframes, or Swing Trading (1D+) for strict filtering on daily charts. Each preset automatically optimizes swing length, zone strength, and max zone counts for the selected timeframe.
→ Input Calibration: Adjust Swing Length based on market speed (lower values 3-7 for fast markets, higher values 12-20 for slower markets). Set Minimum Zone Strength according to asset volatility (0.05-0.15% for low-volatility assets, 0.25-0.5% for high-volatility assets). Tune Rejection Wick Ratio higher (0.6-0.8) for strict wick filtering or lower (0.3-0.5) to capture more subtle rejections.
→ Zone Pattern Toggle Strategy: Pattern types are mutually exclusive - enable Continuation OR Reversal patterns for each zone type, not both together. Recommended combinations: For trend trading, enable Rejection + Continuation (2-4 toggles total). For reversal trading, enable Rejection + Reversal (2-4 toggles). For scalping, enable only Rejection zones (1-2 toggles). Maximum 3-4 active toggles provides optimal chart clarity. A simple Wick Rejection toggle can also work on virtually any market and timeframe.
→ Mitigation Method Selection: Use Wick mitigation in clean trending markets for strict zone invalidation on first touch. Use Close mitigation in moderate volatility to filter out temporary spikes. Use Full Body mitigation in highly volatile markets to keep zones active through whipsaws and false breakouts.
→ Alert Configuration: Utilize built-in alerts for new zone creation, zone touches, and zone breaks. New zone alerts notify when fresh supply/demand areas form. Zone touch alerts signal potential entry opportunities as price reaches zones. Zone break alerts indicate when levels fail, signaling possible trend acceleration or structure changes.

ICT Concepts(Liquidity, FVG & Liquidity Sweeps)📄 Description:
A Smart Money Concept (SMC)-based utility that blends ICT-style Liquidity Sweeps, Fair Value Gap (FVG) mapping, and Swing Structure proxies – designed for traders seeking clean precision in price imbalance analysis.
⸻
🔍 1. What This Script Does
T his indicator brings together three core Institutional Concepts:
• Liquidity Sweep Detection : Identifies buy/sell-side liquidity grabs (fakeouts) confirmed by volume spikes – a common precursor to institutional order flow shifts.
• Fair Value Gaps (FVGs) : Highlights inefficiencies between price legs using strict ICT-style 3-candle or gap-based rules. These are areas institutions often revisit.
• Swing Structure Proxy (OB Mapping) : Tracks dynamic swing highs/lows to act as proxy zones for potential order blocks and structural boundaries.
It also includes a cooldown-based signal filtering engine to prevent overfitting and noise, helping traders avoid false positives in choppy markets.
⚙️ 2. How It Works (Core Logic)
✅ A. Liquidity Sweep Engine
• Looks back N bars to find Equal Highs or Equal Lows.
• Triggers a signal only if price sweeps the level and closes on the other side with a volume spike.
• Customizable volume threshold (e.g., 1.5x average volume).
• Includes a signal cooldown period to reduce clutter and boost quality.
Bullish Sweep = Price dips below equal lows but closes higher
Bearish Sweep = Price spikes above equal highs but closes lower
Visuals: Signal arrows with alerts (BUY LQ / SELL LQ)
⸻
✅ B. Fair Value Gap (FVG) Zones
• Detects FVGs using:
• Sequential logic: Low > High (bullish), High < Low (bearish)
• Gap logic: Open gaps at bar open
• Dynamic box drawing:
• Automatically extends FVG zones until price fully closes through them.
• Different color coding for bullish (teal) and bearish (orange) gaps.
• Customizable:
• Opacity control
• Option to include/exclude gap-based FVGs
• Hide filled zones
• Limit total zones rendered (for performance)
⸻
✅ C. Swing High/Low Structure
• Uses a lookback period to find latest swing high/low levels.
• Acts as a proxy for Order Block zones or structural shift reference points.
• Plotted as red (high) and green (low) lines.
⸻
🚀 3. How to Use It
• Scalpers and Intraday Traders can use Liquidity Sweep + FVG Confluence to time reversals or catch early entries into trend continuation moves.
• Swing Traders can observe swing OB proxies and recent FVG zones to frame directional bias and target zones.
• Volume-Aware Traders benefit from the volume filter that confirms sweeps are meaningful – not just random stop hunts.
🔔 Set alerts on:
• Bullish Liquidity Sweeps
• Bearish Liquidity Sweeps
You can use this in combination with your own trend filters, or even confluence it with Order Blocks, VWAP, or EMA trend tools.
⸻
💡 What Makes It Original?
• The script doesn’t merely combine standard tools — it builds a cohesive ICT-style detection system using:
• A custom volume-confirmed liquidity sweep filter
• Dynamic FVG rendering with filled logic + performance optimization
• Visual hierarchy to avoid clutter: clean line plots, contextual boxes, and conditional signals
• Highly customizable yet lightweight, making it suitable for fast-paced decision making.
⸻
✅ Notes
• Invite-only script for serious traders interested in Smart Money and ICT concepts.
• Does not repaint signals.
• All visuals are dynamically managed for clarity and performance.
ICT Venom Trading Model [TradingFinder] SMC NY Session 2025SetupIntroduction
The ICT Venom Model is one of the most advanced strategies in the ICT framework, designed for intraday trading on major US indices such as US100, US30, and US500. This model is rooted in liquidity theory, time and price dynamics, and institutional order flow.
The Venom Model focuses on detecting Liquidity Sweeps, identifying Fair Value Gaps (FVG), and analyzing Market Structure Shifts (MSS). By combining these ICT core concepts, traders can filter false breakouts, capture sharp reversals, and align their entries with the real institutional liquidity flow during the New York Session.
Key Highlights of ICT Venom Model :
Intraday focus : Optimized for US indices (US100, US30, US500).
Time element : Critical window is 08:00–09:30 AM (Venom Box).
Liquidity sweep logic : Price grabs liquidity at 09:30 AM open.
Confirmation tools : MSS, CISD, FVG, and Order Blocks.
Dual setups : Works in both Bullish Venom and Bearish Venom conditions.
At its core, the ICT Venom Strategy is a framework that explains how institutional players manipulate liquidity pools by engineering false breakouts around the initial range of the market. Between 08:00 and 09:30 AM New York time, a range called the “Venom Box” is formed.
This range acts as a trap for retail traders, and once the 09:30 AM market open occurs, price usually sweeps either the high or the low of this box to collect stop-loss liquidity. After this liquidity grab, the market often reverses sharply, giving birth to a classic Bullish Venom Setup or Bearish Venom Setup
The Venom Model (ICT Venom Trading Strategy) is not just a pattern recognition tool but a precise institutional trading model based on time, liquidity, and market structure. By understanding the Initial Balance Range, watching for Liquidity Sweeps, and entering trades from FVG zones or Order Blocks, traders can anticipate market reversals with high accuracy. This strategy is widely respected among ICT followers because it offers both risk management discipline and clear entry/exit conditions. In short, the Venom Model transforms liquidity manipulation into actionable trading opportunities.
Bullish Setup :
Bearish Setup :
🔵 How to Use
The ICT Venom Model is applied by observing price behavior during the early hours of the New York session. The first step is to define the Initial Range, also called the Venom Box, which is formed between 08:00 and 09:30 AM EST. This range marks the high and low points where institutional traders often create traps for retail participants. Once the official market opens at 09:30 AM, price usually sweeps either the top or bottom of this box to collect liquidity.
After this liquidity grab, the market tends to reverse in alignment with the true directional bias. To confirm the setup, traders look for signals such as a Market Structure Shift (MSS), Change in State of Delivery (CISD), or the appearance of a Fair Value Gap (FVG). These elements validate the reversal and provide precise levels for trade execution.
🟣 Bullish Setup
In a Bullish Venom Setup, the market first sweeps the low of the Venom Box after 09:30 AM, triggering sell-side liquidity collection. This downward move is often sharp and deceptive, designed to stop out retail long positions and attract new sellers. Once liquidity is taken, the market typically shifts direction, forming an MSS or CISD that signals a reversal to the upside.
Traders then wait for price to retrace into a Fair Value Gap or a demand-side Order Block created during the reversal leg. This retracement offers the ideal entry point for long positions. Stop-loss placement should be just below the liquidity sweep low, while profit targets are set at the Venom Box high and, if momentum continues, at higher session or daily highs.
🟣 Bearish Setup
In a Bearish Venom Setup, the process is similar but reversed. After the Initial Range is defined, if price breaks above the Venom Box high following the 09:30 AM open, it signals a false breakout designed to collect buy-side liquidity. This move usually traps eager buyers and clears out stop-losses above the high.
After the liquidity sweep, confirmation comes through an MSS or CISD pointing to a reversal downward. At this stage, traders anticipate a retracement into a Fair Value Gap or a supply-side Order Block formed during the reversal. Short entries are taken within this zone, with stop-loss positioned just above the liquidity sweep high. The logical profit targets include the Venom Box low and, in stronger bearish momentum, deeper session or daily lows.
🔵 Settings
Refine Order Block : Enables finer adjustments to Order Block levels for more accurate price responses.
Mitigation Level OB : Allows users to set specific reaction points within an Order Block, including: Proximal: Closest level to the current price. 50% OB: Midpoint of the Order Block. Distal: Farthest level from the current price.
FVG Filter : The Judas Swing indicator includes a filter for Fair Value Gap (FVG), allowing different filtering based on FVG width: FVG Filter Type: Can be set to "Very Aggressive," "Aggressive," "Defensive," or "Very Defensive." Higher defensiveness narrows the FVG width, focusing on narrower gaps.
Mitigation Level FVG : Like the Order Block, you can set price reaction levels for FVG with options such as Proximal, 50% OB, and Distal.
CISD : The Bar Back Check option enables traders to specify the number of past candles checked for identifying the CISD Level, enhancing CISD Level accuracy on the chart.
🔵 Conclusion
The ICT Venom Model is more than just a reversal setup; it is a complete intraday trading framework that blends liquidity theory, time precision, and market structure analysis. By focusing on the Initial Range between 08:00 and 09:30 AM New York time and observing how price reacts at the 09:30 AM open, traders can identify liquidity sweeps that reveal institutional intentions.
Whether in a Bullish Venom Setup or a Bearish Venom Setup, the model allows for precise entries through Fair Value Gaps (FVGs) and Order Blocks, while maintaining clear risk management with well-defined stop-loss and target levels.
Ultimately, the ICT Venom Model provides traders with a structured way to filter false moves and align their trades with institutional order flow. Its strength lies in transforming liquidity manipulation into actionable opportunities, giving intraday traders an edge in timing, accuracy, and consistency. For those who master its logic, the Venom Model becomes not only a strategy for entry and exit, but also a deeper framework for understanding how liquidity truly drives price in the New York session.

Liquidity Grab Strategy SuvorovLiquidity grab strategy
Description:
This indicator is built around the Liquidity Grab Strategy, which identifies and reacts to stop hunts and false breakouts at key swing highs and lows. It detects where liquidity is likely to be resting (e.g., above highs or below lows) and provides trade signals when that liquidity is taken and price begins to reverse.
Core Features:
Liquidity Detection: Automatically identifies and marks key swing highs and lows where stop-losses are likely to accumulate.
Entry Signals: Generates BUY/SELL signals after a liquidity sweep and a confirmed reversal — based on price action, volume, or structure shifts.
Stop Loss & Take Profit Zones: Visualizes stop-loss just beyond the liquidity wick and take-profit near the next major structure point, with configurable Risk/Reward ratios.
False Signal Filters: Optional filters based on volume spikes, RSI divergence, or market structure confirmation.
Multi-Timeframe Logic: Supports separate timeframes for structure detection and signal confirmation (e.g., structure on 1H, entry on 5m).