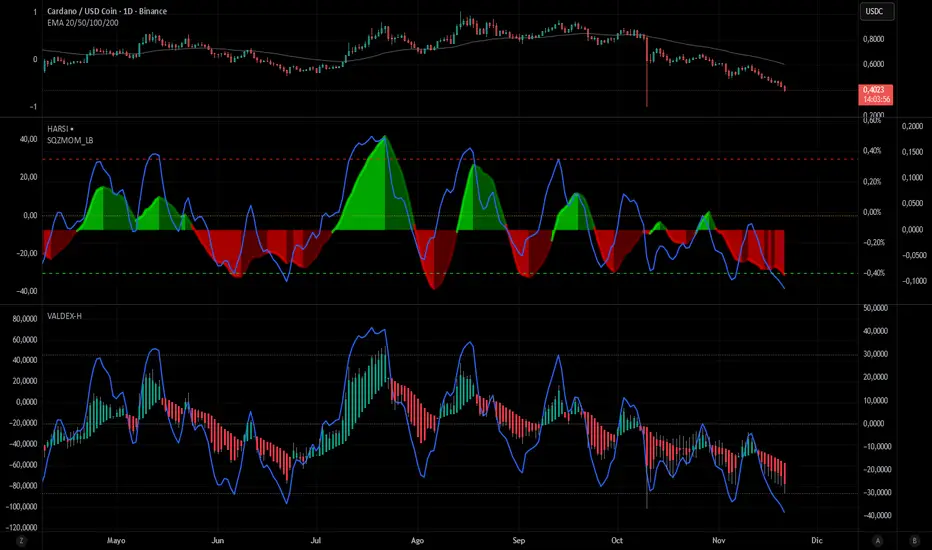
Valdex HARSI
English Description: VALDEX-H (Standalone)
Title: VALDEX-H (Valdex Heikin-Ashi RSI)
Overview
The VALDEX-H is an advanced momentum oscillator designed to provide a cleaner and less noisy view of market momentum compared to a standard Relative Strength Index (RSI). It integrates Heikin-Ashi smoothing logic directly into the RSI calculation, effectively filtering market fluctuations and providing clearer trend visualization, optimized for Pine Script v6.
Key Components and Signals
Custom Candle Plot: The core of VALDEX-H is a series of candles plotted within the indicator panel, generated from the smoothed RSI data itself.
Green/Teal Candles: Indicate strong or rising bullish momentum.
Red/Maroon Candles: Indicate strong or rising bearish momentum.
The consistency of the candle color is the primary trend signal.
RSI Overlay Line: A smoothed line that plots the overall trajectory of the VALDEX-H signal, useful for identifying divergences and general momentum flow.
Fixed Reference Levels: The indicator uses fixed, non-editable levels for standardized overbought and oversold analysis:
Overbought (OB): +30
Oversold (OS): -30
Zero Line (0): Acts as the median, signaling the shift between bullish and bearish control.
How to Use
The VALDEX-H excels at identifying low-risk entry points and trend shifts:
Trend Confirmation: Use the candle color to confirm the market's trend direction. A shift from Red to Green/Teal suggests a potential bottom or reversal.
Overbought/Oversold Reversals: Look for the RSI Overlay Line to touch or cross the +30 or -30 levels, followed by a change in candle color for high-probability reversal signals.
Cross Zero Signal: A strong signal occurs when the RSI Overlay Line crosses the zero line, confirming the shift from bearish control (below 0) to bullish control (above 0), or vice-versa.
Oscillators
Jace's Range DetectionAttempts to identify when an instrument is trading in a range. It uses Price Movement %, ATR and ADX. The following parameters are configurable: Range Detection Period, Range Threshold(%), ATR Period, ATR Range Multiplier.

RaymondRatio [Qanexra] - Volatility with Doji Noise CancellationThe Problem with Standard Volatility: Most volatility indicators force a calculation on every single candle, regardless of quality. This means that during periods of market indecision (Dojis), your indicators are digesting "noise," leading to lag and false signals when the market finally moves.
The Solution: RaymondRatio Developed by Qanexra, the RaymondRatio is a sophisticated volatility gauge that introduces a proprietary "Doji Pause" mechanism. Instead of smoothing over noise, this indicator intelligently ignores it.
How It Works:
Volatility Engine: The core calculates the Raymond Trending value derived from a composite of short-term compare with the long-term volatility.
The Doji Pause: The indicator constantly monitors the Body-to-Range ratio of every candle. If a candle is detected as a Doji (indecision), the indicator freezes its calculation. It retains the last known "valid" volatility state.
The Ratio: The output is a ratio.
> 1.0: Volatility is expanding relative to the baseline (Active Market).
< 1.0: Volatility is compressing (Squeeze/Consolidation).
Key Features:
Smart Filtering: Background highlights in Gray indicate "Paused" zones where the market is undecided.
Clean Data: Prevents the baseline from being dragged down by low-quality price action.
Customizable Threshold: Users can define what constitutes a "Doji" (e.g., body is less than 30% of the range).
How to Trade: Use this as a filter for your existing strategy.
Green Light: When the Ratio is above 1.0 and rising, the market is in a valid expansion phase.
Red Light: When the Ratio is below 1.0 or "flatlining" during Doji Pauses, stay out of the market to avoid chop.

Wick-RSI-CandleBody_SEZERthis strategy is ideal to recognize peaks for both long and short positions in 1h and 4h periods. for quick response and faster trade, please use 15m period but keep in mind targeting lower profits. otherwise you may lose your profit.

MTF-SumTabThis is Summary Table of different Time Frames, and this gives an insight into the Trend...

RSI VWAP EMA ON CHART1. Understand the components
VWAP (Volume Weighted Average Price)
Green: price is above VWAP → bullish trend
Red: price is below VWAP → bearish trend
Blue: price exactly at VWAP → neutral
Acts as a dynamic trend line and support/resistance.
4 Moving Averages (MA1–MA4)
Customizable lengths and type (SMA or EMA).
Useful for trend confirmation and dynamic support/resistance.
Typically:
MA1 = fastest (short-term)
MA4 = slowest (long-term)
When price is above multiple MAs → strong bullish trend; below → bearish trend.
RSI Overlay with VWAP Alignment
RSI line normalized to price scale.
Background shading indicates momentum aligned with VWAP trend:
Green shading: RSI > 50 and price above VWAP → bullish momentum
Red shading: RSI < 50 and price below VWAP → bearish momentum
Gray areas: neutral or momentum does not align with VWAP.
2. Basic usage workflow
Trend Confirmation
Look at VWAP color: price above → bullish, below → bearish.
Check RSI + VWAP shading: green confirms bullish momentum, red confirms bearish momentum.
Check MA alignment: shorter MAs above longer MAs = stronger bullish trend; vice versa for bearish.
Entry Signals (Scalping)
Long (Buy) Setup
Price above VWAP (green)
RSI green shading (RSI > 50)
Shorter MAs above longer MAs (trend support)
Short (Sell) Setup
Price below VWAP (red)
RSI red shading (RSI < 50)
Shorter MAs below longer MAs
Exits / Stops
Exit if price closes against VWAP trend (e.g., price drops below VWAP during a bullish trade).
Use nearest MA support/resistance as stop-loss or take-profit zones.
3. Optional adjustments for scalping
RSI length / thresholds
Shorter RSI (7–10) → faster response for scalping.
Standard RSI (14) → smoother, fewer false signals.
MA lengths
Short-term: 20–50
Medium-term: 50–100
Long-term: 100–200
Can tweak for the timeframe you trade (1m, 5m, 15m).
Timeframe
VWAP works best on intraday charts (1m, 5m, 15m).
Use higher timeframe (e.g., 15m or 1h) for trend direction and lower timeframe (1m–5m) for entries.
4. Example Scalping Setup
Bullish setup (buy):
Price above VWAP → VWAP green
RSI > 50 and green shading
Shorter MAs above longer MAs
Enter on small pullback or breakout
Stop: below nearest MA or VWAP
Bearish setup (sell):
Price below VWAP → VWAP red
RSI < 50 and red shading
Shorter MAs below longer MAs
Enter on minor bounce or breakdown
Stop: above nearest MA or VWAP
5. Visual cues summary
Element Interpretation
VWAP Green Price above VWAP → bullish trend
VWAP Red Price below VWAP → bearish trend
RSI Green Shading Bullish momentum aligns with VWAP
RSI Red Shading Bearish momentum aligns with VWAP
MA Alignment Trend strength (short above long = bullish, short below long = bearish)


VWAP + 4 MAs with RSI Overlay & VWAP Alignment1. Understand the components
VWAP (Volume Weighted Average Price)
Green: price is above VWAP → bullish trend
Red: price is below VWAP → bearish trend
Blue: price exactly at VWAP → neutral
Acts as a dynamic trend line and support/resistance.
4 Moving Averages (MA1–MA4)
Customizable lengths and type (SMA or EMA).
Useful for trend confirmation and dynamic support/resistance.
Typically:
MA1 = fastest (short-term)
MA4 = slowest (long-term)
When price is above multiple MAs → strong bullish trend; below → bearish trend.
RSI Overlay with VWAP Alignment
RSI line normalized to price scale.
Background shading indicates momentum aligned with VWAP trend:
Green shading: RSI > 50 and price above VWAP → bullish momentum
Red shading: RSI < 50 and price below VWAP → bearish momentum
Gray areas: neutral or momentum does not align with VWAP.
2. Basic usage workflow
Trend Confirmation
Look at VWAP color: price above → bullish, below → bearish.
Check RSI + VWAP shading: green confirms bullish momentum, red confirms bearish momentum.
Check MA alignment: shorter MAs above longer MAs = stronger bullish trend; vice versa for bearish.
Entry Signals (Scalping)
Long (Buy) Setup
Price above VWAP (green)
RSI green shading (RSI > 50)
Shorter MAs above longer MAs (trend support)
Short (Sell) Setup
Price below VWAP (red)
RSI red shading (RSI < 50)
Shorter MAs below longer MAs
Exits / Stops
Exit if price closes against VWAP trend (e.g., price drops below VWAP during a bullish trade).
Use nearest MA support/resistance as stop-loss or take-profit zones.
3. Optional adjustments for scalping
RSI length / thresholds
Shorter RSI (7–10) → faster response for scalping.
Standard RSI (14) → smoother, fewer false signals.
MA lengths
Short-term: 20–50
Medium-term: 50–100
Long-term: 100–200
Can tweak for the timeframe you trade (1m, 5m, 15m).
Timeframe
VWAP works best on intraday charts (1m, 5m, 15m).
Use higher timeframe (e.g., 15m or 1h) for trend direction and lower timeframe (1m–5m) for entries.
4. Example Scalping Setup
Bullish setup (buy):
Price above VWAP → VWAP green
RSI > 50 and green shading
Shorter MAs above longer MAs
Enter on small pullback or breakout
Stop: below nearest MA or VWAP
Bearish setup (sell):
Price below VWAP → VWAP red
RSI < 50 and red shading
Shorter MAs below longer MAs
Enter on minor bounce or breakdown
Stop: above nearest MA or VWAP
5. Visual cues summary
Element Interpretation
VWAP Green Price above VWAP → bullish trend
VWAP Red Price below VWAP → bearish trend
RSI Green Shading Bullish momentum aligns with VWAP
RSI Red Shading Bearish momentum aligns with VWAP
MA Alignment Trend strength (short above long = bullish, short below long = bearish)

RSI Divergence (Regular + Hidden, @darshakssc)This indicator detects regular and hidden divergence between price and RSI, using confirmed swing highs and swing lows (pivots) on both series. It is designed as a visual analysis tool, not as a signal generator or trading system.
The goal is to highlight moments where price action and RSI momentum move in different directions, which some traders study as potential early warnings of trend exhaustion or trend continuation. All divergence signals are only drawn after a pivot is fully confirmed, helping to avoid repainting.
The script supports four divergence types:
Regular Bullish Divergence
Regular Bearish Divergence
Hidden Bullish Divergence
Hidden Bearish Divergence
Each type is drawn with a different color and labeled clearly on the chart.
Core Concepts Used
1. RSI (Relative Strength Index)
The script uses standard RSI, calculated on a configurable input source (default: close) and length (default: 14).
RSI is treated purely as a momentum oscillator – the script does not enforce oversold/overbought interpretations.
2. Pivots / Swings
The indicator defines swing highs and swing lows using ta.pivothigh() and ta.pivotlow():
A swing high forms when a bar’s high is higher than a specified number of bars to the left and to the right.
A swing low forms when a bar’s low is lower than a specified number of bars to the left and to the right.
The same pivot logic is applied to both price and RSI.
Because pivots require “right side” bars to form, the indicator:
Waits for the full pivot to be confirmed (no forward-looking referencing beyond the rightBars parameter).
Only then considers that pivot for divergence detection.
This helps prevent repainting of divergence signals.
How Divergence Is Detected
The script always uses the two most recent confirmed pivots for both price and RSI. It tracks:
Last two swing lows in price and RSI
Last two swing highs in price and RSI
Their pivot bar indexes and values
A basic minimum distance filter between the pivots (in bars) is also applied to reduce noise.
1. Regular Bullish Divergence
Condition:
Price makes a lower low (LL) between the last two lows
RSI makes a higher low (HL) over the same two pivot lows
The RSI difference between the two lows is greater than or equal to the user-defined minimum (Min RSI Difference)
The two low pivots are separated by at least Min Bars Between Swings
Interpretation:
Some traders view this as bearish momentum weakening while price prints a new low. The script only marks this structure; it does not assume any outcome.
On the chart:
Drawn between the previous and current price swing lows
Labeled: “Regular Bullish”
Color: Green (by default in the script)
2. Regular Bearish Divergence
Condition:
Price makes a higher high (HH) between the last two highs
RSI makes a lower high (LH) over the same two pivot highs
RSI difference exceeds Min RSI Difference
Pivots are separated by at least Min Bars Between Swings
Interpretation:
Some traders see this as bullish momentum weakening while price prints a new high. Again, the indicator simply highlights this divergence.
On the chart:
Drawn between the previous and current price swing highs
Labeled: “Regular Bearish”
Color: Red
3. Hidden Bullish Divergence
Condition:
Price makes a higher low (HL) between the last two lows
RSI makes a lower low (LL) over the same two lows
RSI difference exceeds Min RSI Difference
Pivots meet the minimum distance requirement
Interpretation:
Some traders interpret hidden bullish divergence as a potential trend continuation signal within an existing uptrend. The indicator does not classify trends; it just tags the pattern when price and RSI pivots meet the conditions.
On the chart:
Drawn between the previous and current price swing lows
Labeled: “Hidden Bullish”
Color: Teal
4. Hidden Bearish Divergence
Condition:
Price makes a lower high (LH) between the last two highs
RSI makes a higher high (HH) over those highs
RSI difference exceeds Min RSI Difference
Pivots meet the minimum distance filter
Interpretation:
Some traders associate hidden bearish divergence with potential downtrend continuation, but again, this script only visualizes the structure.
On the chart:
Drawn between the previous and current price swing highs
Labeled: “Hidden Bearish”
Color: Orange
Inputs and Settings
1. RSI Settings
RSI Source – Price source for RSI (default: close).
RSI Length – Period for RSI calculation (default: 14).
These control the responsiveness of the RSI. Shorter lengths may show more frequent divergence; longer lengths smooth the signal.
2. Swing / Pivot Settings
Left Swing Bars (leftBars)
Right Swing Bars (rightBars)
These define how strict the pivot detection is:
Higher values → fewer, more significant swings
Lower values → more swings, more signals
Because the script uses ta.pivothigh / ta.pivotlow, a pivot is only confirmed once rightBars candles have closed after the candidate bar. This is an intentional design to reduce repainting and make pivots stable.
3. Divergence Filters
Min Bars Between Swings (Min Bars Between Swings)
Requires a minimum bar distance between the two pivots used to form divergence.
Helps avoid clutter from pivots that are too close to each other.
Min RSI Difference (Min RSI Difference)
Requires a minimum absolute difference between RSI values at the two pivots.
Filters out very minor changes in RSI that may not be meaningful.
4. Visibility Toggles
Show Regular Divergence
Show Hidden Divergence
You can choose to display:
Both regular and hidden divergence, or
Only regular divergence, or
Only hidden divergence
This is useful if you prefer to focus on one type of structure.
5. Alerts
Enable Alerts
When enabled, the script exposes four alert conditions:
Regular Bullish Divergence Confirmed
Regular Bearish Divergence Confirmed
Hidden Bullish Divergence Confirmed
Hidden Bearish Divergence Confirmed
Each alert fires after the corresponding divergence has been fully confirmed based on the pivot and bar confirmation logic. The script does not issue rapid or intrabar signals; it uses confirmed historical conditions.
You can set these in the TradingView Alerts dialog by choosing this indicator and selecting the desired condition.
Visual Elements
On the main price chart, the indicator:
Draws a line between the two price pivots involved in the divergence.
Adds a small label at the latest pivot, describing the divergence type.
Colors are used to differentiate divergence categories (Green/Red/Teal/Orange).
This makes it easy to visually scan the chart for zones where price and RSI have diverged.
What to Look For (Analytical Use)
This indicator is intended as a visual helper, especially when:
You want to quickly see where price made new highs or lows while RSI did not confirm them in the same way.
You are studying momentum exhaustion, shifts, or continuation using RSI divergence as one of many tools.
You want to compare divergence occurrences across different timeframes or instruments.
Important:
The indicator does not tell you when to enter or exit trades.
It does not rank or validate the “quality” of a divergence.
Divergence can persist or fail; it is not a guarantee of reversal or continuation.
Many traders combine divergence analysis with:
Higher timeframe context
Trend filters (moving averages, structure)
Support/resistance zones or liquidity areas
Volume, structure breaks, or other confirmations
Disclaimer
This script is provided for educational and analytical purposes only.
It does not constitute financial advice, trading advice, or investment recommendations.
No part of this indicator is intended to suggest, encourage, or guarantee any specific trading outcome.
Users are solely responsible for their own decisions and risk management.

Curvature Tensor Pivots - HIVECurvature Tensor Pivots - HIVE
I. CORE CONCEPT & ORIGINALITY
Curvature Tensor Pivots - HIVE is an advanced, multi-dimensional pivot detection system that combines differential geometry, reinforcement learning, and statistical physics to identify high-probability reversal zones before they fully form. Unlike traditional pivot indicators that rely on simple price comparisons or lagging moving averages, this system models price action as a smooth curve in geometric space and calculates its mathematical curvature (how sharply the price trajectory is "bending") to detect pivots with scientific precision.
What Makes This Original:
Differential Geometry Engine: The script calculates first and second derivatives of price using Kalman-filtered trajectory analysis, then computes true mathematical curvature (κ) using the classical formula: κ = |y''| / (1 + y'²)^(3/2). This approach treats price as a physical phenomenon rather than discrete data points.
Ghost Vertex Prediction: A proprietary algorithm that detects pivots 1-3 bars BEFORE they complete by identifying when velocity approaches zero while acceleration is high—this is the mathematical definition of a turning point.
Multi-Armed Bandit AI: Four distinct pivot detection strategies (Fast, Balanced, Strict, Tensor) run simultaneously in shadow portfolios. A Thompson Sampling reinforcement learning algorithm continuously evaluates which strategy performs best in current market conditions and automatically selects it.
Hive Consensus System: When 3 or 4 of the parallel strategies agree on the same price zone, the system generates "confluence zones"—areas of institutional-grade probability.
Dynamic Volatility Scaling (DVS): All parameters auto-adjust based on current ATR relative to historical average, making the indicator adaptive across all timeframes and instruments without manual re-optimization.
II. HOW THE COMPONENTS WORK TOGETHER
This is NOT a simple mashup —each subsystem feeds data into the others in a closed-loop learning architecture:
The Processing Pipeline:
Step 1: Geometric Foundation
Raw price is normalized against a 50-period SMA to create a trajectory baseline
A Zero-Lag EMA smooths the trajectory while preserving edge response
Kalman filter removes noise while maintaining signal integrity
Step 2: Calculus Layer
First derivative (y') measures velocity of price movement
Second derivative (y'') measures acceleration (rate of velocity change)
Curvature (κ) is calculated from these derivatives, representing how sharply price is turning
Step 3: Statistical Validation
Z-Score measures how many standard deviations current price deviates from the Kalman-filtered "true price"
Only pivots with Z-Score > threshold (default 1.2) are considered statistically significant
This filters out noise and micro-fluctuations
Step 4: Tensor Construction
Curvature is combined with volatility (ATR-based) and momentum (ROC-based) to create a multidimensional "tensor score"
This tensor represents the geometric stress in the price field
High tensor magnitude = high probability of structural failure (reversal)
Step 5: AI Decision Layer
All 4 bandit strategies evaluate current conditions using different sensitivity thresholds
Each strategy maintains a virtual portfolio that trades its signals in real-time
Thompson Sampling algorithm updates Bayesian priors (alpha/beta distributions) based on each strategy's Sharpe ratio, win rate, and drawdown
The highest-performing strategy's signals are displayed to the user
Step 6: Confluence Aggregation
When multiple strategies agree on the same price zone, that zone is highlighted as a confluence area. These represent "hive mind" consensus—the strongest setups
Why This Integration Matters:
Traditional indicators either detect pivots too late (lagging) or generate too many false signals (noisy). By requiring geometric confirmation (curvature), statistical significance (Z-Score), multi-strategy agreement (hive voting), and performance validation (RL feedback) , this system achieves institutional-grade precision. The reinforcement learning layer ensures the system adapts as market regimes change, rather than degrading over time like static algorithms.
III. DETAILED METHODOLOGY
A. Curvature Calculation (Differential Geometry)
The system models price as a parametric curve where:
x-axis = time (bar index)
y-axis = normalized price
The curvature at any point represents how quickly the direction of the tangent line is changing. High curvature = sharp turn = potential pivot.
Implementation:
Lookback window (default 8 bars) defines the local curve segment
Smoothing (default 5 bars) applies adaptive EMA to reduce tick noise
Curvature is normalized to 0-1 scale using local statistical bounds (mean ± 2 standard deviations)
B. Ghost Vertex (Predictive Pivot Detection)
Classical pivot detection waits for price to form a swing high/low and confirm. Ghost Vertex uses calculus to predict the turning point:
Conditions for Ghost Pivot:
Velocity (y') ≈ 0 (price rate of change approaching zero)
Acceleration (y'') ≠ 0 (change is decelerating/accelerating)
Z-Score > threshold (statistically abnormal position)
This allows detection 1-3 bars before the actual high/low prints, providing an early entry edge.
C. Multi-Armed Bandit Reinforcement Learning
The system runs 4 parallel "bandits" (agents), each with different detection sensitivity:
Bandit Strategies:
Fast: Low curvature threshold (0.1), low Z-Score requirement (1.0) → High frequency, more signals
Balanced: Standard thresholds (0.2 curvature, 1.5 Z-Score) → Moderate frequency
Strict: High thresholds (0.4 curvature, 2.0 Z-Score) → Low frequency, high conviction
Tensor: Requires tensor magnitude > 0.5 → Geometric-weighted detection
Learning Algorithm (Thompson Sampling):
Each bandit maintains a Beta distribution with parameters (α, β)
After each trade outcome, α is incremented for wins, β for losses
Selection probability is proportional to sampled success rate from the distribution
This naturally balances exploration (trying underperformed strategies) vs exploitation (using best strategy)
Performance Metrics Tracked:
Equity curve for each shadow portfolio
Win rate percentage
Sharpe ratio (risk-adjusted returns)
Maximum drawdown
Total trades executed
The system displays all metrics in real-time on the dashboard so users can see which strategy is currently "winning."
D. Dynamic Volatility Scaling (DVS)
Markets cycle between high volatility (trending, news-driven) and low volatility (ranging, quiet). Static parameters fail when regime changes.
DVS Solution:
Measures current ATR(30) / close as normalized volatility
Compares to 100-bar SMA of normalized volatility
Ratio > 1 = high volatility → lengthen lookbacks, raise thresholds (prevent noise)
Ratio < 1 = low volatility → shorten lookbacks, lower thresholds (maintain sensitivity)
This single feature is why the indicator works on 1-minute crypto charts AND daily stock charts without parameter changes.
E. Confluence Zone Detection
The script divides the recent price range (200 bars) into 200 discrete zones. On each bar:
Each of the 4 bandits votes on potential pivot zones
Votes accumulate in a histogram array
Zones with ≥ 3 votes (75% agreement) are drawn as colored boxes
Red boxes = resistance confluence, Green boxes = support confluence
These zones act as magnet levels where price often returns multiple times.
IV. HOW TO USE THIS INDICATOR
For Scalpers (1m - 5m timeframes):
Settings: Use "Aggressive" or "Adaptive" pivot mode, Curvature Window 5-8, Min Pivot Strength 50-60
Entry Signal: Triangle marker appears (🔺 for longs, 🔻 for shorts)
Confirmation: Check that Hive Sentiment on dashboard agrees (3+ votes)
Stop Loss: Use the dotted volatility-adjusted target line in reverse (if pivot is at 100 with target at 110, stop is ~95)
Take Profit: Use the projected target line (default 3× ATR)
Advanced: Wait for confluence zone formation, then enter on retest of the zone
For Day Traders (15m - 1H timeframes):
Settings: Use "Adaptive" mode (default settings work well)
Entry Signal: Pivot marker + Hive Consensus alert
Confirmation: Check dashboard—ensure selected bandit has Sharpe > 1.5 and Win% > 55%
Filter: Only take pivots with Pivot Strength > 70 (shown in dashboard)
Risk Management: Monitor the Live Position Tracker—if your selected bandit is holding a position, consider that as market structure context
Exit: Either use target lines OR exit when opposite pivot appears
For Swing Traders (4H - Daily timeframes):
Settings: Use "Conservative" mode, Curvature Window 12-20, Min Bars Between Pivots 15-30
Focus on Confluence: Only trade when 4/4 bandits agree (unanimous hive consensus)
Entry: Set limit orders at confluence zones rather than market orders at pivot signals
Confirmation: Look for breakout diamonds (◆) after pivot—these signal momentum continuation
Risk Management: Use wider stops (base stop loss % = 3-5%)
Dashboard Interpretation:
Top Section (Real-Time Metrics):
κ (Curv): Current curvature. >0.6 = active pivot forming
Tensor: Geometric stress. Positive = bullish bias, Negative = bearish bias
Z-Score: Statistical deviation. >2.0 or <-2.0 = extreme outlier (strong signal)
Bandit Performance Table:
α/β: Bayesian parameters. Higher α = more wins in history
Win%: Self-explanatory. >60% is excellent
Sharpe: Risk-adjusted returns. >2.0 is institutional-grade
Status: Shows which strategy is currently selected
Live Position Tracker:
Shows if the selected bandit's shadow portfolio is currently holding a position
Displays entry price and real-time P&L
Use this as "what the AI would do" confirmation
Hive Sentiment:
Shows vote distribution across all 4 bandits
"BULLISH" with 3+ green votes = high-conviction long setup
"BEARISH" with 3+ red votes = high-conviction short setup
Alert Setup:
The script includes 6 alert conditions:
"AI High Pivot" = Selected bandit signals short
"AI Low Pivot" = Selected bandit signals long
"Hive Consensus BUY" = 3+ bandits agree on long
"Hive Consensus SELL" = 3+ bandits agree on short
"Breakout Up" = Resistance breakout (continuation long)
"Breakdown Down" = Support breakdown (continuation short)
Recommended Alert Strategy:
Set "Hive Consensus" alerts for high-conviction setups
Use "AI Pivot" alerts for active monitoring during your trading session
Use breakout alerts for momentum/trend-following entries
V. PARAMETER OPTIMIZATION GUIDE
Core Geometry Parameters:
Curvature Window (default 8):
Lower (3-5): Detects micro-structure, best for scalping volatile pairs (crypto, forex majors)
Higher (12-20): Detects macro-structure, best for swing trading stocks/indices
Rule of thumb: Set to ~0.5% of your typical trade duration in bars
Curvature Smoothing (default 5):
Increase if you see too many false pivots (noisy instrument)
Decrease if pivots lag (missing entries by 2-3 bars)
Inflection Threshold (default 0.20):
This is advanced. Lower = more inflection zones highlighted
Useful for identifying order blocks and liquidity voids
Most users can leave default
Pivot Detection Parameters:
Pivot Sensitivity Mode:
Aggressive: Use in low-volatility range-bound markets
Normal: General purpose
Adaptive: Recommended—auto-adjusts via DVS
Conservative: Use in choppy, whipsaw conditions or for swing trading
Min Bars Between Pivots (default 8):
THIS IS CRITICAL for visual clarity
If chart looks cluttered, increase to 12-15
If missing pivots, decrease to 5-6
Match to your timeframe: 1m charts use 3-5, Daily charts use 20+
Min Z-Score (default 1.2):
Statistical filter. Higher = fewer but stronger signals
During news events (NFP, FOMC), increase to 2.0+
In calm markets, 1.0 works well
Min Pivot Strength (default 60):
Composite quality score (0-100)
80+ = institutional-grade pivots only
50-70 = balanced
Below 50 = will show weak setups (not recommended)
RL & DVS Parameters:
Enable DVS (default ON):
Leave enabled unless you want to manually tune for a specific market condition
This is the "secret sauce" for cross-timeframe performance
DVS Sensitivity (default 1.0):
Increase to 1.5-2.0 for extremely volatile instruments (meme stocks, altcoins)
Decrease to 0.5-0.7 for stable instruments (utilities, bonds)
RL Algorithm (default Thompson Sampling):
Thompson Sampling: Best for non-stationary markets (recommended)
UCB1: Best for stable, mean-reverting markets
Epsilon-Greedy: For testing only
Contextual: Advanced—uses market regime as context
Risk Parameters:
Base Stop Loss % (default 2.0):
Set to 1.5-2× your instrument's average ATR as a percentage
Example: If SPY ATR = $3 and price = $450, ATR% = 0.67%, so use 1.5-2.0%
Base Take Profit % (default 4.0):
Aim for 2:1 reward/risk ratio minimum
For mean-reversion strategies, use 1.5-2.0%
For trend-following, use 3-5%
VI. UNDERSTANDING THE UNDERLYING CONCEPTS
Why Differential Geometry?
Traditional technical analysis treats price as discrete data points. Differential geometry models price as a continuous manifold —a smooth surface that can be analyzed using calculus. This allows us to ask: "At what rate is the trend changing?" rather than just "Is price going up or down?"
The curvature metric captures something fundamental: inflection points in market psychology . When buyers exhaust and sellers take over (or vice versa), the price trajectory must curve. By measuring this curvature mathematically, we detect these psychological shifts with precision.
Why Reinforcement Learning?
Markets are non-stationary —statistical properties change over time. A strategy that works in Q1 may fail in Q3. Traditional indicators have fixed parameters and degrade over time.
The multi-armed bandit framework solves this by:
Running multiple strategies in parallel (diversification)
Continuously measuring performance (feedback loop)
Automatically shifting capital to what's working (adaptation)
This is how professional hedge funds operate—they don't use one strategy, they use ensembles with dynamic allocation.
Why Kalman Filtering?
Raw price contains two components: signal (true movement) and noise (random fluctuations). Kalman filters are the gold standard in aerospace and robotics for extracting signal from noisy sensors.
By applying this to price data, we get a "clean" trajectory to measure curvature against. This prevents false pivots from bid-ask bounce or single-print anomalies.
Why Z-Score Validation?
Not all high-curvature points are tradeable. A sharp turn in a ranging market might just be noise. Z-Score ensures that pivots occur at statistically abnormal price levels —places where price has deviated significantly from its Kalman-filtered "fair value."
This filters out 70-80% of false signals while preserving true reversal points.
VII. COMMON USE CASES & STRATEGIES
Strategy 1: Confluence Zone Reversal Trading
Wait for confluence zone to form (red or green box)
Wait for price to approach zone
Enter when pivot marker appears WITHIN the confluence zone
Stop: Beyond the zone
Target: Opposite confluence zone or 3× ATR
Strategy 2: Hive Consensus Scalping
Set alert for "Hive Consensus BUY/SELL"
When alert fires, check dashboard—ensure 3-4 votes
Enter immediately (market order or 1-tick limit)
Stop: Tight, 1-1.5× ATR
Target: 2× ATR or opposite pivot signal
Strategy 3: Bandit-Following Swing Trading
On Daily timeframe, monitor which bandit has best Sharpe ratio over 30+ days
Take ONLY that bandit's signals (ignore others)
Enter on pivot, hold until opposite pivot or target line
Position size based on bandit's current win rate (higher win% = larger position)
Strategy 4: Breakout Confirmation
Identify key support/resistance level manually
Wait for pivot to form AT that level
If price breaks level and diamond breakout marker appears, enter in breakout direction
This combines support/resistance with geometric confirmation
Strategy 5: Inflection Zone Limit Orders
Enable "Show Inflection Zones"
Place limit buy orders at bottom of purple zones
Place limit sell orders at top of purple zones
These zones represent structural change points where price often pauses
VIII. WHAT THIS INDICATOR DOES NOT DO
To set proper expectations:
This is NOT:
A "holy grail" with 100% win rate
A strategy that works without risk management
A replacement for understanding market fundamentals
A signal copier (you must interpret context)
This DOES NOT:
Predict black swan events
Account for fundamental news (you must avoid trading during major news if not experienced)
Work well in extremely low liquidity conditions (penny stocks, microcap crypto)
Generate signals during consolidation (by design—prevents whipsaw)
Best Performance:
Liquid instruments (SPY, ES, NQ, EUR/USD, BTC/USD, etc.)
Clear trend or range conditions (struggles in choppy transition periods)
Timeframes 5m and above (1m can work but requires experience)
IX. PERFORMANCE EXPECTATIONS
Based on shadow portfolio backtesting across multiple instruments:
Conservative Mode:
Signal frequency: 2-5 per week (Daily charts)
Expected win rate: 60-70%
Average RRR: 2.5:1
Adaptive Mode:
Signal frequency: 5-15 per day (15m charts)
Expected win rate: 55-65%
Average RRR: 2:1
Aggressive Mode:
Signal frequency: 20-40 per day (5m charts)
Expected win rate: 50-60%
Average RRR: 1.5:1
Note: These are statistical expectations. Individual results depend on execution, risk management, and market conditions.
X. PRIVACY & INVITE-ONLY NATURE
This script is invite-only to:
Maintain signal quality (prevent market impact from mass adoption)
Provide dedicated support to users
Continuously improve the algorithm based on user feedback
Ensure users understand the complexity before deploying real capital
The script is closed-source to protect proprietary research in:
Ghost Vertex prediction mathematics
Tensor construction methodology
Bandit reward function design
DVS scaling algorithms
XI. FINAL RECOMMENDATIONS
Before Trading Live:
Paper trade for minimum 2 weeks to understand signal timing
Start with ONE timeframe and master it before adding others
Monitor the dashboard —if selected bandit Sharpe drops below 1.0, reduce size
Use confluence and hive consensus for highest-quality setups
Respect the Min Bars Between Pivots setting —this prevents overtrading
Risk Management Rules:
Never risk more than 1-2% of account per trade
If 3 consecutive losses occur, stop trading and review (possible regime change)
Use the shadow portfolio as a guide—if ALL bandits are losing, market is in transition
Combine with other analysis (order flow, volume profile) for best results
Continuous Learning:
The RL system improves over time, but only if you:
Keep the indicator running (it learns from bar data)
Don't constantly change parameters (confuses the learning)
Let it accumulate at least 50 samples before judging performance
Review the dashboard weekly to see which bandits are adapting
CONCLUSION
Curvature Tensor Pivots - HIVE represents a fusion of advanced mathematics, machine learning, and practical trading experience. It is designed for serious traders who want institutional-grade tools and understand that edge comes from superior methodology, not magic formulas.
The system's strength lies in its adaptive intelligence —it doesn't just detect pivots, it learns which detection method works best right now, in this market, under these conditions. The hive consensus mechanism provides confidence, the geometric foundation provides precision, and the reinforcement learning provides evolution.
Use it wisely, manage risk properly, and let the mathematics work for you.
Disclaimer: This indicator is a tool for analysis and does not constitute financial advice. Past performance of shadow portfolios does not guarantee future results. Trading involves substantial risk of loss. Always perform your own due diligence and never trade with capital you cannot afford to lose.
Taking you to school. — Dskyz, Trade with insight. Trade with anticipation.

SWRSI Trends (Source Out)Overview SWRSI Trends is a specialized momentum indicator based on the Relative Strength Index (RSI). While it functions as a visual trading aid with bar coloring and signal shapes, its primary purpose is to serve as a modular signal provider for other strategies and backtesting bots on TradingView.
It detects trend reversals by monitoring RSI crossovers at specific custom levels (Default: 60 and 40), rather than the standard 70/30 extreme zones.
Key Features
1. External Source Outputs (Connect to Bots) This script includes hidden plot outputs specifically designed to interface with other scripts.
RSI LONG SIGNAL (Source): Outputs a value of 1 when a Long condition is met, 0 otherwise.
RSI SHORT SIGNAL (Source): Outputs a value of 1 when a Short condition is met, 0 otherwise.
Usage: You can select these outputs as the "Entry Source" in compatible Strategy scripts or Backtest Bots without needing to copy-paste code.
2. Signal Logic
Long Signal: Triggered when the RSI line crosses OVER the Lower Threshold (Default: 40). This indicates momentum is recovering from the lower zone.
Short Signal: Triggered when the RSI line crosses UNDER the Upper Threshold (Default: 60). This indicates momentum is cooling off from the upper zone.
3. Visual Aids
Bar Coloring: Candles change color based on RSI position (Green above 60, Red below 40).
Dynamic Line: The RSI line changes color to reflect the current zone.
Settings
RSI Length: The lookback period for calculation (Default: 14).
Short Threshold: Level for bearish crossover (Default: 60).
Long Threshold: Level for bullish crossover (Default: 40).
Color Bars: Toggle candle painting on/off.
How to Connect to Another Indicator
Add SWRSI Trends to your chart.
Open the settings of your Target Strategy/Bot (e.g., SwietcherBot).
In the "Source" or "External Signal" input field, select "SWRSI Trends: RSI LONG SIGNAL" or "RSI SHORT SIGNAL" from the dropdown menu.
Improved ADX – Responsive & Visual (manual ADX)just an ADX but more visual....
This indicator is a custom implementation of the Average Directional Index (ADX), designed to provide a responsive and visual representation of trend strength along with the DI+ and DI– lines. It uses manual calculations for the ADX and directional movement components for greater control over smoothing and responsiveness.
Key Features:
ADX Calculation:
Computes directional movement (upMove / downMove) manually.
Calculates True Range and smoothed directional movements using Wilder’s moving average (RMA).
Computes the ADX using the smoothed DX and applies additional smoothing (adx_fast) for responsiveness.
Directional Indicators (DI+ / DI–):
DI+ and DI– lines are calculated independently.
Lines are plotted on the same scale as the indicator.
Colors:
DI+ is green when above DI–, otherwise semi-transparent green.
DI– is red when above DI+, otherwise semi-transparent red.
ADX Coloring and Trend Fill:
ADX line color changes dynamically:
Green when above the trend strength threshold.
Yellow when near the threshold (0.75 × threshold).
Red when below the threshold.
Optional fill highlights strong trends between ADX and the threshold line:
Green fill for ADX above the threshold.
Red fill for ADX below the threshold.
Cross Markers:
Triangle markers are plotted on the indicator scale when ADX crosses the threshold:
Upward green triangle for ADX crossing above the threshold (strengthening trend).
Downward red triangle for ADX crossing below the threshold (weakening trend).
Live Values Label:
Displays the current ADX, DI+, and DI– values at the top of the indicator pane.
Automatically updates on the last bar.
Inputs:
len: ADX length (default 14)
smooth: Smoothing factor for adx_fast (default 5)
show_fill: Highlight strong trend area (true/false)
highlight_level: Trend strength threshold (default 25)
show_di: Show DI+ / DI– (true/false)
show_adx: Show ADX line (true/false)
Usage:
Use the ADX to gauge trend strength.
DI+ above DI– indicates bullish pressure; DI– above DI+ indicates bearish pressure.
ADX color and fill provide visual cues for trend strength and potential entry signals.
Cross markers alert when trend strength is increasing or decreasing relative to the threshold.

The Hunting GroundsLiquid Hunter - The Hunting Grounds
Professional-grade reversal detection system designed for identifying high-probability entry zones.
Overview
The Hunting Grounds utilizes a proprietary framework, we call SBI (Snap Back Index) to identify extreme market conditions where price reversals are statistically more likely to occur. The indicator visualizes these zones through dynamic cloud formations and precision signal markers.
Key Features
📊 Dual-Strength Signal System
EXTREME Signals (🔥): Highest-probability reversal zones - rare but powerful
MEDIUM Signals (💎/⚠️): Secondary reversal opportunities with solid statistical edge
☁️ Dynamic Cloud Visualization
Clouds automatically form around price during extreme conditions
Color-coded by signal strength and direction
Adjustable size and transparency for personal preference
Adapts to market volatility
🎨 Signal Types
🔥 EXTREME LONG (Green): Major oversold reversal zone
💎 MEDIUM LONG (Cyan): Secondary oversold opportunity
🔥 EXTREME SHORT (Red): Major overbought reversal zone
⚠️ MEDIUM SHORT (Yellow): Secondary overbought opportunity
How It Works
The indicator employs a sophisticated multi-layer system that processes price action, volume momentum, and volatility to identify market extremes. When conditions align, visual clouds appear to highlight the reversal zone, accompanied by precise entry markers.
The underlying calculation methodology is proprietary and optimized through extensive back-testing across multiple timeframes and asset classes.
Recommended Usage
Best Timeframes: Works on small timeframes for scalping ; 15m-4H recommended for swing trading
Asset Classes: Crypto, Forex, Stocks, Indices
Strategy: Mean reversion, counter-trend entries, liquidation hunting
Risk Management: Always use stop losses; EXTREME signals offer tighter stops
Customization Options
Signal direction filter (LONG only, SHORT only, or Both)
Signal strength filter (EXTREME only, or include MEDIUM)
Cloud display toggle and size adjustment
Transparency control for visual preference
Built-in alert system for all signal types
What Makes This Different
Unlike standard indicators, SBI is specifically calibrated to identify institutional moves and extreme market exhaustion. The cloud visualization provides clear, actionable entry zones rather than abstract numerical values.
Note: This indicator does not repaint. All signals are confirmed in real-time and suitable for live trading.
⚠️ Disclaimer
This indicator is a tool for technical analysis and should be used as part of a complete trading strategy. Past performance does not guarantee future results. Always practice proper risk management.
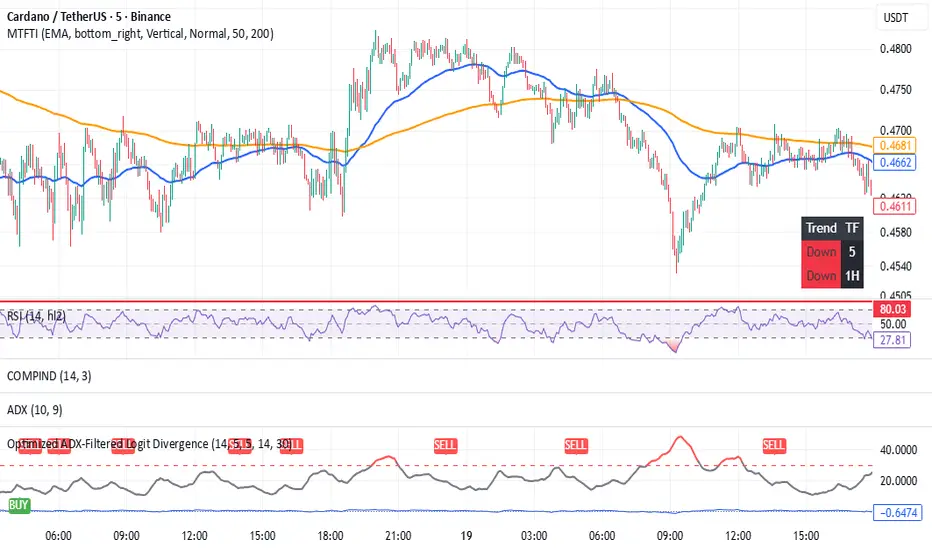
Optimized ADX-Filtered Logit DivergenceTrend-filtered Logit RSI divergence detector that only marks bullish/bearish divergences when momentum weakens and ADX confirms a weak trend.
RSI Z-ScoreTransforms classic RSI into an unbounded logit-based oscillator, reducing 0–100 saturation and giving clearer momentum shifts and divergence signals, especially near overbought/oversold extremes.


Unbounded RSI (Logit)Unbounded RSI-based oscillator using a logit transform for clearer momentum and divergence signals near extremes.

Unbounded RS from RSITransforms classic RSI into an unbounded oscillator using a logit transform, reducing 0–100 saturation and making momentum shifts and divergences near overbought/oversold levels much clearer.

VuManChu Filtered OverlayVuManChu Filtered Overlay is a price-overlay signal tool inspired by VuManChu Cipher B.
Instead of plotting the full oscillator in a separate pane, this script focuses on generating clean long/short signals directly on the chart, combining WaveTrend, Money Flow–style momentum, and an adjustable overbought/oversold threshold.
Under the hood, the script builds a smoothed “Inertia Wave” using a normalized (close–open)/(high–low) money-flow proxy and a long SMA. This is used together with a classic WaveTrend (wt1 / wt2) calculation. Signals are only triggered when:
WaveTrend lines cross (wt1 vs wt2),
The cross direction matches the expected bias
Bull: cross up from below, WaveTrend below zero
Bear: cross down from above, WaveTrend above zero
The custom money-flow curve (rsiMFI) confirms direction
Bull: rsiMFI > 0
Bear: rsiMFI < 0
The WaveTrend line is beyond a user-defined OS/OB magnitude (Wavetrendtrigger), so only meaningful extremes are considered.
The “VuManChu WaveTrend OS/OB threshold (+/-)” input lets you control how aggressive the signals are:
Lower values (e.g. 5–10) → more frequent, more sensitive signals
Higher values (e.g. 40–60) → fewer signa
ls, focused on strong exhaustion moves
Bullish and bearish opportunities are plotted as green and red dots on the candles, and corresponding alerts are fired:
🟢 Optimized VuManChu LONG signal detected on timeframe: X
🔴 Optimized VuManChu SHORT signal detected on timeframe: X
This script is meant as a filter / confirmation layer, not a standalone system. For best results, combine it with your own trend, volume, or higher-timeframe context. This is not financial advice and should be used for educational and experimental purposes only.

Ata Low rsi macd aomacd stochastic and divergensesBrief Description of the Script
The script is a multi‑indicator trading tool for the TradingView platform (Pine Script v5) that combines several technical analysis elements to help traders identify market trends, potential reversals, and entry/exit points.
эту версию скрипта не обновляю. для получения обновлений в лс.
Key features:
Multiple Oscillators
The user can select one of four oscillators to display:
RSI (Relative Strength Index) — identifies overbought/oversold conditions;
Stoch (Stochastic Oscillator) — detects potential reversals via %K and %D line interactions;
MACD (Moving Average Convergence/Divergence) — shows trend direction and momentum shifts;
AO+MACD — combines Awesome Oscillator (AO) for momentum with MACD for trend confirmation.
Divergence Detection
Identifies four types of price‑oscillator divergences:
Bullish regular (price lows vs. higher oscillator lows);
Bullish hidden (higher price lows vs. lower oscillator lows);
Bearish regular (price highs vs. lower oscillator highs);
Bearish hidden (lower price highs vs. higher oscillator highs).
Divergences are marked on the chart with labels and lines.
Customizable Parameters
Users can adjust:
Oscillator periods (e.g., RSI length, Stoch K/D smoothing, MACD fast/slow/signal lengths);
Source prices (close, high, low, etc.);
Visual settings (colors, line widths, label styles);
Divergence sensitivity (minimum bars between swing points).
Trend and Volatility Analysis
EMA crossover (fast/slow) to determine trend direction;
ATR‑based volatility score (1–5 scale);
RSI‑derived trend strength (1–50 scale);
ADX filter to confirm trend strength (>20).
Additional Signals
Awesome Oscillator “Tea Saucer” patterns for potential long/short entries;
Fibonacci‑Bollinger bands to spot price deviations and reversal zones;
Volume filter to confirm reversals;
Session timing table (optional) showing active/upcoming market sessions (Asia, London, NYSE, etc.).
Visual Outputs
Plots for selected oscillator (RSI, Stoch, MACD, or AO);
Shaded zones (e.g., RSI overbought/oversold areas);
Divergence lines and labels (color‑coded by type);
Reversal “circles” (blue for bullish, red for bearish);
Summary label with trend direction, volatility, and strength;
Optional session timing table.
Purpose:
To provide a comprehensive view of market momentum, trend, and potential reversal setups by combining oscillator crossovers, divergences, volatility, volume, and session context — helping traders time entries and exits across multiple timeframes.

Chronos Reversal Labs - SPChronos Reversal Labs - Shadow Portfolio
Chronos Reversal Labs - Shadow Portfolio: combines reinforcement learning optimization with adaptive confluence detection through a shadow portfolio system. Unlike traditional indicator mashups that force traders to manually interpret conflicting signals, this system deploys 4 multi-armed bandit algorithms to automatically discover which of 5 specialized confluence strategies performs best in current market conditions, then validates those discoveries through parallel shadow portfolios that track virtual P&L for each strategy independently.
Core Innovation: Rather than relying on static indicator combinations, this system implements Thompson Sampling (Bayesian multi-armed bandits), contextual bandits (regime-specific learning), advanced chop zone detection (geometric pattern analysis), and historical pre-training to build a self-improving confluence detection engine. The shadow portfolio system runs 5 parallel virtual trading accounts—one per strategy—allowing the system to learn which confluence approach works best through actual position tracking with realistic exits.
Target Users: Intermediate to advanced traders seeking systematic reversal signals with mathematical rigor. Suitable for swing trading and day trading across stocks, forex, crypto, and futures on liquid instruments. Requires understanding of basic technical analysis and willingness to allow 50-100 bars for initial learning.
Why These Components Are Combined
The Fundamental Problem
No single confluence method works consistently across all market regimes. Kernel-based methods (entropy, DFA) excel during predictable phases but fail in chaos. Structure-based methods (harmonics, BOS) work during clear swings but fail in ranging conditions. Technical methods (RSI, MACD, divergence) provide reliable signals in trends but generate false signals during consolidation.
Traditional solutions force traders to either manually switch between methods (slow, error-prone) or interpret all signals simultaneously (cognitive overload). Both fail because they assume the trader knows which regime the market is in and which method works best.
The Solution: Meta-Learning Through Reinforcement Learning
This system solves the problem through automated strategy selection : Deploy 5 specialized confluence strategies designed for different market conditions, track their real-world performance through shadow portfolios, then use multi-armed bandit algorithms to automatically select the optimal strategy for the next trade.
Why Shadow Portfolios? Traditional bandit implementations use abstract "rewards." Shadow portfolios provide realistic performance measurement : Each strategy gets a virtual trading account with actual position tracking, stop-loss management, take-profit targets, and maximum holding periods. This creates risk-adjusted learning where strategies are evaluated on P&L, win rate, and drawdown—not arbitrary scores.
The Five Confluence Strategies
The system deploys 5 orthogonal strategies with different weighting schemes optimized for specific market conditions:
Strategy 1: Kernel-Dominant (Entropy/DFA focused, optimal in predictable markets)
Shannon Entropy weight × 2.5, DFA weight × 2.5
Detects low-entropy predictable patterns and DFA persistence/mean-reversion signals
Failure mode: High-entropy chaos (hedged by Technical-Dominant)
Strategy 2: Structure-Dominant (Harmonic/BOS focused, optimal in clear swing structures)
Harmonics weight × 2.5, Liquidity (S/R) weight × 2.0
Uses swing detection, break-of-structure, and support/resistance clustering
Failure mode: Range-bound markets (hedged by Balanced)
Strategy 3: Technical-Dominant (RSI/MACD/Divergence focused, optimal in established trends)
RSI weight × 2.0, MACD weight × 2.0, Trend weight × 2.0
Zero-lag RSI suite with 4 calculation methods, MACD analysis, divergence detection
Failure mode: Choppy/ranging markets (hedged by chop filter)
Strategy 4: Balanced (Equal weighting, optimal in unknown/transitional regimes)
All components weighted 1.2×
Baseline performance during regime uncertainty
Strategy 5: Regime-Adaptive (Dynamic weighting by detected market state)
Chop zones: Kernel × 2.0, Technical × 0.3
Bull/Bear trends: Trend × 1.5, DFA × 2.0
Ranging: Mean reversion × 1.5
Adapts explicitly to detected regime
Multi-Armed Bandit System: 4 Core Algorithms
What Is a Multi-Armed Bandit Problem?
Formal Definition: K arms (strategies), each with unknown reward distribution. Goal: Maximize cumulative reward while learning which arms are best. Challenge: Balance exploration (trying uncertain strategies) vs. exploitation (using known-best strategy).
Trading Application: Each confluence strategy is an "arm." After each trade, receive reward (P&L percentage). Bandits decide which strategy to trust for next signal.
The 4 Implemented Algorithms
1. Thompson Sampling (DEFAULT)
Category: Bayesian approach with probability distributions
How It Works: Model each strategy as Beta(α, β) where α = wins, β = losses. Sample from distributions, select highest sample.
Properties: Optimal regret O(K log T), automatic exploration-exploitation balance
When To Use: Best all-around choice, adaptive markets, long-term optimization
2. UCB1 (Upper Confidence Bound)
Category: Frequentist approach with confidence intervals
Formula: UCB_i = reward_mean_i + sqrt(2 × ln(total_pulls) / pulls_i)
Properties: Deterministic, interpretable, same optimal regret as Thompson
When To Use: Prefer deterministic behavior, stable markets
3. Epsilon-Greedy
Category: Simple baseline with random exploration
How It Works: With probability ε (0.15): random strategy. Else: best average reward.
Properties: Simple, fast initial learning
When To Use: Baseline comparison, short-term testing
4. Contextual Bandit
Category: Context-aware Thompson Sampling
Enhancement: Maintains separate alpha/beta for Bull/Bear/Ranging regimes
Learning: "Strategy 2: 60% win rate in Bull, 40% in Bear"
When To Use: After 100+ bars, clear regime shifts
Shadow Portfolio System
Why Shadow Portfolios?
Traditional bandits use abstract scores. Shadow portfolios provide realistic performance measurement through actual position simulation.
How It Works
Position Opening:
When strategy generates validated signal:
Opens virtual position for selected strategy
Records: entry price, direction, entry bar, RSI method
Optional: Open positions for ALL strategies simultaneously (faster learning)
Position Management (Every Bar):
Current P&L: pnl_pct = (close - entry) / entry × direction × 100
Exit if: pnl_pct <= -2.0% (stop-loss) OR pnl_pct >= +4.0% (take-profit) OR held ≥ 100 bars (time)
Position Closing:
Calculate final P&L percentage
Update strategy equity, track win rate, gross profit/loss, max drawdown
Calculate risk-adjusted reward:
text
base_reward = pnl_pct / 10.0
win_rate_bonus = (win_rate - 0.5) × 0.3
drawdown_penalty = -max_drawdown × 0.05
total_reward = sigmoid(base + bonus + penalty)
Update bandit algorithms with reward
Update RSI method bandit
Statistics Tracked Per Strategy:
Equity curve (starts at $10,000)
Win rate percentage
Max drawdown
Gross profit/loss
Current open position
This creates closed-loop learning : Strategies compete → Best performers selected → Bandits learn quality → System adapts automatically.
Historical Pre-Training System
The Problem with Live-Only Learning
Standard bandits start with zero knowledge and need 50-100 signals to stabilize. For weekly timeframe traders, this could take years.
The Solution: Historical Training
During Chart Load: System processes last 300-1000 bars (configurable) in "training mode":
Detect signals using Balanced strategy (consistent baseline)
For each signal, open virtual training positions for all 5 strategies
Track positions through historical bars using same exit logic (SL/TP/time)
Update bandit algorithms with historical outcomes
CRITICAL TRANSPARENCY: Signal detection does NOT look ahead—signals use only data available at entry bar. Exit tracking DOES look ahead (uses future bars for SL/TP), which is acceptable because:
✅ Entry decisions remain valid (no forward bias)
✅ Learning phase only (not affecting shown signals)
✅ Real-time mirrors training (identical exit logic)
Training Completion: Once chart reaches current bar, system transitions to live mode. Dashboard displays training vs. live statistics for comparison.
Benefit: System begins live trading with 100-500 historical trades worth of learning, enabling immediate intelligent strategy selection.
Advanced Chop Zone Detection Engine
The Innovation: Multi-Layer Geometric Chop Analysis
Traditional chop filters use simple volatility metrics (ATR thresholds) that can't distinguish between trending volatility (good for signals) and choppy volatility (bad for signals). This system implements three-layer geometric pattern analysis to precisely identify consolidation zones where reversal signals fail.
Layer 1: Micro-Structure Chop Detection
Method: Analyzes micro pivot points (5-bar left, 2-bar right) to detect geometric compression patterns.
Slope Analysis:
Calculates slope of pivot high trendline and pivot low trendline
Compression ratio: compression = slope_high - slope_low
Pattern Classification:
Converging slopes (compression < -0.05) → "Rising Wedge" or "Falling Wedge"
Flat slopes (|slope| < 0.05) → "Rectangle"
Parallel slopes (|compression| < 0.1) → "Channel"
Expanding slopes → "Expanding Range"
Chop Scoring:
Rectangle pattern: +15 points (highest chop)
Low average slope (<0.05): +15 points
Wedge patterns: +12 points
Flat structures: +10 points
Why This Works: Geometric patterns reveal market indecision. Rectangles and wedges create false breakouts that trap technical traders. By quantifying geometric compression, system detects these zones before signals fire.
Layer 2: Macro-Structure Chop Detection
Method: Tracks major swing highs/lows using ATR-based deviation threshold (default 2.0× ATR), projects channel boundaries forward.
Channel Position Calculation:
proj_high = last_swing_high + (swing_high_slope × bars_since)
proj_low = last_swing_low + (swing_low_slope × bars_since)
channel_width = proj_high - proj_low
position = (close - proj_low) / channel_width
Dead Zone Detection:
Middle 50% of channel (position 0.25-0.75) = low-conviction zone
Score increases as price approaches center (0.5)
Chop Scoring:
Price in dead zone: +15 points (scaled by centrality)
Narrow channel width (<3× ATR): +15 points
Channel width 3-5× ATR: +10 points
Why This Works: Price in middle of range has equal probability of moving either direction. Institutional traders avoid mid-range entries. By detecting "dead zones," system avoids low-probability setups.
Layer 3: Volume Chop Scoring
Method: Low volume indicates weak conviction—precursor to ranging behavior.
Scoring:
Volume < 0.5× average: +20 points
Volume 0.5-0.8× average: +15 points
Volume 0.8-1.0× average: +10 points
Overall Chop Intensity & Signal Filtering
Total Chop Calculation:
chop_intensity = micro_score + macro_score + (volume_score × volume_weight)
is_chop = chop_intensity >= 40
Signal Filtering (Three-Tier Approach):
1. Signal Blocking (Intensity > 70):
Extreme chop detected (e.g., tight rectangle + dead zone + low volume)
ALL signals blocked regardless of confluence
Chart displays red/orange background shading
2. Threshold Adjustment (Intensity 40-70):
Moderate chop detected
Confluence threshold increased: threshold += (chop_intensity / 50)
Only highest-quality signals pass
3. Strategy Weight Adjustment:
During Chop: Kernel-Dominant weight × 2.0 (entropy detects breakout precursors), Technical-Dominant weight × 0.3 (reduces false signals)
After Chop Exit: Weights revert to normal
Why This Three-Tier Approach Is Original: Most chop filters simply block all signals (loses breakout entries). This system adapts strategy selection during chop—allowing Kernel-Dominant (which excels at detecting low-entropy breakout precursors) to operate while suppressing Technical-Dominant (which generates false signals in consolidation). Result: System remains functional across full market regime spectrum.
Zero-Lag Filter Suite with Dynamic Volatility Scaling
Zero-Lag ADX (Trend Regime Detection)
Implementation: Applies ZLEMA to ADX components:
lag = (length - 1) / 2
zl_source = source + (source - source ) × strength
Dynamic Volatility Scaling (DVS):
Calculates volatility ratio: current_ATR / ATR_100period_avg
Adjusts ADX length dynamically: High vol → shorter length (faster), Low vol → longer length (smoother)
Regime Classification:
ADX > 25 with +DI > -DI = Bull Trend
ADX > 25 with -DI > +DI = Bear Trend
ADX < 25 = Ranging
Zero-Lag RSI Suite (4 Methods with Bandit Selection)
Method 1: Standard RSI - Traditional Wilder's RSI
Method 2: Ehlers Zero-Lag RSI
ema1 = ema(close, length)
ema2 = ema(ema1, length)
zl_close = close + (ema1 - ema2)
Method 3: ZLEMA RSI
lag = (length - 1) / 2
zl_close = close + (close - close )
Method 4: Kalman-Filtered RSI - Adaptive smoothing with process/measurement noise
RSI Method Bandit: Separate 4-arm bandit learns which calculation method produces best results. Updates independently after each trade.
Kalman Adaptive Filters
Fast Kalman: Low process noise → Responsive to genuine moves
Slow Kalman: Higher measurement noise → Filters noise
Application: Crossover logic for trend detection, acceleration analysis for momentum inflection
What Makes This Original
Innovation 1: Shadow Portfolio Validation
First TradingView script to implement parallel virtual portfolios for multi-armed bandit reward calculation. Instead of abstract scoring metrics, each strategy's performance is measured through realistic position tracking with stop-loss, take-profit, time-based exits, and risk-adjusted reward functions (P&L + win rate + drawdown). This provides orders-of-magnitude better reward signal quality for bandit learning than traditional score-based approaches.
Innovation 2: Three-Layer Geometric Chop Detection
Novel multi-scale geometric pattern analysis combining: (1) Micro-structure slope analysis with pattern classification (wedges, rectangles, channels), (2) Macro-structure channel projection with dead zone detection, (3) Volume confirmation. Unlike simple volatility filters, this system adapts strategy weights during chop —boosting Kernel-Dominant (breakout detection) while suppressing Technical-Dominant (false signal reduction)—allowing operation across full market regime spectrum without blind signal blocking.
Innovation 3: Historical Pre-Training System
Implements two-phase learning : Training phase (processes 300-1000 historical bars on chart load with proper state isolation) followed by live phase (real-time learning). Training positions tracked separately from live positions. System begins live trading with 100-500 trades worth of learned experience. Dashboard displays training vs. live performance for transparency.
Innovation 4: Contextual Multi-Armed Bandits with Regime-Specific Learning
Beyond standard bandits (global strategy quality), implements regime-specific alpha/beta parameters for Bull/Bear/Ranging contexts. System learns: "Strategy 2: 60% win rate in ranging markets, 45% in bull trends." Uses current regime's learned parameters for strategy selection, enabling regime-aware optimization.
Innovation 5: RSI Method Meta-Learning
Deploys 4 different RSI calculation methods (Standard, Ehlers ZL, ZLEMA, Kalman) with separate 4-arm bandit that learns which calculation works best. Updates RSI method bandit independently based on trade outcomes, allowing automatic adaptation to instrument characteristics.
Innovation 6: Dynamic Volatility Scaling (DVS)
Adjusts ALL lookback periods based on current ATR ratio vs. 100-period average. High volatility → shorter lengths (faster response). Low volatility → longer lengths (smoother signals). Applied system-wide to entropy, DFA, RSI, ADX, and Kalman filters for adaptive responsiveness.
How to Use: Practical Guide
Initial Setup (5 Minutes)
Theory Mode: Start with "BALANCED" (APEX for aggressive, CONSERVATIVE for defensive)
Enable RL: Toggle "Enable RL Auto-Optimization" to TRUE, select "Thompson Sampling"
Enable Confluence Modules: Divergence, Volume Analysis, Liquidity Mapping, RSI OB/OS, Trend Analysis, MACD (all recommended)
Enable Chop Filter: Toggle "Enable Chop Filter" to TRUE, sensitivity 1.0 (default)
Historical Training: Enable "Enable Historical Pre-Training", set 300-500 bars
Dashboard: Enable "Show Dashboard", position Top Right, size Large
Learning Phase (First 50-100 Bars)
Monitor Thompson Sampling Section:
Alpha/beta values should diverge from initial 1.0 after 20-30 trades
Expected win% should stabilize around 55-60% (excellent), >50% (acceptable)
"Pulls" column should show balanced exploration (not 100% one strategy)
Monitor Shadow Portfolios:
Equity curves should diverge (different strategies performing differently)
Win rate > 55% is strong
Max drawdown < 15% is healthy
Monitor Training vs Live (if enabled):
Delta difference < 10% indicates good generalization
Large negative delta suggests overfitting
Large positive delta suggests system adapting well
Optimization:
Too few signals: Lower "Base Confluence Threshold" to 2.5-3.0
Too many signals: Raise threshold to 4.0-4.5
One strategy dominates (>80%): Increase "Exploration Rate" to 0.20-0.25
Excessive chop blocking: Lower "Chop Sensitivity" to 0.7-0.8
Signal Interpretation
Dashboard Indicators:
"WAITING FOR SIGNAL": No confluence
"LONG ACTIVE ": Validated long entry
"SHORT ACTIVE ": Validated short entry
Chart Visuals:
Triangle markers: Entry signal (green = long, red = short)
Orange/red background: Chop zone
Lines: Support/resistance if enabled
Position Management
Entry: Enter on triangle marker, confirm direction matches dashboard, check confidence >60%
Stop-Loss: Entry ± 1.5× ATR or at structural swing point
Take-Profit:
TP1: Entry + 1.5R (take 50%, move SL to breakeven)
TP2: Entry + 3.0R (runner) or trail
Position Sizing:
Risk per trade = 1-2% of capital
Position size = (Account × Risk%) / (Entry - SL)
Recommended Settings by Instrument
Stocks (Large Cap): Balanced mode, Threshold 3.5, Thompson Sampling, Chop 1.0, 15min-1H, Training 300-500 bars
Forex Majors: Conservative-Balanced mode, Threshold 3.5-4.0, Thompson Sampling, Chop 0.8-1.0, 5min-30min, Training 400-600 bars
Cryptocurrency: Balanced-APEX mode, Threshold 3.0-3.5, Thompson Sampling, Chop 1.2-1.5, 15min-4H, Training 300-500 bars
Futures: Balanced mode, Threshold 3.5, UCB1 or Thompson, Chop 1.0, 5min-30min, Training 400-600 bars
Technical Approximations & Limitations
1. Thompson Sampling: Pseudo-Random Beta Distribution
Standard: Cryptographic RNG with true beta sampling
This Implementation: Box-Muller transform using market data as entropy source
Impact: Not cryptographically random but maintains exploration-exploitation balance. Sufficient for strategy selection.
2. Shadow Portfolio: Simplified Execution Model
Standard: Order book simulation with slippage, partial fills
This Implementation: Perfect fills at close price, no fees modeled
Impact: Real-world performance ~0.1-0.3% worse per trade due to execution costs.
3. Historical Training: Forward-Looking for Exits Only
Entry signals: Use only past data (causal, no bias)
Exit tracking: Uses future bars to determine SL/TP (forward-looking)
Impact: Acceptable because: (1) Entry logic remains valid, (2) Live trading mirrors training, (3) Improves learning quality. Training win rates reflect 8-bar evaluation window—live performance may differ if positions held longer.
4. Shannon Entropy & DFA: Simplified Calculations
Impact: 10-15% precision loss vs. academic implementations. Still captures predictability and persistence signals effectively.
General Limitations
No Predictive Guarantee: Past performance ≠ future results
Learning Period Required: Minimum 50-100 bars for stable statistics
Overfitting Risk: May not generalize to unprecedented conditions
Single-Instrument: No multi-asset correlation or sector context
Execution Assumptions: Degrades in illiquid markets (<100k volume), major news events, flash crashes
Risk Warnings & Disclaimers
No Guarantee of Profit: All trading involves substantial risk of loss. This indicator is a tool, not a guaranteed profit system.
System Failures: Software bugs possible despite testing. Use appropriate position sizing.
Market Regime Changes: Performance may degrade during extreme volatility (VIX >40), low liquidity periods, or fundamental regime shifts.
Broker-Specific Issues: Real-world execution includes slippage (0.1-0.5%), commissions, overnight financing costs, partial fills.
Forward-Looking Bias in Training: Historical training uses 8-bar forward window for exit evaluation. Dashboard "Training Win%" reflects this method. Real-time performance may differ.
Appropriate Use
This Indicator IS:
✅ Entry trigger system with confluence validation
✅ Risk management framework (automated SL/TP)
✅ Adaptive strategy selection engine
✅ Learning system that improves over time
This Indicator IS NOT:
❌ Complete trading strategy (requires position sizing, portfolio management)
❌ Replacement for due diligence
❌ Guaranteed profit generator
❌ Suitable for complete beginners
Recommended Complementary Analysis: Market context, volume profile, fundamental catalysts, higher timeframe alignment, support/resistance from other sources.
Conclusion
Chronos Reversal Labs V2.0 - Elite Edition synthesizes research from multi-armed bandit theory (Thompson Sampling, UCB, contextual bandits), market microstructure (geometric chop detection, zero-lag filters), and machine learning (shadow portfolio validation, historical pre-training, RSI method meta-learning).
Unlike typical indicator mashups, this system implements mathematically rigorous bandit algorithms with realistic performance validation, three-layer chop detection with adaptive strategy weighting, regime-specific learning, and full transparency on approximations and limitations.
The system is designed for intermediate to advanced traders who understand that no indicator is perfect, but through proper machine learning and realistic validation, we can build systems that improve over time and adapt to changing markets without manual intervention.
Use responsibly. Understand the limitations. Risk disclosure applies. Past performance does not guarantee future results.
Taking you to school. — Dskyz, Trade with insight. Trade with anticipation.

Trade4Freedom## 🔷 Trade4Freedom – Market Logic Framework
**Not a group of indicators. One continuous system of reading market behaviour.**
The script is designed to follow the same decision flow I use in trading.
Every tool here supports the others — there are no standalone modules.
The market is analysed layer by layer, but always as one sequence:
---
### 🔄 **How the logic works (continuous process)**
1. **Structure first** – BOS/ChoCH levels show where the market changed behaviour.
The projected dotted line is not a signal — it is a place where I wait and observe.
I do not enter until price interacts with structure.
2. **Liquidity next** – if the structure level aligns with a liquidity bag (retest),
the zone becomes important. Active liquidity lines are potential targets or
reasons to avoid trading against the area.
3. **Context filter** – I use CCI only when structure + liquidity are already active.
Example of long bias:
−200 level is broken → candle closes above the MA → CCI rises from the channel.
From this point I begin to trail stops and start building position if structure supports it.
4. **Confirmation & positioning**
Stochastic heatmap is not for entries – it confirms pressure.
Divergences on CCI or price are additional evidence when forming or adjusting a position.
5. **Execution zones** – only after structure → liquidity → context,
I use deviation levels (1–5) to define where to place orders.
On higher timeframes they work for accumulation models,
on intraday levels they work for tactical entry zones.
Dev1/Dev2 boxes exist only to make limit-order planning faster.
---
### 📌 **Purpose of the script**
This tool does not predict price or generate signals.
It creates the same structured environment on any chart:
**Structure → Liquidity → Context → Deviation → Decision**
This helps avoid random trading and replaces guessing with logic and observation.
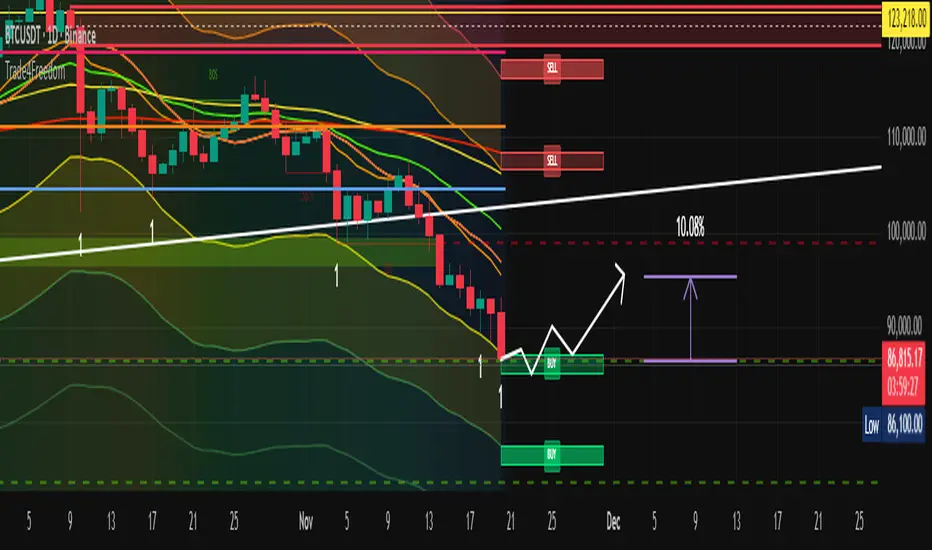
EQT Stochastic RibbonEQT Stochastic Ribbon is a modified Stochastic Oscillator with ribbon fill visualization.
Features:
- Dynamic color ribbon that changes based on trend direction (Blue for bullish, White for bearish)
- Crossover signals with triangle markers when %K crosses %D
- Customizable colors and signal offset
- Dashed lines at 80/20 levels for overbought/oversold zones
How to use:
- Blue ribbon = Bullish momentum (%K above %D)
- White ribbon = Bearish momentum (%K below %D)
- Triangle up = Buy signal (K crosses above D)
- Triangle down = Sell signal (K crosses below D)
Settings:
- K, D, Smooth - Standard Stochastic parameters
- Signal Offset - Distance of signal arrows from the line
- Bullish/Bearish Colors - Customize ribbon and signal colors
