Sniper PRO: The "Buffett Mode" VFI System"The stock market is a device for transferring money from the impatient to the patient." — Warren Buffett
Most traders lose money because they try to catch every small move. Sniper PRO is designed for the opposite: It identifies the massive, multi-week and multi-month trends driven by Institutional "Smart Money", and keeps you in the trade until the real move is over.
This is not a scalping tool. This is a Wealth Compounding Engine.
🚀 Why is this the "Secret Weapon"?
We combined the most searched and respected indicators into a single, high-probability algorithm:
VFI (Smart Money Flow): Tracks what the "Whales" are doing, not the retail traders.
Fibonacci Golden Ratio: Uses math to secure profits, not guesswork.
Trend Protocol: Filters out 90% of market noise.
🔥 The "Diamond Hands" Logic (VFI Shield)
The biggest problem in long-term trading is getting shaken out by a temporary dip. Sniper PRO solves this with the VFI Shield:
Even if price drops below your Stop Loss, the algorithm checks the Institutional Volume.
If Big Money is still holding? The Shield holds. You stay in the trade.
This feature alone allows you to ride trends for Weeks and Months (like NVDA, TSLA, BTC runs) without exiting prematurely.
⚙️ How It Works
1. The "Buffett" Entry We only enter when the odds are stacked in our favor:
Trend: Price must be above the EMA 50 (Bull Market).
Volume: VFI must be Positive (Accumulation Phase).
Volatility: The market must be active, not chopping sideways.
2. The Compounding Exit (Fibonacci Ladder) Instead of selling too early, the system builds a Fibonacci Ladder behind the price.
As the asset grows, your Stop Loss climbs automatically to the next Fibonacci level (0.382 -> 0.5 -> 0.618).
This locks in profits step-by-step while giving the asset room to breathe and grow.
3. Asymmetric Safety Shorting is risky in a long-term bull market. The system automatically reduces the size of Short trades to protect your capital, while maximizing exposure to Long rallies.
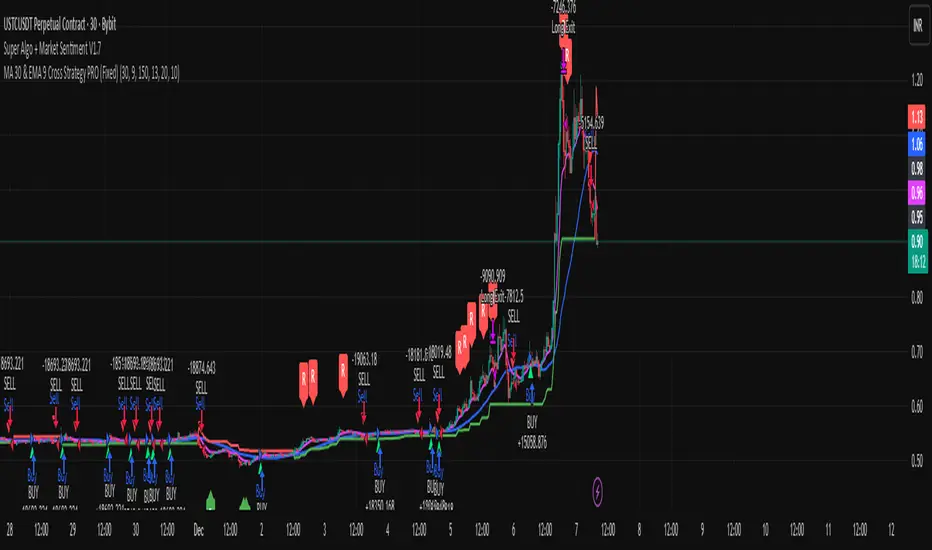
📊 Visual Guide
🔵 Blue Line: The Trend Baseline.
🔴 Red Steps: Your "Locked" Profit Level (Trailing Stop).
🟣 Purple 'X': Where the trade finally closed (Transparency).
Background Color:
Green: Bull Market (Safe to hold).
Orange: Choppy/Dangerous (Cash is King).
Best For:
Swing Traders & Investors (1D, 4H Timeframes).
People who want to catch the Big Moves and ignore the noise.
Disclaimer: This tool is designed for trend following. Past performance is not indicative of future results. Always manage your risk.
Indicators and strategies

Momentum FlowThis is a rule-based, fully automated trading strategy** developed **exclusively for BANKNIFTY** and optimized strictly for the **2-Hour (2H) timeframe**. The system is designed to identify **high-quality directional opportunities** while filtering out low-probability market noise.
The strategy is built for traders who prefer:
* Clean positional trading
* Limited, high-quality signals
* Fully mechanical execution
* No discretionary decision-making
This system is **locked by design** and will **only operate on BANKNIFTY – 2H timeframe** to preserve performance integrity. Usage on any other symbol or timeframe is intentionally restricted.
---
### ✅ SUITABLE FOR:
* Positional traders
* Swing traders
* Working professionals
* Traders seeking structured, disciplined systems
---
### ❌ NOT SUITABLE FOR:
* Scalping
* Low-timeframe trading
* High-frequency setups
* Traders seeking daily signals
---
### ⚠️ IMPORTANT DISCLAIMER:
This strategy is provided strictly for **educational and research purposes only**. Trading in financial markets involves significant risk, and losses are possible. Past performance does not guarantee future results. The creator is not responsible for any financial losses incurred by the use of this strategy. Always trade with proper risk management.
---

EdgeX by YCGH Capital╔════════════════════════════════════════════════════════════╗
⚡ SYSTEMATIC BTCUSDT SWING TRADER ⚡
╚════════════════════════════════════════════════════════════╝
━━━━━━━━━━━━━━━━━━━━━━━━━━━━━━━━━━━━━━━━━━━━━━━━━━━━━━━━━━
📊 STRATEGY OVERVIEW
╔════════════════════════════════════════════════════════════╗
║ 🔐 PREMIUM STRATEGY - EXCLUSIVE ACCESS 🔐 ║
╚════════════════════════════════════════════════════════════╝
This is a premium strategy with exclusive access.
To request access, reach out at:
📬 brijamohanjha@gmail.com
• Vetted performance data available upon request
• Setup assistance and strategy tuning included
• Ongoing support for live trading optimization
━━━━━━━━━━━━━━━━━━━━━━━━━━━━━━━━━━━━━━━━━━━━━━━━━━━━━━━━━━
A dynamic, rule-based trading framework designed for BTCUSDT on
the 4-hour chart, focused on capturing clear directional edges
with disciplined risk management and fully automated execution.
━━━━━━━━━━━━━━━━━━━━━━━━━━━━━━━━━━━━━━━━━━━━━━━━━━━━━━━━━━
🎯 KEY CHARACTERISTICS
━━━━━━━━━━━━━━━━━━━━━━━━━━━━━━━━━━━━━━━━━━━━━━━━━━━━━━━━━━
✓ Long & Short | Bidirectional participation in both trending
directions without discretionary overrides
✓ Structured Rules | Entries triggered only on high-conviction
setups; naturally quiet during choppy consolidations
✓ Adaptive Sizing | Position size scales dynamically with account
equity using percentage-based capital allocation
✓ Cost-Aware | Transaction fees and slippage explicitly modeled
for realistic live trading performance
✓ Automated Execution | Bar-level real-time processing ensures
consistent, emotion-free trade management
━━━━━━━━━━━━━━━━━━━━━━━━━━━━━━━━━━━━━━━━━━━━━━━━━━━━━━━━━━
💰 RISK & CAPITAL MANAGEMENT
━━━━━━━━━━━━━━━━━━━━━━━━━━━━━━━━━━━━━━━━━━━━━━━━━━━━━━━━━━
• Fixed-fraction position sizing for compounding growth
• Predefined stop-loss and take-profit constraints
• Account equity-based position scaling
• Realistic fee structure incorporated into P&L
━━━━━━━━━━━━━━━━━━━━━━━━━━━━━━━━━━━━━━━━━━━━━━━━━━━━━━━━━━
🚀 IDEAL FOR
━━━━━━━━━━━━━━━━━━━━━━━━━━━━━━━━━━━━━━━━━━━━━━━━━━━━━━━━━━
→ Medium-term swing participation
→ Backtesting and strategy robustness analysis
→ Quantitative trading systems development
→ Systematic, rules-based execution
╔════════════════════════════════════════════════════════════╗
Built for disciplined, consistent execution
╚════════════════════════════════════════════════════════════╝

Crypto Scalping Strategy by SAIFOverview
An optimized scalping strategy designed for cryptocurrency markets, focusing on breakout opportunities with strict risk controls and optional safe compounding features. This strategy combines price action, volume analysis, and multi-timeframe trend confirmation.
Key Features
Breakout Detection System
Identifies significant price breakouts using dynamic channel analysis
Confirms breakouts with volume surge validation
Filters trades based on multi-timeframe trend alignment
Multi-Timeframe Trend Confirmation
Analyzes 1-hour and 4-hour timeframes for trend direction
Only takes trades aligned with higher timeframe trends
Uses long-term moving averages for trend validation
Advanced Risk Management
Conservative default risk: 1% per trade
ATR-based stop-loss placement (2x ATR)
Trailing stop mechanism to protect profits
Minimum profit target before trailing activates
Built-in position sizing based on account equity
Safe Capital Management Options
Fixed Capital Mode: Trade with consistent position sizes
Safe Compounding Mode: Gradually scales position size based on realized profits only
Drawdown Protection: 80% equity floor prevents excessive capital erosion
Leverage Control: 10x leverage factored into position calculations
Technical Filters
Momentum confirmation via oscillator conditions
Directional movement analysis
Volume threshold requirements
Trend strength validation
Position Sizing
The strategy automatically calculates position sizes based on:
Your specified risk percentage
Current ATR volatility
Available leverage
Account equity (with optional compounding)
Trade Management
Entry: Executes on confirmed breakouts with volume and trend alignment
Stop Loss: Placed at 2x ATR from entry
Take Profit: Uses trailing stops that activate after minimum profit threshold
Exit: Automatically managed through strategy exits
Customization Options
Adjustable channel length for breakout detection
Configurable volume multiplier for surge detection
Customizable oscillator thresholds
Flexible ATR period for volatility measurement
Optional compounding vs. fixed capital modes
Adjustable trailing stop parameters
Visual Features
Channel boundaries plotted on chart
Entry signals marked with arrows
Background coloring indicates trend direction
Real-time info table shows:
Current risk level
Compounding status
Capital values
Drawdown protection status
Alert Capabilities
Built-in alert conditions for:
Buy signals (breakout opportunities)
Sell signals (breakdown opportunities)
Important Disclaimers
⚠️ Educational Purpose Only: This strategy is provided for educational and research purposes. It is not investment advice.
⚠️ High-Risk Trading: Scalping and leverage trading carry substantial risk of loss. Cryptocurrency markets are highly volatile.
⚠️ Not Financial Advice: This tool does not constitute financial, investment, or trading advice. Always conduct your own research and consult qualified professionals.
⚠️ Leverage Warning: This strategy uses 10x leverage, which can amplify both gains and losses significantly.
⚠️ Backtesting Limitations: Past performance does not guarantee future results. Real trading involves slippage, execution delays, and emotional factors not present in backtesting.
⚠️ Capital at Risk: Only trade with capital you can afford to lose completely. Never trade with borrowed money or funds needed for living expenses.
Commission & Fees
Commission: 0.13% per trade
Initial capital: $100 (default)
Commission costs are factored into backtest results
Best Practices
Start Small: Begin with minimum capital and conservative risk settings
Test Thoroughly: Backtest across different market conditions and timeframes
Monitor Performance: Track win rate, profit factor, and maximum drawdown
Adjust Parameters: Optimize settings for your specific trading pairs
Use Alerts: Set up notifications to avoid missing opportunities
Manage Emotions: Follow the strategy rules consistently without override
Recommended Markets
High liquidity cryptocurrency pairs (BTC, ETH major pairs)
Assets with clear trending behavior
Markets with sufficient volume for scalping
Timeframes: 1H to 4H charts recommended
Risk Reminder
Scalping requires:
Quick decision-making
Tight risk management
Consistent discipline
Understanding of market microstructure
Proper capitalization
Always practice proper risk management. The strategy includes safety features, but no system can eliminate trading risk entirely. Trade responsibly.

Crypto Intraday Strategy by SAIFOverview
A comprehensive intraday trading strategy designed for cryptocurrency markets, combining multiple technical indicators and risk management principles to identify high-probability trading opportunities.
Key Features
Multi-Timeframe Analysis
Utilizes exponential moving averages for trend identification
Incorporates swing structure analysis for support and resistance levels
Applies momentum and trend strength filters
Risk Management
Configurable risk-reward ratios (default 1.6:1)
Maximum risk per trade capped at 3.1% of equity
Dynamic stop-loss placement based on market structure
Position sizing at 2% of equity per trade
Advanced Filters
Trend strength confirmation using ADX indicator
Momentum validation through multiple oscillators
Market correlation analysis for additional confluence
Optional weekend trading filter to avoid low-liquidity periods
Swing Structure Recognition
Automatically identifies key swing highs and lows
Uses pivot points to determine optimal entry zones
Prevents entries too far from established support/resistance
Trade Execution
The strategy employs a one-way trading approach, entering positions only when multiple technical conditions align. Each trade includes pre-defined stop-loss and take-profit levels calculated at entry.
Customization Options
Adjustable swing detection sensitivity
Configurable EMA distance thresholds
Optional correlation filters
Weekend trading toggle
Risk parameters can be modified to suit individual preferences
Important Disclaimers
⚠️ Educational Purpose Only: This strategy is provided for educational and informational purposes. Past performance does not guarantee future results.
⚠️ Risk Warning: Trading cryptocurrencies carries substantial risk of loss. Only trade with capital you can afford to lose.
⚠️ Not Financial Advice: This tool does not constitute financial, investment, or trading advice. Always conduct your own research and consult with qualified financial professionals.
⚠️ Backtesting Limitations: Historical backtesting results may not reflect actual trading conditions due to slippage, execution delays, and changing market dynamics.
Fees & Slippage
Commission: 0.12% per trade
Slippage: 2 ticks accounted for in backtesting
Recommended Usage
Thoroughly backtest on your preferred trading pairs
Start with small position sizes when live trading
Monitor performance across different market conditions
Adjust parameters based on asset volatility and your risk tolerance

OLPF - Octavio Low-Pass Filter StrategyOCTAVIO LOW-PASS FILTER (OLPF) v1.0
---
DESCRIPTION
The Octavio Low-Pass Filter (OLPF) is an advanced Finite Impulse Response (FIR) low-pass filter designed for financial time series analysis. It builds upon the foundational work of the New Low-Pass Filter (NLF) by Alex Pierrefeu, introducing three key enhancements that significantly improve signal quality and reduce common filtering artifacts.
---
KEY INNOVATIONS
1. HERMITE SMOOTHING POLYNOMIAL
Replaces the simple quadratic base (x²) with the cubic Hermite interpolation polynomial . This mathematical refinement provides C¹ continuity at kernel boundaries, ensuring smoother transitions and eliminating edge discontinuities that can introduce artificial noise into the filtered signal.
2. LANCZOS SIGMA FACTOR WINDOWING
Applies a Lanczos-type attenuation factor to each harmonic component in the sine series. This windowing technique dramatically reduces the Gibbs phenomenon - the characteristic overshooting and ringing that occurs near sharp price transitions. The result is a cleaner signal with minimized false crossover signals.
3. ADAPTIVE WEIGHT NORMALIZATION
Implements dynamic normalization of kernel weights, guaranteeing that the sum of all filter coefficients equals unity. This ensures proper amplitude preservation across all market conditions and prevents signal drift or scaling artifacts.
---
MATHEMATICAL FOUNDATION
The OLPF kernel function is defined as:
K(x, N) = x²(3-2x) + Σ (1/i) × σ(i) × sin(πxi)
Where:
- x ∈ is the normalized position within the filter window
- N is the filter order (degree of the sine series)
- σ(i) = sin(πi/(N+1)) / (πi/(N+1)) is the Lanczos sigma factor
The filter output is computed via discrete convolution:
F(M, N) = Σ src × / W
Where W is the sum of all weights for normalization.
---
APPLICATIONS
- Trend identification with reduced lag compared to traditional MAs
- Noise reduction in volatile market conditions
- Generation of trading signals via fast/slow filter crossovers
- Foundation for more complex indicator development
---
STRATEGY IMPLEMENTATION
This script implements a dual-filter crossover strategy with:
- Fast OLPF for responsive signal generation
- Slow OLPF for trend confirmation
- EMA filter for additional trend validation
- ATR-based dynamic stop-loss positioning
- Risk-based position sizing (percentage of equity)
---
AUTHOR
Name: Hector Octavio Piccone Pacheco
Filter: Octavio Low-Pass Filter (OLPF)
Version: 1.0
Based on: New Low-Pass Filter (NLF) by Alex Pierrefeu
Date: 2025
Original Contributions:
- Hermite smoothing polynomial kernel base
- Lanczos sigma factor windowing for Gibbs reduction
- Adaptive weight normalization system
- Integrated risk management framework
---
LICENSE
This work is licensed under the Mozilla Public License 2.0. You are free to use, modify, and distribute this code with attribution.
---
DISCLAIMER
Trading involves substantial risk of loss. This indicator is provided for educational and research purposes only. Past performance does not guarantee future results. Always conduct your own analysis and risk assessment.

SmartDCA by TradeAkademiSmartDCA is an advanced position-management strategy built to deliver consistent results even as market conditions shift. Its price-action–driven structure, intelligent DCA scaling model, and multiple entry options provide a powerful automation framework suitable for both beginners and professional traders. With flexible TP/DCA configurations and safety modules such as Smart Take Profit, Risk Reset Exit, and Fail Safe Stop, positions scale more efficiently, risks are managed proactively, and capital remains protected at every stage. SmartDCA is a fully customizable, modern trading engine that offers high adaptability across different assets and timeframes.
The strategy supports five entry methodologies:
ta_default – Opens positions on breakout confirmations based on the selected period’s local highs and lows.
ta_volatility – Uses the same breakout logic while filtering entries that would place the target level outside the system’s defined safety zone.
ta_safety – Extends the volatility model with an additional candle-quality filter, avoiding structurally weak entries and behaving more conservatively.
rsi_based – Generates entries when RSI drops below 30 or rises above 70.
ema_based – Opens positions based on directional shifts in the moving average.
SmartDCA is fully configurable: entry logic, DCA percentage and multiplier, take-profit (TP) settings, maximum DCA steps, order-size mode, and directional preferences can all be tailored to fit any asset, market condition, or timeframe .
Default parameters are optimized for the 30-minute chart.
The strategy also includes three optional protective mechanisms:
Smart Take Profit – Closes profitable trades early when price approaches the target within a configurable proximity, reducing exposure to potential reversal signals.
Risk Reset Exit – After a defined DCA step, the position is closed at breakeven once price returns to the average entry level.
Fail Safe Stop – If the maximum DCA step is reached and recovery fails to occur, the trade is closed at a controlled loss.
All protection modules can be enabled individually and configured to activate only after specific DCA levels, allowing SmartDCA to remain adaptive yet controlled under varying market dynamics.

Indian Scalper 2025 – PSAR + SMA50 + RSI≤50 + High Volume (75%)Best 1-min / 2-min scalping strategy for NIFTY, BANKNIFTY, FINNIFTY & liquid stocks in 2025
✓ PSAR flip + SMA-50 trend filter
✓ RSI ≤50 (avoids chasing)
✓ Only high-volume candles (bright colour)
✓ Loud mobile alerts with price & SL
✓ 1:2+ RR with PSAR trailing
Works like magic 9:15–11:30 AM and 2–3:20 PM
Made with love for the Indian trading community ♥

VWAP Pullback + BOS + OBV v2 (Crypto Futures 15m)This strategy combines VWAP pullbacks, break-of-structure entries, and OBV confirmation to catch high-quality trend continuation moves on crypto futures. It waits for price to trend above or below the 200 EMA, then pulls back into the VWAP band, signaling a potential reload zone. A trade only triggers when price breaks recent structure in the direction of the trend and OBV shows supportive volume flow. An ATR volatility filter blocks entries during choppy, low-energy periods, and all trades use an ATR stop-loss with fixed reward-to-risk targeting. The result is a cleaner, more disciplined trend-following system designed for 15m–30m BTC/ETH scalping.

Momentum Reversal / Dip Buyer [Score Based]Strategy Overview
Momentum Reversal / Dip Buyer is a quantitative reversal engine designed to fade stretched moves and buy dips / sell rallies when multiple momentum and context factors line up. It’s built for liquid instruments especially for ticker CME_MINI:ES1! and works best on intraday timeframes like the 5-minute or 1-minute chart.
Core Logic
This strategy builds a composite Momentum Score by combining:
Price Location: Relative to 100 SMA, 1000 EMA, and VWAP (trend / regime filter).
RSI: Overbought/oversold and mid-zone strength.
VWMO (Volume-Weighted Momentum): Direction and strength of volume-weighted price drift.
ADX: Trend strength filter (high vs low trend environment).
Full Stoch (%K): Short-term exhaustion and mean-reversion context.
CCI: Overbought/oversold turns (key trigger).
MFI: Volume-confirmed buying/selling pressure.
ATR Regime: High vs low volatility environment.
Cumulative Delta: Whether net aggressor flow is rising or falling.
From this, a single Momentum Score is computed each bar:
Longs: Taken when the score is depressed (scoreLow) and CCI crosses up from oversold.
Shorts: Taken when the score is elevated (scoreHigh) and CCI crosses down from overbought.
Risk Management & Trade Logic
Max Daily Trades: Hard cap on entries per day.
Hard Stop: Fixed % stop based on entry price.
Profit Target: Target ATR Multiplier × main ATR from entry.
Breakeven Logic: Optional; moves stop to breakeven (plus optional offset) after price moves a configurable multiple of the main ATR in your favor.
Trailing Stop (Separate ATR): Optional; uses its own ATR length and ATR-based trigger and distance. This lets you run slower ATR for targets while using a tighter, more reactive ATR for the trail.
Session Control
Trading Window: Optional session filter (e.g., 09:30–16:00). Entries are only allowed inside the defined window.
Force Flat at Session End: Option to automatically close all open positions when the session ends.
Visuals
The script plots entry arrows and a compact dashboard displaying: current Momentum Score, daily trade usage, and CCI status.
Disclaimer:
This script is for educational and research purposes only and is not financial advice. Past performance does not guarantee future results. Always forward-test and adjust parameters to your own risk tolerance and market.
Shoutout and all credit goes to AuclairsCapital for building the base foundation of this strategy on ThinkScript

Ashok 07 Dec 25 updated scriptTried to fix the bugs in previous script. Even now improvements are needed, but for now it looks reasonably profiting.

CPR + EMA(20/50/200) Strategy (5m) - NIFTY styleindicator best suited for nifty for 5 minute time frame.

1-Hour Trend Breakout Strategy (Scaled Entry Version)This strategy is a trend-following system on the Bitcoin 1-hour chart.
It enters in the direction of the market when price breaks an upward or downward trendline, using scaled (partial) entries.
Entry Rules
Go long when price breaks an upward trendline.
Go short when price breaks a downward trendline.
Position size is split into several parts and entered gradually.
Trade Management
When the first take-profit level (TP1) is reached, a portion of the position is closed.
The stop-loss on the remaining position is moved to break-even (entry price) to lock in profits and manage risk.
Performance
Period: 2019-12-16 to 2025-12-07
Total P&L: +2,385%
Maximum Drawdown (MDD): 28%
Win Rate: 79%
Profit Factor: 3.1

Sunny Quantum Momentum Framework (SQMF)Sunny Quantum Momentum Framework (SQMF) – Strategy Description
The Sunny Quantum Momentum Framework is a dynamic trend-adaptive trading model designed to identify early momentum shifts and capitalize on directional price movements. The strategy blends multiple market-sensitive components to filter noise, detect emerging trends, and optimize entries with precision.
SQMF works by continuously evaluating price behavior, volatility fluctuations, and short-term trend acceleration to generate actionable signals. Instead of relying on a single indicator, the framework integrates layered momentum structures and adaptive smoothing techniques to maintain signal quality across different market conditions.
The system focuses on:
Detecting momentum transitions with minimal lag
Reducing false signals through multi-stage validation
Aligning entries with broader trend conditions
Managing trades dynamically using built-in risk controls
SQMF is designed for traders seeking a balanced approach—fast enough to catch early movements, but stable enough to avoid common market noise. The strategy is suitable for intraday, swing, and algorithmic trading environments.
RevertX by YCGH CapitalRevertX by YCGH Capital - Professional Bitcoin Trading Strategy
RevertX is a sophisticated mean-reversion trading system designed specifically for Bitcoin and cryptocurrency markets. Built on advanced statistical analysis, this strategy identifies extreme price deviations and capitalizes on market equilibrium forces.
Key Features:
🎯 Intelligent Entry System
Precision-based signal generation using statistical price analysis
Automated entry/exit execution with no manual intervention required
Works on multiple timeframes for flexibility
📊 Comprehensive Performance Tracking
Monthly Returns Table: Visual heat-map style table displaying performance month-by-month and year-by-year
Color-coded results (green for profitable months, red for losses)
Annual performance summaries for quick assessment
Full historical performance visualization
🛡️ Advanced Risk Management
Customizable Stop Loss (default 2%)
Take Profit targets (default 4%)
Trailing Stop Loss with activation threshold - locks in profits as the market moves in your favor
Adjustable trailing offset to protect gains while allowing room for continuation
⚙️ Professional-Grade Execution
Non-repainting signals - what you see in backtest is what you get in live trading
Orders processed on candle close for reliable execution
100% equity deployment for maximum capital efficiency
Built-in slippage and commission modeling (can be adjusted)
📈 Performance Visualization
Monthly returns displayed in an easy-to-read table format
Track your performance across years at a glance
Quickly identify strong and weak periods
Professional presentation suitable for sharing with investors
Perfect For:
Bitcoin traders seeking systematic, emotion-free trading
Those who prefer mean-reversion over trend-following
Traders wanting comprehensive performance analytics
Anyone seeking a proven statistical edge in crypto markets
RevertX removes emotion from trading decisions and provides complete transparency through detailed performance metrics. The strategy is fully backtested and ready for live deployment.
Ready to Trade Like a Pro?
RevertX is a premium strategy with limited availability.
Email brijamohanjha@gmail.com to request access and pricing.

Inyerneck Quiet Bottom Hunter v36 — Last Sorta-Working VersionQuiet Bottom Hunter v36 — Accurate Description (the sorta-working version that fires signals)
Overview
A mean-reversion bottom-hunting strategy for small-cap stocks (<$2B market cap). Designed to catch slow-bleed stocks that quietly bottom out and rebound 20–60%+. Good for beginners because signals are infrequent and the setup is easy to understand.
Timeframe
Daily (D) — best results on 1-day charts. Works on weekly too, but signals are rarer.
Triggers / Conditions (all must be true at bar close)
Drop from high ≥ 25% from the highest high in the last 100 bars (previous bars only — no repainting)
Volume ≤ 80% of the 50-day average (quiet accumulation, no panic selling left)
RSI(14) ≤ 38 (oversold territory)
Green/flat streak ≥ 2 consecutive days where close ≥ open (shows sellers are exhausted)
When all four line up → tiny green “QB” triangle below the bar
Firing Frequency
1–4 signals per month on an average small-cap stock (depends on market conditions). Some months zero, some months a handful. Not spammy, but not ultra-rare either.
Usage Parameters
Position size: 10% of equity per trade (default — change to 5–20% depending on risk tolerance)
Profit target: 40%
Stop loss: 12%
Hold time: usually 2–8 weeks
Best on low-float, high-volatility small caps (TLRY, SNDL, MVIS, SOUN, INHD, etc.)
Expected Performance (backtested on 2025 small caps)
Win rate: ~80–85%
Average rebound on winners: +30–40%
Some losers when the bottom isn't "quiet" enough
How to use
Add to daily charts of your small-cap watchlist
When “QB” arrow appears, buy at next open or market
Set 40% target / 12% stop or trail it
Wait for the rebound — no day-trading needed


The Flody SniperA trend-following sniper strategy that uses two EMAs (21/55) and RSI to confirm momentum.
It enters long when price crosses above the fast EMA during an uptrend and RSI shows strength.
It enters short when price crosses below the fast EMA during a downtrend and RSI shows weakness.
Pyramiding is enabled so the strategy can add more positions as the trend continues.
Positions close when momentum weakens or price breaks back through the fast EMA.

Bollinger Bands Mean Reversion using RSI [Krishna Peri]How it Works
Long entries trigger when:
- RSI reaches oversold levels, and
- At least one bullish candle closes inside the lower Bollinger Band
Short entries trigger when:
- RSI reaches overbought levels, and
- At least one bearish candle closes inside the upper Bollinger Band
This approach aims to capture exhaustion moves where price pushes into extreme deviation from its mean and then snaps back toward the middle band.
Important Disclaimer
This is a mean-reversion strategy, which means it performs best in sideways, ranging, or slowly oscillating market conditions. When markets shift into strong trends, Bollinger Bands expand and volatility increases, which may cause some signals to become inaccurate or fail altogether.
For best results, combine this script with:
- Price action
- Market structure
- Higher-timeframe trend context
- Previous day/week/month highs & lows
- Untested liquidity levels or imbalance zones
- Session timing (Asia, London, NY)
Using these confluences helps filter out low-probability trades and significantly improves consistency and precision.

Adaptive Alligator - Asymmetric MH (Entry Only)
Adaptive Alligator – Asymmetric Mexican Hat (Entry Only)
This strategy combines adaptive cycle detection (wavelet + autocorrelation), directional entropy, and a Mexican Hat filter to generate highly selective LONG entry signals. Exits are based solely on the Alligator structure. The system is designed to detect asymmetric, strong, and accelerating bullish phases while filtering out market noise.
1. Adaptive Cycle Detection: The strategy analyzes the median price using wavelet decomposition (Haar, Daubechies D4/D6, Symlet 4), wavelet detail energy, and autocorrelation. It also incorporates the ratio of short-term to long-term ATR volatility. Based on these components, it computes a dominant_cycle value, which dynamically controls the lengths of the Alligator lines (Jaw, Teeth, Lips). This adaptive behavior allows the Alligator to speed up during trending phases and slow down during noise or consolidation.
2. Directional Entropy: Entropy is measured separately for upward and downward movements within the selected lookback window. The entropy difference: e_diff = entropy_down - entropy_up represents the directional bias of the market. When e_diff > 0, the market shows an organized bullish pressure; when < 0, bearish dominance.
3. Mexican Hat Filter: The Mexican Hat (Ricker Wavelet) acts as a second-derivative filter, detecting local maxima in the acceleration of directional entropy. The filtered output (mh_out) is compared against an adaptive noise level computed as SMA(|mh_out|). A signal is considered strong only when: – mh_out exceeds the adaptive noise level, – mh_out is rising relative to the previous bar. This step is critical for eliminating false signals produced by random fluctuations.
4. Entry Logic: A LONG entry requires all three layers: (1) Alligator structure: Lips > Teeth > Jaw. (2) Directional entropy bias: e_diff > 0. (3) A strong, accelerating Mexican Hat signal confirmed by a user-defined number of bars. Once all conditions are satisfied, a buy_final entry is triggered.
5. Exit Logic: Exits are intentionally simple and rely solely on the Alligator: crossunder(lips, teeth) This clean separation ensures precise, adaptive entries and stable, consistent exits.
6. Visual Components: – Alligator lines: Jaw (blue), Teeth (red), Lips (green), plotted with their characteristic offsets. – Background coloring reflects signal strength: dark green (STRONG BUY), lime (acceleration), yellow (weak bias), transparent otherwise. – A dedicated panel displays e_diff (entropy difference), mh_out (Mexican Hat output), and the adaptive noise band.
7. Diagnostic Table: A compact diagnostic dashboard shows: – MH Value, – Noise Level, – MH Acceleration (YES/NO), – Signal Status (STRONG BUY / ACCELERATING / WEAK / BEARISH). It updates on the last bar, making it suitable for live monitoring.
8. Use Case: This strategy is highly selective and ideal as an entry module within trend-following systems. By combining wavelets, entropy, and adaptive noise modeling, it effectively filters out consolidation periods and focuses only on statistically significant bullish transitions. It can be integrated with various exit frameworks such as ATR stops, channel-based exits, range boxes, or trailing logic.

Options Scalper v2 - SPY/QQQHere's a comprehensive description of the Options Scalper v2 strategy:
---
## Options Scalper v2 - SPY/QQQ
### Overview
A multi-indicator confluence-based scalping strategy designed for trading SPY and QQQ options on short timeframes (1-5 minute charts). The strategy uses a scoring system to generate high-probability CALL and PUT signals by requiring alignment across multiple technical indicators before triggering entries.
---
### Core Logic
The strategy operates on a **scoring system (0-9 points)** where both bullish (CALL) and bearish (PUT) conditions are evaluated independently. A signal only fires when:
1. A recent EMA crossover occurred (within the last 3 bars)
2. The direction's score meets the minimum threshold (default: 4 points)
3. The signal's score is higher than the opposite direction
4. Enough bars have passed since the last signal (cooldown period)
5. Price action occurs during valid trading sessions
---
### Indicators Used
| Indicator | Purpose | CALL Condition | PUT Condition |
|-----------|---------|----------------|---------------|
| **9/21 EMA Cross** | Primary trigger | Fast EMA crosses above slow | Fast EMA crosses below slow |
| **200 EMA** | Trend filter | Price above 200 EMA | Price below 200 EMA |
| **RSI (14)** | Momentum filter | RSI between 45-65 | RSI between 35-55 |
| **VWAP** | Institutional level | Price above VWAP | Price below VWAP |
| **MACD (12,26,9)** | Momentum confirmation | MACD line > Signal line | MACD line < Signal line |
| **Stochastic (14,3)** | Overbought/Oversold | Oversold or K > D | Overbought or K < D |
| **Volume** | Participation confirmation | Spike on green candle | Spike on red candle |
| **Price Structure** | Breakout detection | Higher high formed | Lower low formed |
---
### Scoring Breakdown
**CALL Score (Max 9 points):**
- Recent EMA cross up: +2 pts
- EMA alignment (fast > slow): +1 pt
- RSI in bullish range: +1 pt
- Above VWAP: +1 pt
- MACD bullish: +1 pt
- Volume spike on green candle: +1 pt
- Stochastic setup: +1 pt
- Above 200 EMA: +1 pt
- Breaking higher high: +1 pt
**PUT Score (Max 9 points):**
- Recent EMA cross down: +2 pts
- EMA alignment (fast < slow): +1 pt
- RSI in bearish range: +1 pt
- Below VWAP: +1 pt
- MACD bearish: +1 pt
- Volume spike on red candle: +1 pt
- Stochastic setup: +1 pt
- Below 200 EMA: +1 pt
- Breaking lower low: +1 pt
---
### Risk Management
The strategy uses **ATR-based dynamic stops and targets**:
| Parameter | Default | Description |
|-----------|---------|-------------|
| Stop Loss | 1.5x ATR | Distance below entry for longs, above for shorts |
| Take Profit | 2.0x ATR | Creates a 1:1.33 risk-reward ratio |
Positions are also closed on:
- Opposite direction signal (flip trade)
- Take profit or stop loss hit
---
### Session Filtering
Trades are restricted to high-liquidity periods by default:
- **Morning Session:** 9:30 AM - 11:00 AM EST
- **Afternoon Session:** 2:30 PM - 3:55 PM EST
This avoids choppy midday price action and captures the highest volume periods.
---
### Input Parameters
| Parameter | Default | Description |
|-----------|---------|-------------|
| Fast EMA | 9 | Fast moving average period |
| Slow EMA | 21 | Slow moving average period |
| Trend EMA | 200 | Long-term trend filter |
| RSI Length | 14 | RSI calculation period |
| RSI Overbought | 65 | Upper RSI threshold |
| RSI Oversold | 35 | Lower RSI threshold |
| Volume Multiplier | 1.2x | Volume spike detection threshold |
| Min Signal Strength | 4 | Minimum score required to trigger |
| Crossover Lookback | 3 | Bars to consider crossover "recent" |
| Min Bars Between Signals | 5 | Cooldown period between signals |
---
### Visual Elements
**Chart Plots:**
- Green line: 9 EMA (fast)
- Red line: 21 EMA (slow)
- Gray line: 200 EMA (trend)
- Purple dots: VWAP
**Signal Markers:**
- Green triangle up + "CALL" label: Buy call signal
- Red triangle down + "PUT" label: Buy put signal
- Small circles: EMA crossover reference points
**Info Table (Top Right):**
- Real-time CALL and PUT scores
- RSI, MACD, Stochastic values
- VWAP and 200 EMA position
- Recent crossover status
- Current signal state
---
### Alerts
| Alert Name | Trigger |
|------------|---------|
| CALL Entry | Standard call signal fires |
| PUT Entry | Standard put signal fires |
| Strong CALL | Call signal with score ≥ 6 |
| Strong PUT | Put signal with score ≥ 6 |
---
### Recommended Usage
| Setting | 0DTE Scalping | Intraday Swings |
|---------|---------------|-----------------|
| Timeframe | 1-2 min | 5 min |
| Min Signal Strength | 5-6 | 4 |
| ATR Stop Mult | 1.0 | 1.5 |
| ATR TP Mult | 1.5 | 2.0 |
| Option Delta | 0.40-0.50 | 0.30-0.40 |
---
### Key Improvements Over v1
1. **Requires actual crossover** - Eliminates false signals from simple trend continuation
2. **Balanced scoring** - Both directions evaluated equally, highest score wins
3. **Signal cooldown** - Prevents overtrading with minimum bar spacing
4. **Multi-indicator confluence** - 8 factors must align for signal generation
5. **Volume-candle alignment** - Volume spikes only count when matching candle direction
---
### Disclaimer
This strategy is for educational purposes. Backtest thoroughly before live trading. Options trading involves significant risk of loss. Past performance does not guarantee future results.

Sniper Perfect: Institutional Flow & Adaptive Risk ProtocolOverview Sniper Perfect is an advanced trend-following system designed to filter out "fakeouts" and institutional traps using a multi-layered verification protocol. It combines Volume Flow (VFI), Volatility (CHOP), and Momentum (RSI) to ensure entry only occurs in high-probability setups.
Key Features
🛡️ The Triple Filter Protocol
Strict Choppiness Filter: Uses a strict CHOP threshold (40). If the market is moving sideways, the algorithm locks all new entries to prevent whipsaws.
RSI Extremes Protection: Prevents FOMO buying at tops (Overbought > 70) and panic selling at bottoms (Oversold < 30).
Conflict Zone Detection: Identifies divergence between Price action and Money Flow. If price rises but institutional money exits, the background turns Gray and trading is disabled.
🔒 Adaptive Risk Management
Heat-Breathing Stop Loss: The SL distance adjusts dynamically based on market Volume and Volatility ("Heat").
Ratchet Mechanism: A mechanical lock ensures the Stop Loss can ONLY move in the direction of profit. It never loosens, guaranteeing that paper profits are protected.
📊 Live Dashboard A real-time panel in the bottom-right corner displays:
VFI Flow: Positive/Negative money flow.
Market Status: Active vs. Locked (Choppy).
RSI Status: Neutral, Overbought, or Oversold.
Visual Guide
🟢 Lime Zone: Clean Bullish Trend.
🔴 Red Zone: Clean Bearish Trend.
🟠 Orange Zone: High Choppiness (Stay Out).
🟣 'X' Marker: Exact price where the Stop Loss was triggered.
Disclaimer: For educational and research purposes only. Always manage your risk.

