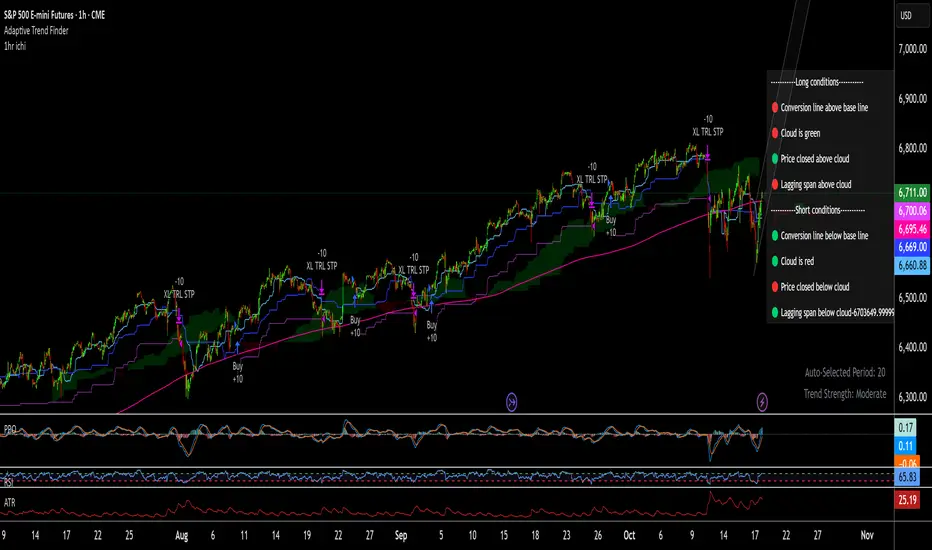
1hr ichi v6Ichimoku adapted to a 1hr chart
Set margin for positions to "0"
Adjust the number of contracts to the maximum drawdown you will accept. I use 11-13%
Indicators and strategies
USDJPY MA Zone Entry Strategy USD/JPY tested only.A consistent strategy that gives me alerts each time my conditions are met. I am a funded prop firm trader. this strategy gives 45-70% annual returns. the sequence for this strategy is: After 4 stop loss hits, place a trade on the NEXT ENTRY ALERT ONCE: (-.188) pips draw back towards the stop loss. (this turns the Strat from 1-3 RISK/REWARD to 1-7+ RISK/REWARD). keep the Stop Loss the same (-.300) away from your entry. Take Profit placed at (+1.488) from entry. if 3 losses in a row happens AFTER you've followed these instructions, don't trade again UNTIL the strategy has a TAKE PROFIT gain, then the sequence starts over again. that is this strategies losing streak. after that streak is over. the strategy will be back to give you profits.

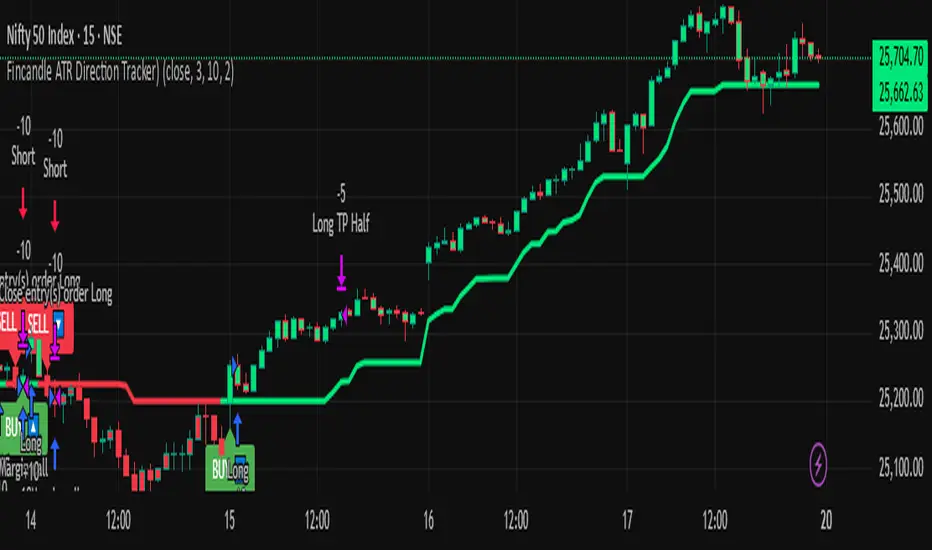
Fincandle ATR Direction TrackerOverview
The Fincandle ATR Direction Tracker is a strategy designed to capture momentum moves in the market using a dynamic ATR-based trailing stop. It identifies strong momentum candles and filters signals using trend alignment with moving averages.
Partial exits allow users to take a portion of profit at a predefined ATR multiple while keeping the remaining position open until the opposite signal occurs.
How It Works
Momentum Detection:
Measures candle body size relative to the Average True Range (ATR).
A candle is considered momentum if its body size exceeds ATR × Multiplier.
Trend Filter:
Uses two moving averages (Fast MA and Slow MA) to determine the market trend.
Bullish trend: Fast MA > Slow MA → long trades allowed
Bearish trend: Fast MA < Slow MA → short trades allowed
Trend filter can be toggled on or off.
ATR Trailing Stop:
A dynamic trailing stop adapts to price volatility.
Crossing above the trail triggers a buy signal, crossing below triggers a sell signal.
Partial Exit / Take Profit:
Step 1: Exit 50% of the position when price moves a configurable multiple of ATR in your favor.
Step 2: Close the remaining position when the opposite signal occurs (e.g., price crosses below/above the ATR trail).
How to Use
Add the strategy to any chart (stocks, indices, forex, crypto).
Configure ATR period, sensitivity, take profit multiple, and moving average lengths to suit the timeframe and asset.
Monitor buy/sell markers and dynamic ATR trail on the chart.
Optional: Set alerts for real-time notifications when signals trigger.
Adjust partial exit multiplier to control risk/reward.
Example Settings
ATR Period: 10
ATR Sensitivity: 3 × ATR
Take Profit: 2 × ATR
Fast MA: 50
Slow MA: 200
Partial Exit: 50% of position at take profit, remaining exits on opposite signal
Key Features
Adaptive ATR trailing stop for volatility-based entries/exits.
Trend alignment filter with Fast/Slow MA.
Partial exit logic for better risk management.
Visual BUY/SELL markers and alerts.
Fully Pine Script v6 compatible.
Disclaimer
This strategy is for educational and analytical purposes only.
It does not guarantee profits. Traders should always use proper risk management.
Sniper Algo TradingThis indicator analyzes market momentum and trend shifts using advanced multi-timeframe algorithms. It helps visualize potential reversals, continuations, and momentum flips with clear, intuitive signals designed for experienced traders.
Built for precision and adaptability — suitable for crypto, forex, and indices.
Note: For educational use only. Not financial advice.

Momentum/Breakout Strategy A professional-grade trend–momentum hybrid strategy designed for high–timeframe precision and long-term consistency.
It combines exponential moving averages (EMA 20/50) to define directional bias, RSI and MACD to confirm momentum strength, and a manually coded ADX filter to validate market trend quality.
ATR-based stop placement and trailing mechanisms control downside volatility, while an optional daily EMA trend filter aligns trades with higher–timeframe direction for smoother performance.

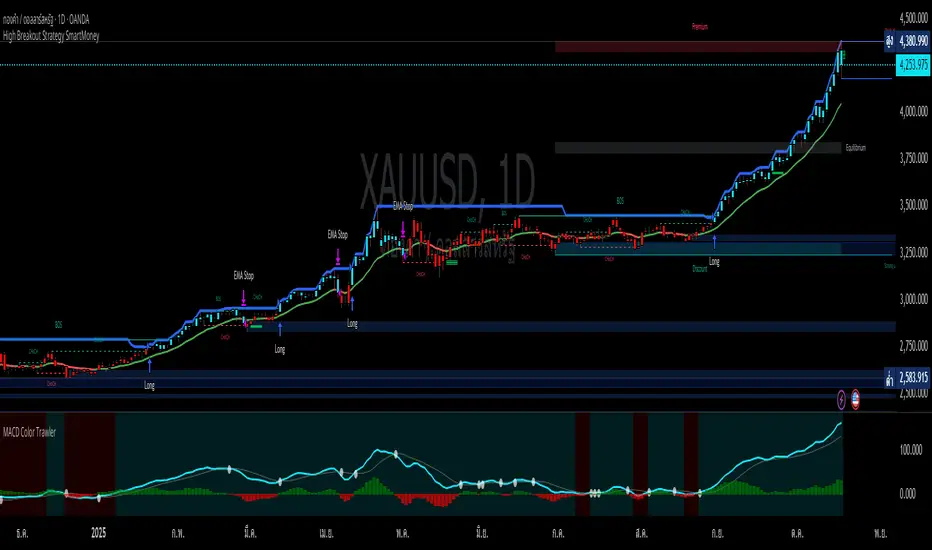
High Breakout Strategy SmartMoneybreakout_lookback = input.int(52, title="Breakout Lookback Period", minval=1)
// Trend & Trailing Stop Filter
ema_length = input.int(15, title="EMA Length", minval=1)
// Risk Management
risk_percent = input.float(6.0, title="Risk Stop-Loss (%)", minval=0.1)
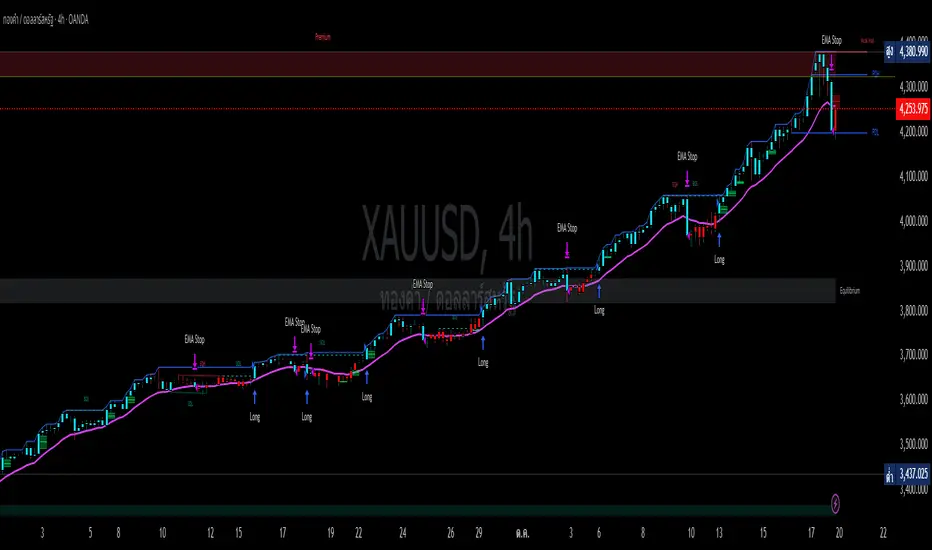
High Breakout Strategy SmartMoney// --- 1. INPUTS & CONFIGURATION ---
// Breakout
breakout_lookback = input.int(52, title="Breakout Lookback Period", minval=1)
// Trend & Trailing Stop Filter
ema_length = input.int(15, title="Stop EMA Length", minval=1)
// Risk Management
risk_percent = input.float(6.0, title="Risk Stop-Loss (%)", minval=0.1)
PROFIT ULTIMATE MTF 15-Min BTC 90%+ Profitable by RamBest strategy for making 90%+ profit in 15 min timeframe for BTCUSDT optimized for Bitget

PROFIT ULTIMATE 1-Min SCALPING 80% Profitable by RamishScalping trades indicator and strategy, ultimate profits more than 80% profitable trades in top coin. 1-Minute Only.

RSI Oversold/Overbought + SMA Crossover Strategymy first strat, to share with my friends, hope you all enjoy

Gold GC Renko Strategy Futures MGC MicrosRENKO SET UP FOR GC (1 CONTRACT)
TRADITIONAL
BOX SIZE 1
CHART TIMEFRAME 1 MINUTE
__________________________
REGULAR CANDLE SETUP FOR MGC (2 MICROS)
15 MIN TIMEFRAME
__________________________
This strategy trades pullbacks within a trend, using two EMAs (fast/slow) to define uptrends and downtrends. It waits for a volatility “squeeze” , then looks for momentum ignition to go long, while shorts require a cross and optional band break/downtrend confirmation. Risk is handled with fixed dollar profit target and stop-loss values (converted to ticks), with exits placed immediately after entries and an automatic flat-at-session-close (New York time). Signals and risk lines are plotted.


5min ORB with FVG God Modethis is 15 min Order Block strategy who works verry well on 3 min chart just must to close some
trading hours

TEMA 20/34/55 Strategie mit Buy & SellThis indicator uses three Triple Exponential Moving Averages (TEMA) with periods 20 (green), 34 (blue), and 55 (red) to identify trend direction.
A buy signal is generated when TEMA20 crosses above TEMA34 and TEMA34 crosses above TEMA55 (bullish trend start).
A sell signal is generated when TEMA20 crosses below TEMA34 and TEMA34 crosses below TEMA55 (bearish trend start).
The strategy enters long and short positions with configurable stop loss and take profit levels.
Ideal for trend following and suitable for intraday or swing trading.

D Money – EMA/TEMA Touch Strategy (Distance) What it’s trying to capture
You want mean-reversion “tags” back to a moving average after price has stretched away and momentum flips:
Bearish setup (short): price has been above EMA(9) for a few bars, then MACD turns bearish, and price is far enough above the EMA (by an adaptive threshold). Exit when price tags the EMA.
Bullish setup (long): price has been below your chosen TEMA rail (actually an EMA of 50/100/200 you pick) for a few bars, then MACD turns bullish, and price is far enough below that TEMA. Exit when price tags that TEMA.
The moving averages it uses
EMA(9) — your fast “tag” for short take-profits.
“TEMA line” input = one of EMA(50) / EMA(100) / EMA(200). (Labelled “Chosen TEMA” in the plot; it’s an EMA rail you pick.)
When it will enter trades
It requires four things per side:
Short (EMA-Touch Short)
MACD bearish cross on the signal bar
If “Require NO MA touch on cross bar” = true, the bar’s low must be above EMA(9), so it didn’t touch EMA on the cross bar (fake-out guard).
Extension/Context: you’ve had at least barsAbove consecutive closes above EMA(9) (default 3), so it’s truly stretched.
Distance test: absolute % distance from price to EMA(9) must be ≥ minDistEMA_eff (an adaptive threshold; details below).
Bounce filter: there was no bullish bounce off the EMA in the last bounceLookback bars (excluding the current one).
If all pass and you’re inside the backtest window → strategy.entry short.
Long (TEMA-Touch Long)
MACD bullish cross on the signal bar
With the same fake-out guard: the bar’s high must be below the chosen TEMA if the guard is on.
Extension/Context: at least barsAbove consecutive closes below the chosen TEMA.
Distance test: absolute % distance from price to TEMA must be ≥ minDistTEMA_eff (adaptive).
Bounce filter: there was no bearish bounce off the TEMA in the last bounceLookback bars.
If all pass and you’re in the window → strategy.entry long.
MACD timing option:
If Pure MACD Timing = ON, it only checks for the cross.
If OFF (default), it also enforces “no touch on the cross bar” if that checkbox is true. That’s your “fake-out” filter.
The adaptive distance threshold (the “secret sauce”)
You can choose how “far enough away” is determined—per side:
Fixed %
Short uses Fixed: Min distance ABOVE EMA (%)
Long uses Fixed: Min distance BELOW TEMA (%)
Auto (ATR%) (default)
Short threshold = max(floorEMA, kAtrShort × ATR%)
Long threshold = max(floorTEMA, kAtrLong × ATR%)
This scales distance by recent volatility, with a floor.
Auto (AvgDist%)
Short threshold = max(floorEMA, kAvgShort × average(|Dist to EMA|) over avgLen)
Long threshold = max(floorTEMA, kAvgLong × average(|Dist to TEMA|) over avgLen)
This adapts to the instrument’s typical stretch away from the rails.
These become minDistEMA_eff and minDistTEMA_eff and are re-computed each bar.
Fake-out / bounce logic (the “don’t get tricked” part)
A touch means the bar’s high/low overlapped the MA ± a small buffer % (touchBufPct).
A bounce is a touch plus a close on the “wrong” side (e.g., touch EMA and close above it on shorts = bullish bounce).
The script blocks entries if a bounce happened within bounceLookback bars (excluding the current signal bar).
Exits & risk
Take profit: when price touches the target MA:
Short TP = touch EMA(9)
Long TP = touch chosen TEMA
Stop loss: either
ATR stop: entry ± (atrMultStop × ATR) (default ON), or
Percent stop: entry × (1±stopPct%)
Time stop: if timeExitBars > 0, close after that many bars if still open.
Quality-of-life features
Backtest window (btFrom, btTo) so you can limit evaluation.
Labels on signal bars that show:
MACD bucket (Small/Moderate/HUGE/Violent — based on % separation on the bar),
the current absolute distance to the target MA,
and the effective minimum the engine used (plus which engine mode).
Data Window fields so you can audit:
abs distance to EMA/TEMA,
the effective min distance used on each side,
ATR%,
average absolute distances (for the AvgDist mode).
Alerts fire when a short/long signal is confirmed.
Optional debug panel to see the exact booleans & thresholds the bar had.
Quick mental model
Are we properly stretched away from the rail (by an adaptive threshold) and held on that side for a few bars?
Did MACD flip the way we want without price already tagging the rail that bar?
Have we avoided recent bounces off that rail (no fake-out)?
→ If yes, enter and aim for a tag back to the rail, with ATR/% stop and optional time stop.
If you want, I can add a simple on-chart “rating” (0–100) similar to your Python scorer (distance beyond min, MACD bucket, extension streak) so you can visually rank signals in TradingView too.

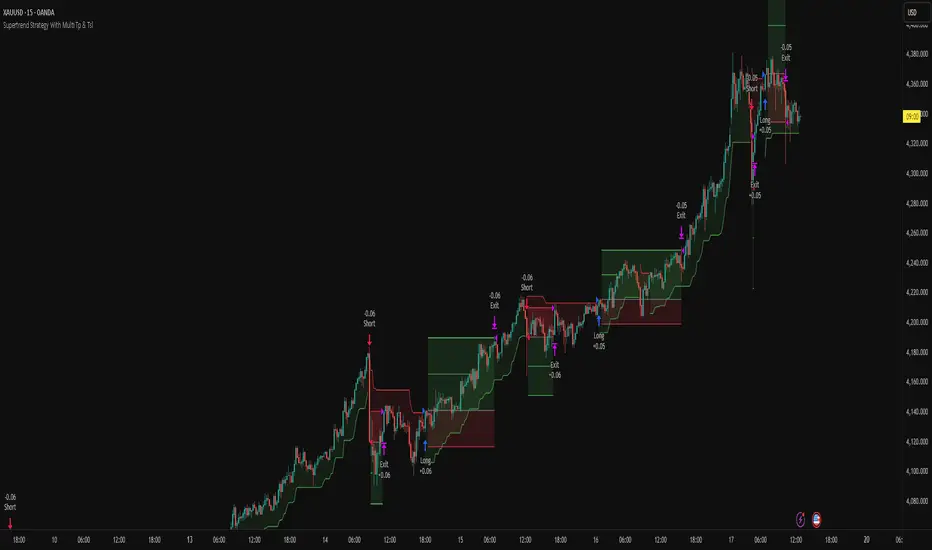
Supertrend Strategy With Multi Tp & TslHello Traders,
This strategy is based on the popular Supertrend indicator, which many traders use as a simple trend-following tool. The core entry logic is straightforward:
Buy (Long) when the price closes above the Supertrend line.
Sell (Short) when the price closes below the Supertrend line.
However, trading success isn’t only about entries — proper risk management makes all the difference. That’s why this strategy includes four stop-loss methods, two take-profit types, and a trailing stop-loss system. You can customize all of these settings to create your own personalized version.
🛑 Stop-Loss Methods
Tick – Uses the instrument’s smallest price increment. Ideal for tick-based markets such as Futures or Forex.
Percent – Defines the stop-loss as a percentage of entry price. Commonly used in Crypto trading.
ATR – Uses the Average True Range value to determine stop-loss distance. Perfect for adapting to changing market volatility.
Supertrend – The stop-loss level is set at the Supertrend line value at the time of entry.
🔁 Trailing Stop-Loss & Reverse Signals
Trailing SL: If enabled, the chosen stop-loss method will trail the price dynamically from the moment the position opens.
Close with Reverse Signals: When activated, the current position closes and reverses on an opposite signal. If disabled, the strategy waits until the current position is closed before opening a new one.
🎯 Take-Profit Options
Tick – Set a fixed take-profit level based on tick distance.
Percent – Set take-profit based on a percentage change from entry.
Ratio – Sets take-profit based on the entry-to-stop-loss distance × ratio value.
Each take-profit method allows you to define the percentage of position to close at that level.
⚖️ Breakeven Option
When Breakeven is enabled, after the first take-profit is triggered, the stop-loss automatically moves to the entry level, protecting your capital.
⚙️ Additional Settings
Position Type: Choose between Long only, Short only, or Both directions.
Session Filter: Trade only during specific time ranges. Activate this option and set your desired session hours (make sure to select your correct timezone).
📈 Visuals
The strategy plots entry, stop-loss, and take-profit levels directly on the chart, allowing you to clearly visualize your trades and manage them effectively.
Feel free to ask any questions or suggest improvements — this strategy is built for flexibility and experimentation!
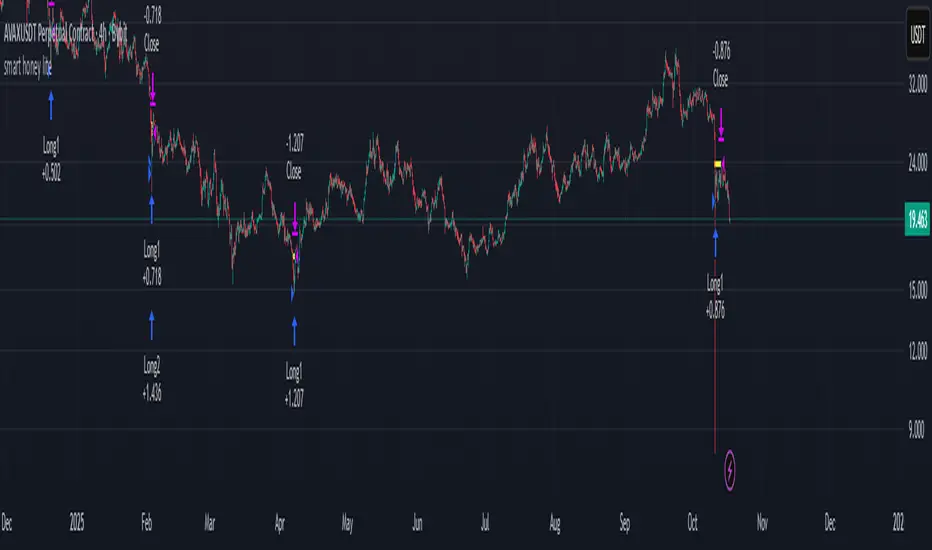
smart honey liteThis is template for strategy with averaging
After "longcondition = " you can set your own terms for first entry
AlgoWay GRSIM🧭 What this strategy tries to do
This strategy detects when a market move is losing strength and prepares for a potential reversal, but it waits for fresh momentum confirmation before acting.
It combines:
• RSI-based divergence (to spot exhaustion and potential turning points),
• Impulse MACD (to verify that the new direction actually has force behind it).
________________________________________
⚙️ When it takes trades
Long (Buy):
• A bullish RSI divergence appears (a clue that selling pressure is fading);
• Within a short time window, the Impulse MACD turns strongly positive;
• Optionally, the impulse line itself must be rising (if the Impulse Direction Filter is
enabled).
Short (Sell):
• A bearish RSI divergence appears (buying pressure fading);
• Within a short time window, the Impulse MACD turns strongly negative;
• Optionally, the impulse line must be falling (if the Impulse Direction Filter is enabled).
If momentum confirmation happens too late, the divergence “expires” and the signal is ignored.
________________________________________
🧩 How entries work
1. Reversal clue:
The strategy detects disagreement between price and RSI (price makes a new high/low, RSI doesn’t).
That suggests a shift in underlying strength.
2. Momentum confirmation:
Before entering, the Impulse MACD must agree — showing real push in the same direction.
3. Impulse direction filter (optional):
When enabled, the impulse itself must accelerate (rise for longs, fall for shorts), avoiding fake signals where price diverges but momentum is still fading.
4. No stacking:
It opens only one position at a time.
________________________________________
🚪 How exits work
Two main exit styles:
Conservative (default):
Longs close when impulse crosses below its signal line.
Shorts close when impulse crosses above its signal line.
✅ Keeps trades as long as momentum agrees.
Color-change (fast):
Longs close immediately when impulse flips bearish.
Shorts close immediately when impulse flips bullish.
⚡ Faster and more defensive.
Plus:
Stop Loss (%) and Take Profit (%) act as fixed-distance protective exits (set to 0 to disable either one).
________________________________________
📊 What you’ll see on the chart
A thick Impulse MACD line and thin signal line (oscillator view).
Diamonds — detected bullish/bearish divergence points.
Circles — where impulse crosses its signal (momentum change).
A performance panel (top-right) showing Net Profit, Trades, Win Rate, Profit Factor, Pessimistic PF, and Max Drawdown.
________________________________________
🔧 What you can tune
Signal Lifetime (bars): how long a divergence remains valid.
Impulse Direction Filter: ensure the impulse itself is moving in the trade’s direction.
Stop Loss / Take Profit (%): risk and target in percent.
Exit Style: conservative cross or faster color-change.
RSI / MA / Signal Lengths: adjust responsiveness (defaults are balanced).
________________________________________
💪 Strengths
Confirms reversals using momentum direction, not just divergence.
Avoids “early” signals where momentum is still fading.
Works symmetrically for longs and shorts.
Built-in stop/target protection.
Clear, visual confirmation of all logic components.
________________________________________
⚠️ Things to keep in mind
In sideways markets, the impulse can flip often — prefer conservative exits.
Too small SL/TP → constant stop-outs.
Too wide SL/TP → deep drawdowns.
Always test with different timeframes and markets.
________________________________________
💡 Practical tips
Start with default settings.
Enable “Use Impulse Direction Filter” in trending markets, disable it in very choppy ones.
Focus on Profit Factor, Win Rate, and Max Drawdown after several dozen trades.
Keep SL/TP roughly aligned with typical swing size.
“AlgoWay GRSIM” is a reversal-with-confirmation strategy: it spots likely turns, demands real momentum alignment (optionally verified by impulse direction), and manages exits with clear momentum cues plus built-in protective limits.

nadia
Gold ramon strategy based on 50 candles and atr of 12
You enter the maximum of 50 candles once the most bearish starts to rise, we expect 10 candles, if you don't go up in 10 candles, you don't enter, if you go up before 10 candles, you enter.
When is TP? Enough with 5 candles
The temporality is 1 hour. It can be adjusted to 1 minute temporality for scalping.
It is never lost, because it always exceeds the previous maximums.

ES cuhthis strategy uses laggard rsi to compute the best parameters to go long and tp at key levels. the overall trend strength within the rsi laggard indicator is what is used to automate the calculations within the script. enjoy and paramter optimize

Crypto Pro Strategy (Entry Model + Risk)Imma try to use this on a prop firm but if you want to use it itss free or im going to try to make it free
