Long-Term Strategy: 1-Year Breakout + 6-Month ExitDescripción (Description): (Copia y pega todo lo que está dentro del recuadro de abajo)
Description
This is a long-term trend-following strategy designed to capture major market moves while filtering out short-term noise. It is based on the classic principle of "buying strength" (Breakouts) and allowing profits to run, while cutting losses when the medium-term trend reverses.
How it Works (Logic)
1. Entry Condition (Long Only): The strategy looks for a significant display of strength. It enters a Long position only when two conditions are met simultaneously:
Price Breakout: The closing price exceeds the highest high of the last 252 trading days (approximately 1 year). This ensures we are entering during a strong momentum phase.
Trend Filter: The SuperTrend indicator (Settings: ATR 10, Factor 3.0) must be bullish. This acts as a confirmation filter to avoid false breakouts in choppy markets.
2. Exit Condition: The strategy uses a trailing stop based on price action, not a fixed percentage.
It closes the position when the price closes below the lowest low of the last 126 trading days (approximately 6 months).
This wide exit allows the trade to "breathe" during normal market corrections without exiting the position prematurely.
Settings & Risk Management
Capital Usage: The script is configured to use 10% of equity per trade to reflect realistic risk management (compounding).
Commissions: Included at 0.1% to simulate real trading costs.
Slippage: Included (3 ticks) to account for market execution variability.
Best Use: This strategy is intended for higher timeframes (Daily or Weekly) on trending assets like Indices, Crypto, or Commodities.
Indicators and strategies

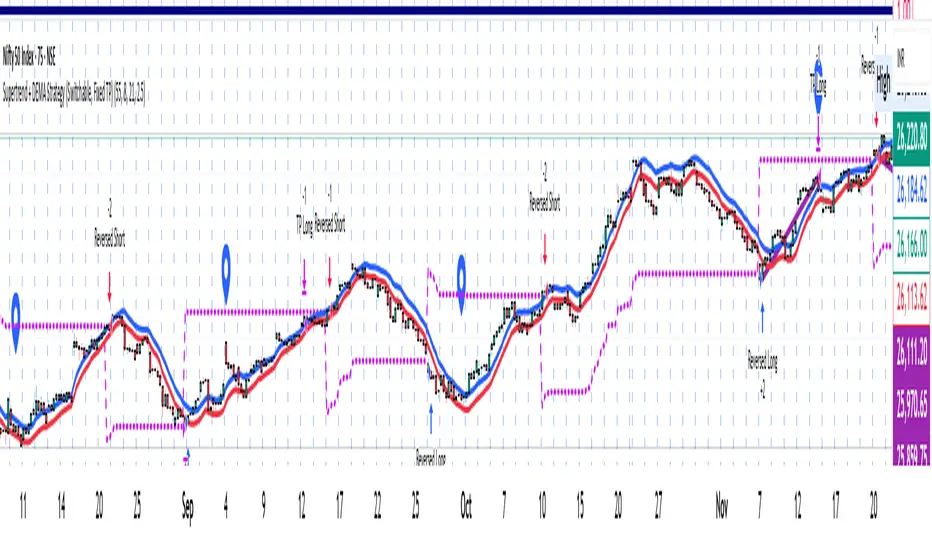
Supertrend + DEMA Strategy ( customised & Switchable, Fixed TP)Supertrend line – a moving line that follows the price and shows whether the market is trending up or down.
If the price goes above this line, it usually means the market is going up.
If the price goes below, it usually means the market is going down.
DEMA (Double Exponential Moving Average) – another line that smooths out price movements to spot trends more clearly.
It calculates an average of prices but reacts faster than a normal moving average.
Liquidity Sweep & FVG StrategyThis strategy combines higher-timeframe liquidity levels, stop-hunt (sweep) logic, Fair Value Gaps (FVGs) and structure-based take-profits into a single execution engine.
It is not a simple mash-up of indicators: every module (HTF levels, sweeps, FVGs, ZigZag, sessions) feeds the same entry/exit logic.
1. Core Idea
The script looks for situations where price:
Sweeps a higher-timeframe high/low (takes liquidity around obvious levels),
Then forms a displacement candle with a gap (FVG) in the opposite direction,
Then uses the edge of that FVG as a limit entry,
And manages exits using unswept structural levels (ZigZag swings or HTF levels) as targets.
The intent is to systematically trade failed breakouts / stop hunts with a defined structure and risk model.
It is a backtesting / study tool, not a signal service.
2. How the Logic Works (Conceptual)
a) Higher-Timeframe Liquidity Engine
Daily, Weekly and Monthly highs/lows are pulled via request.security() and stored as HTF liquidity levels.
Each level is drawn as a line with optional label (1D/1W/1M High/Low).
A level is marked as “swept” once price trades through it; swept levels may be removed or shortened depending on settings.
b) Sweep & Manipulation Filter
A low sweep occurs when the current low trades through a stored HTF low.
A high sweep occurs when the current high trades through a stored HTF high.
If both a high and a low are swept in the same bar, the script flags this as “manipulation” and blocks new entries around that noise.
The script also tracks the sweep wick, bar index and HTF timeframe for later use in SL placement and labels.
c) FVG Detection & Management
FVGs are defined using a 3-candle displacement model:
Bullish FVG: high < low
Bearish FVG: low > high
Only gaps larger than a minimum size (ATR-based if no manual value is set) are kept.
FVGs are stored in arrays as boxes with: top, bottom, mid (CE), direction, and state (filled / reclaimed).
Boxes are auto-extended and visually faded when price is far away, or deleted when filled.
d) Entry Conditions (Sweep + FVG)
For each recent sweep window:
After a low sweep, the script searches for the nearest bullish FVG below price and uses its top edge as a long limit entry.
After a high sweep, it searches for the nearest bearish FVG above price and uses its bottom edge as a short limit entry.
A “knife protection” check blocks trades where price is already trading through the proposed stop.
Only one entry per sweep is allowed; entries are only placed inside the configured NY trading sessions and only if no manipulation flag is active and EOD protection allows it.
e) Stop-Loss Placement (“Tick-Free” SL)
The stop is not placed directly on the HTF level; instead, the script scans a window around the sweep bar to find a local extreme:
Longs: lowest low in a configurable bar window around the sweep.
Shorts: highest high in that window.
This produces a structure-based SL that is generally outside the main sweep wick.
f) Take-Profit Logic (ZigZag + HTF Levels)
A lightweight ZigZag engine tracks swing highs/lows and removes levels that have already been broken.
For intraday timeframes (< 1h), TP candidates come from unswept ZigZag swings above/below the entry.
For higher timeframes (≥ 1h), TP candidates fall back to unswept HTF liquidity levels.
The script picks up to two targets:
TP1: nearest valid target in the trade direction (or a 2R fallback if none exists),
TP2: second target (or a 4R fallback if none exists).
A multi-TP model is used: typically 50% at TP1, remainder managed towards TP2 with breakeven plus offset once TP1 is hit.
g) Session & End-of-Day Filters
Three predefined NY sessions (Early, Open, Afternoon) are available; entries are only allowed inside active sessions.
An End-of-Day filter checks a user-defined NY close time and:
Blocks new entries close to the end of the day,
Optionally forces flat before the close.
3. Inputs Overview (Conceptual)
Liquidity settings: which HTF levels to track (1D/1W/1M), how many to show, and sweep priority (highest TF vs nearest vs any).
FVG settings: visibility radius, search window after a sweep, minimum FVG size.
ZigZag settings: swing length used for TP discovery.
Execution & protection: limit order timeout, breakeven offset, EOD protection.
Visuals: labels, sweep markers, manipulation warning, session highlighting, TP lines, etc.
For exact meaning of each input, please refer to the inline comments in the open-source code.
4. Strategy Properties & Backtesting Notes
Default strategy properties in this script:
Initial capital: 100,000
Order size: 10% of equity (strategy.percent_of_equity)
Commission: 0.01% per trade (adjust as needed for your broker/asset)
Slippage: must be set manually in the Strategy Tester (recommended: at least a few ticks on fast markets).
Even though the order size is 10% of equity, actual risk per trade depends on the SL distance and is typically much lower than 10% of the account. You should still adjust these values to keep risk within what you personally consider sustainable (e.g. somewhere in the 1–2% range per trade).
For more meaningful results:
Test on liquid instruments (e.g. major indices, FX, or liquid futures).
Use enough history to reach 100+ closed trades on your market/timeframe.
Always include realistic commission and slippage.
Do not assume that past performance will continue.
5. How to Use
Apply the strategy to your preferred symbol and timeframe.
Set broker-like commission and slippage in the Strategy Tester.
Adjust:
HTF levels (1D/1W/1M),
Sessions (NY windows),
FVG search window and minimum size,
ZigZag length and EOD filter.
Observe how entries only appear:
After a HTF sweep,
In the configured session,
At a FVG edge,
With TP lines anchored at unswept structure / liquidity.
Use this primarily as a research and backtesting tool to study how your own ICT / SMC ideas behave over a large sample of trades.
6. Disclaimer
This script is for educational and research purposes only.
It does not constitute financial advice, and it does not guarantee profitability. Always validate results with realistic assumptions and use your own judgment before trading live.

VWolf – Apex GateOverview
VWolf – Apex Gate is a trend-continuation system that blends a Pivot-weighted Supertrend (PVT ST) with an optional **Normal Supertrend** trigger, all **gated by a 200-EMA directional filter. The strategy’s risk controls are volatility-aware—**stops and targets scale by ATR**, and quantity is computed from a fixed **% risk per trade**. Clear **Backtest / Forwardtest** modes with date windows let you validate on segmented datasets before committing to live use.
Recommended Use
- **Markets:** High-liquidity instruments (indices, large-cap equities, liquid FX and major crypto pairs) where trends and pullbacks are clean.
- **Timeframes:** 15m–1h for active intraday; 4h–1D for swing. Lower timeframes may benefit from stricter EMA gating and slightly wider ATR stops.
- **Workflow:**
1. Start with **Backtest** to set baseline ATR/EMA parameters.
2. Move to **Forwardtest** to confirm generalization.
3. Consider walk-forward or multi-symbol rotation to assess robustness.
Strengths & Precautions
Strengths
- **Dual engine** (PVT ST + Normal ST) improves signal quality; the **EMA gate** screens counter-trend noise.
- **ATR-native** stops/targets standardize risk across regimes/instruments.
- **Capital-proportional sizing** preserves account geometry and smooths drawdowns.
- **Clear test segmentation** supports objective evaluation.
Precautions
- **Whipsaw risk** in tight ranges: widen ATR multipliers, enable the EMA gate, or require co-confirmation.
- **Supertrend-anchored stops** can expand in volatility spikes; ensure **% risk** remains within tolerance.
- **One-position policy** avoids stacking risk but forgoes scaling into strong trends; advanced users may prefer add-on frameworks outside this baseline.
Conclusion
VWolf – Apex Gate seeks to enter shortly after **regime flips**, demanding alignment between a **pivot-aware Supertrend** and (optionally) a **classic Supertrend**, while an **EMA gate** enforces directional discipline. With **ATR-driven** stops/targets and **fixed-fraction** sizing, the system adapts naturally to changing volatility. Use the **Backtest** window to dial ranges and the **Forwardtest** window to prove durability on unseen data. For best results, tailor ATR multipliers and the EMA gate to your instrument’s structure and your personal drawdown tolerance.

AUDNZD Mean Reversion (5 minutes)Here are the results
drive.google.com
🔒 The Mechanism for Exploiting Asymmetry in the AUD/NZD Pair
This strategy is not about directional trading; it is about Relational Trading, leveraging the structural fact that the Australian Dollar (AUD) and New Zealand Dollar (NZD) are highly synchronized due to their similar fundamental drivers (commodity exports, sensitivity to China, risk sentiment). This coupling creates a strong Structural Elasticity where the price is inherently inclined to revert to a long-term equilibrium.
1. Defining the Equilibrium State (The Center Point)
The core of the strategy lies in accurately defining the pair's True Statistical Mean (μ), which acts as the pair's long-term gravitational center.
Principle: Identify the μ value—the statistical equilibrium—that the pair has historically maintained (often observed near the 1.0800 - 1.1000 range).
Significance: This μ represents the Gravitational Pull; any movement beyond this point is considered temporary short-term noise or a deviation from the structural norm.
2. Measuring the Tension (The Deviation Gauge)
A statistical tool is necessary to measure precisely how far the price has been stretched away from its mean relative to its historical volatility.
The Instrument: This is achieved by calculating the Z-Score or using volatility-based Envelopes calibrated against the historical standard deviation of the price movement relative to μ.
The Analysis: When the AUD/NZD price deviates beyond a statistical significance level (e.g., exceeding ±2 Sigma), it indicates that the Tension in the relationship has peaked, and the corrective force towards the mean is maximized.
3. The Execution Protocol (Actionable Triggers)
Trading occurs only when tension is at an extreme, effectively fading the current momentum to capitalize on the structural force of mean reversion.
__________________________________________________________________________________
🔒 กลไกการฉวยโอกาสจากความไม่สมมาตรในคู่ AUD/NZD
กลยุทธ์นี้ไม่ได้เป็นการเทรดทิศทาง (Directional) แต่เป็นการเทรด ความสัมพันธ์ (Relational) โดยอาศัยข้อเท็จจริงที่ว่า AUD และ NZD เป็นสกุลเงินที่ได้รับอิทธิพลจากปัจจัยพื้นฐานที่ใกล้เคียงกันมาก (สินค้าโภคภัณฑ์และความเสี่ยง) จึงทำให้ราคามี "ความยืดหยุ่นเชิงโครงสร้าง" ที่จะกลับมาสู่จุดสมดุลเสมอ
1. การกำหนดจุดศูนย์กลาง (The Equilibrium State)
หัวใจของกลยุทธ์คือการนิยาม "ค่าเฉลี่ยจริง" ของความสัมพันธ์นี้ (ไม่ใช่แค่ค่าเฉลี่ยเคลื่อนที่ของราคา)
หลักการ: ต้องหาค่า μ (Mu) ซึ่งเป็นจุด สมดุลทางสถิติ ในระยะยาวของคู่เงินนี้ ซึ่งมักอยู่ใกล้เคียงค่า 1.0800 - 1.1000
ความสำคัญ: ค่า μ นี้คือ เส้นแรงดึงดูด (Gravitational Pull) ที่ราคามีแนวโน้มจะวิ่งกลับเข้าหาในท้ายที่สุด การเคลื่อนไหวที่เกินจากจุดนี้ถือเป็นเพียง "สัญญาณรบกวนระยะสั้น"
2. การวัดความตึงเครียด (The Tension Gauge)
เราจำเป็นต้องมีเครื่องมือวัดว่าแรงดึงดูดถูก "ยืดออก" ไปจากค่าสมดุลมากน้อยเพียงใด ซึ่งทำได้โดยการวัด "ความเบี่ยงเบนมาตรฐาน (Standard Deviation)" ของราคาเทียบกับจุดศูนย์กลาง
เครื่องมือที่ใช้: การประยุกต์ใช้ค่า Z-Score หรือ Envelope ที่ตั้งค่าตามความผันผวนทางสถิติในอดีต
การวิเคราะห์: เมื่อราคา AUD/NZD เบี่ยงเบนเกินระดับนัยสำคัญ (เช่น เกิน ±2 Sigma) นั่นหมายความว่า ความตึงเครียด ระหว่างสองสกุลเงินอยู่ในระดับสูงสุด และแรงผลักให้กลับสู่ค่าเฉลี่ยกำลังสะสม
3. โปรโตคอลการเข้าปฏิบัติการ (The Execution Protocol)
การเข้าเทรดจะต้องเกิดขึ้นเมื่อความตึงเครียดถึงขีดสุด โดยเป็นการ "สวนทางกับแรงเหวี่ยงปัจจุบัน" เพื่อจับจังหวะที่แรงดึงดูดกลับเข้าทำงาน

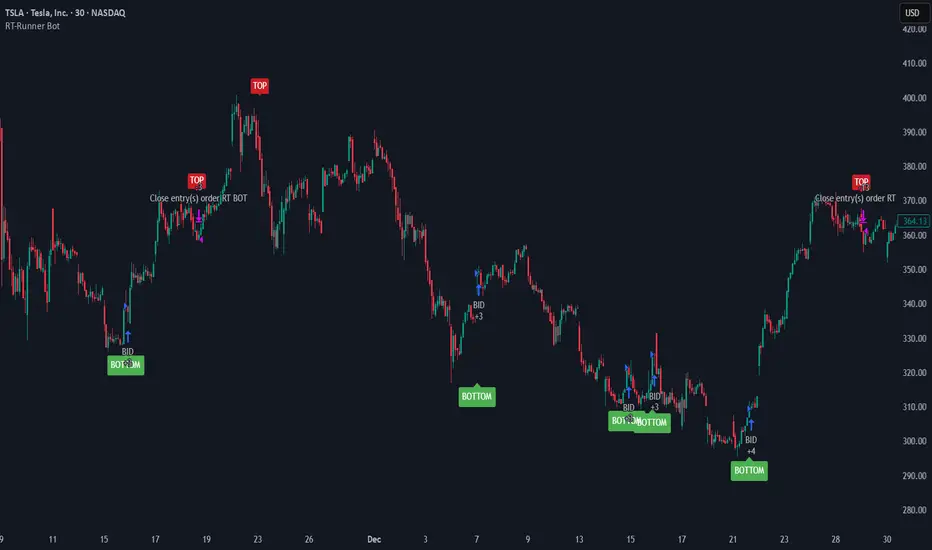
RT-Runner BotRunner Bot is a trend following tool designed to highlight when price shifts from normal back and forth rotation into stronger directional moves. It is built to help traders focus on higher quality trend legs, stay patient during chop, and avoid forcing trades when conditions are not aligned.
Blurring The Lines - Indicator vs Bot
Rainbow Trends set out to combine some of the ideas behind automated trading bots with the flexibility of trading indicators. After years of development, Runner Bot was built as an "indicator bot" that can be applied across multiple assets and multiple timeframes from the same interface.
How It Works
This tool aims to identify points where large market players - the "whales" - may be more likely to reverse the trend. It generates BOTTOM signals when its conditions suggest a potential market bottom has formed, and TOP signals when it detects that a potential top has been reached.
These signals are plotted directly on the chart so traders can visually review where Runner Bot has flagged prior tops and bottoms and compare them with their own levels, structure, and risk management.
How It Changes With Timeframe
Runner Bot identifies trend reversals based on the selected timeframe. The same logic can be applied across intraday, swing, and macro views, but its behavior will naturally change:
For macro level reversals, many traders focus on higher timeframes such as H4 to H12.
If you are scalping, you can switch to much lower timeframes, but keep in mind that bottoms detected on shorter intervals are less reliable at predicting a true long term bottom.
Choosing the timeframe intentionally is important: higher timeframes tend to highlight larger structural tops and bottoms, while lower timeframes are more sensitive to short term noise.
Tuning The Bot
Runner Bot was built to be relatively turnkey, but it does allow users to tune it for specific timeframes and assets.
To adjust the sensitivity of the TOP/BOTTOM prints, adjust the first two values in the settings column:
Decreasing these values (negative adjustments) will generally increase the number of TOP/BOTTOM signals the bot will fire.
Increasing these values will do the opposite and make TOP/BOTTOM signals less common.
This lets traders decide whether they want Runner Bot to be more selective (fewer, higher conviction style signals) or more frequent (more signals for active traders).
The trader also has the option to toggle the signals On/Off as desired. Some traders prefer to only plot TOPs and not BOTTOMs, or only BOTTOMs and not TOPs, depending on their strategy.
Limitations Of The Tool
Under the hood, Runner Bot uses internal algorithms working together to analyze price action. It can be applied across multiple timeframes, but like any tool, it has its sweet spots:
On higher ranges like 12H to 1D, you will mostly see TOP signals, which can be useful for monitoring extended moves.
On ultra low timeframes under 15 minutes, market noise can increase and short term bottoms are less reliable as long term turning points.
Fine tuning your settings to match your strategy, asset, and timeframe is recommended rather than relying on one configuration for every situation.
Preferred Settings
Over time, a few configurations have become common starting points:
H4 - A core timeframe to start catching both Tops and Bottoms across TradFi, Crypto, and Commodities.
H2/H4 Combo - Monitoring Bottoms on H2 and taking profits on H4 has been a popular combination among Rainbow Theory traders. H2 can provide earlier entries, while H4 offers a more conservative, lagging exit.
1D/H24 - Helpful for macro Tops in both TradFi and Crypto when combined with other higher timeframe context.
These are not rules, but practical examples of how some traders choose to deploy Runner Bot.
Automating Alerts
Runner Bot can also be connected to standard TradingView alerts so TOP and BOTTOM signals do not need to be watched manually on every bar.
A typical alert setup:
Symbol - Set to the asset you are charting.
Condition - Set to Runner Bot (this will use the settings you currently have on the chart).
Condition detail - Use the alert() function calls only so the tool can send alerts when TOP or BOTTOM signals fire.
Interval - Same as chart (this locks alerts to the timeframe you set them up on).
Once alerts are configured, TradingView can notify you according to your alert preferences whenever Runner Bot detects a new TOP or BOTTOM based on your current settings.
Important Note
Runner Bot is intended to provide additional context around tops, bottoms, and broader trend behavior. It is not a standalone signal generator and should always be used together with your own analysis, testing, and risk management. Historical Runner Bot signals and past market reversals do not guarantee future results.
🐋 Tight lines and happy trading!
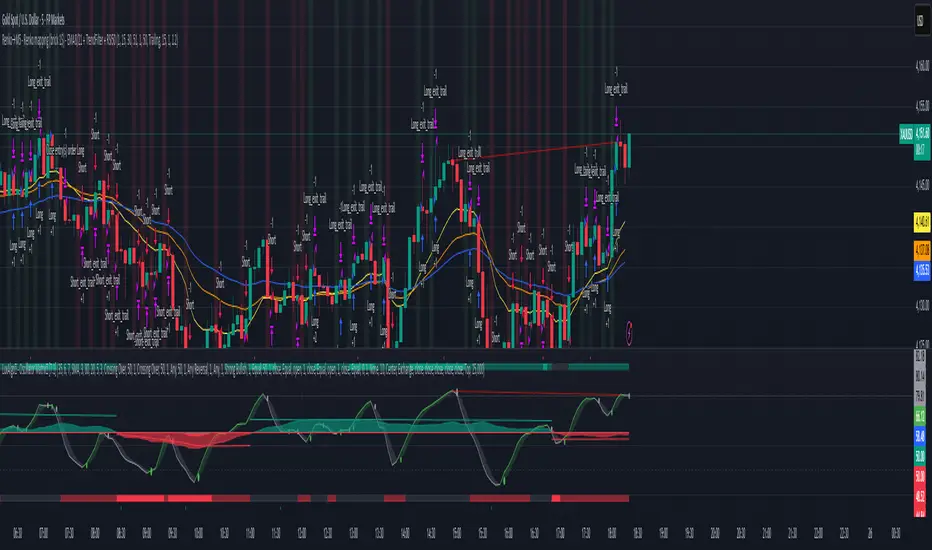
1M XAU Cumulative Delta Volume with OB Breakouts
### Overview
This is a **session-based CVD strategy** built around the **00:00–07:00 CEST range**. It finds the high/low of that session, turns them into **adaptive ATR-based support (yellow)** and **resistance (purple)** zones, and trades only **CVD-confirmed reversals** off those levels.
---
### How it Works
* For each day, the script:
* Builds a 00:00–07:00 CEST **profile high/low**.
* Creates a **support zone** around the session low and a **resistance zone** around the session high.
* Using lower timeframe data, it reconstructs **Cumulative Volume Delta (CVD)** and a **recent delta** filter.
* It arms “pending” states when price **enters a zone from the correct side**, then confirms:
* **BUY (long):** price reclaims above support and recent CVD is strongly positive.
* **SELL (short):** price rejects below resistance and recent CVD is strongly negative.
Only these two CVD signals (`buySignal` / `sellSignal`) open trades.
---
### Strategy Logic
* **Entries**
* `buySignal` → open **long** (if flat).
* `sellSignal` → open **short** (if flat).
* No pyramiding; one position at a time.
* **Exits (only TP & SL)**
* Long: TP at `avg_price * (0.5 + TP%)`, SL at `avg_price * (1 – SL%)`.
* Short: TP at `avg_price * (0.5 – TP%)`, SL at `avg_price * (1 + SL%)`.
* No opposite-signal exits.
---
### Extras
* **Reversal markers** on yellow/purple zones and **breakout/retest markers** are plotted for context and alerts but **do not trigger entries**.
* Zone width and “thickening” are ATR-based so important touches and near-touches are easy to see.
* Only suited for **1m intraday scalping** (e.g. XAU/USD), but can be tested on other markets/timeframes.

Simple Grid Trading v1.0 [PUCHON]Simple Grid Trading v1.0
Overview
This is a Long-Only Grid Trading Strategy developed in Pine Script v6 for TradingView. It is designed to profit from market volatility by placing a series of Buy Limit orders at predefined price levels. As the price drops, the strategy accumulates positions. As the price rises, it sells these positions at a profit.
Features
Grid Types : Supports both Arithmetic (equal price spacing) and Geometric (equal percentage spacing) grids.
Flexible Order Management : Uses strategy.order for precise control and prevents duplicate orders at the same level.
Performance Dashboard : A real-time table displaying key metrics like Capital, Cashflow, and Drawdown.
Advanced Metrics : Includes Max Drawdown (MaxDD) , Avg Monthly Return , and CAGR calculations.
Customizable : Fully adjustable price range, grid lines, and lot size.
Dashboard Metrics
The dashboard (default: Bottom Right) provides a quick snapshot of the strategy's performance:
Initial Capital : The starting capital defined in the strategy settings.
Lot Size : The fixed quantity of assets purchased per grid level.
Avg. Profit per Grid : The average realized profit for each closed trade.
Cashflow : The total realized net profit (closed trades only).
MaxDD : Maximum Drawdown . The largest percentage drop in equity (realized + unrealized) from a peak.
Avg Monthly Return : The average percentage return generated per month.
CAGR : Compound Annual Growth Rate . The mean annual growth rate of the investment over the specified time period.
Strategy Settings (Inputs)
Grid Settings
Upper Price : The highest price level for the grid.
Lower Price : The lowest price level for the grid.
Number of Grid Lines : The total number of levels (lines) in the grid.
Grid Type :
Arithmetic: Distance between lines is fixed in price terms (e.g., $10, $20, $30).
Geometric: Distance between lines is fixed in percentage terms (e.g., 1%, 2%, 3%).
Lot Size : The fixed amount of the asset to buy at each level.
Dashboard Settings
Show Dashboard : Toggle to hide/show the performance table.
Position : Choose where the dashboard appears on the chart (e.g., Bottom Right, Top Left).
How It Works
Initialization : On the first bar, the script calculates the price levels based on your Upper/Lower price and Grid Type.
Entry Logic :
The strategy places Buy Limit orders at every grid level below the current price.
It checks if a position already exists at a specific level to avoid "stacking" multiple orders on the same line.
Exit Logic :
For every Buy order, a corresponding Sell Limit (Take Profit) order is placed at the next higher grid level.
MaxDD Calculation :
The script continuously tracks the highest equity peak.
It calculates the drawdown on every bar (including intra-bar movements) to ensure accuracy.
Displayed as a percentage (e.g., 5.25%).
Disclaimer
This script is for educational and backtesting purposes only. Grid trading involves significant risk, especially in strong trending markets where the price may move outside your grid range. Always use proper risk management.

RSI Strategy [PrimeAutomation]⯁ OVERVIEW
The RSI Strategy is a momentum-driven trading system built around the behavior of the Relative Strength Index (RSI).
Instead of using traditional overbought/oversold zones, this strategy focuses on RSI breakouts with volatility-based trailing stops, adaptive profit-targets, and optional early-exit logic.
It is designed to capture strong continuation moves after momentum shifts while protecting trades using ATR-based dynamic risk management.
⯁ CONCEPTS
RSI Breakout Momentum: Entries happen when RSI breaks above/below custom thresholds, signaling a shift in momentum rather than mean reversion.
Volatility-Adjusted Risk: ATR defines both stop-loss and profit-target distances, scaling positions based on market volatility.
Dynamic Trailing Stop: The strategy maintains an adaptive trailing level that tightens as price moves in the trade’s favor.
Single-Position System: Only one trade at a time (no pyramiding), maximizing clarity and simplifying execution.
⯁ KEY FEATURES
RSI Signal Engine
• Long when RSI crosses above Upper threshold
• Short when RSI crosses below Lower threshold
These levels are configurable and optimized for trend-momentum detection.
ATR-Based Stop-Loss
A custom ATR multiplier defines the initial stop.
• Long stop = price – ATR × multiplier
• Short stop = price + ATR × multiplier
Stops adjust continuously using a trailing model.
ATR-Based Take Profit (Optional)
Profit targets scale with volatility.
• Long TP = entry + ATR × TP-multiplier
• Short TP = entry – ATR × TP-multiplier
Users can disable TP and rely solely on trailing stops.
Real-Time Trailing Logic
The stop updates bar-by-bar:
• In a long trade → stop moves upward only
• In a short trade → stop moves downward only
This keeps the stop tight as trends develop.
Early Exit Module (Optional)
After X bars in a trade, opposite RSI signals trigger exit.
This reduces holding time during weak follow-through phases.
Full Visual Layer
• RSI plotted with threshold fills
• Entry/TP/Stop visual lines
• Color-coded zones for clarity
⯁ HOW TO USE
Look for RSI Breakouts:
Focus on RSI crossing above the upper boundary (long) or below the lower boundary (short). These moments identify fresh momentum surges.
Use ATR Levels to Manage Risk:
Because stops and targets scale with volatility, the strategy adapts well to both quiet and explosive market phases.
Monitor Trailing Stops for Trend Continuation:
The trailing stop is the primary driver of exits—often outperforming fixed targets by catching larger runs.
Use on Liquid Markets & Mid-Higher Timeframes:
The system performs best where RSI and ATR signals are clean—crypto majors, FX, and indices.
⯁ CONCLUSION
The RSI Strategy is a modern RSI breakout system enhanced with volatility-adaptive risk management and flexible exit logic. It is designed for traders who prefer momentum confirmation over mean reversion, offering a disciplined framework with robust protections and dynamic trend-following capability.
Its blend of ATR-based stops, optional profit targets, and RSI-driven entries makes it a reliable strategy across a wide range of market conditions.

NIFTY Options Breakout StrategyThis strategy trades NIFTY 50 Options (CALL & PUT) using 5-minute breakout logic, strict trend filters, expiry-based symbol validation, and a dynamic trailing-profit engine.
1️⃣ Entry Logic
Only trades NIFTY 50 options, filtered automatically by symbol.
Trades only between 10:00 AM – 2:15 PM (5m bars).
Breakout trigger:
Price enters the buy breakout zone (high of last boxLookback bars ± buffer).
Trend filter:
Price must be above EMA50 or EMA200,
AND EMA50 ≥ EMA100 (to avoid weak conditions).
Optional strengthening:
EMA20>EMA50 OR EMA50>EMA100 recent cross can be enforced.
Higher-timeframe trend check:
EMA50 > EMA200 (bullish regime only).
Start trading options only after expiry–2 months (auto-parsed).
2️⃣ One Trade Per Day
Maximum 1 long trade per day.
No shorting (long-only strategy).
3️⃣ Risk Management — SL, TP & Trailing
Includes three types of exits:
🔹 A) Hard SL/TP
Hard Stop-Loss: -15%
Hard Take-Profit: +40%
🔹 B) Step-Ladder Trailing Profit
As the option price rises, trailing activates:
Max Profit Reached Exit Trigger When Falls To
≥ 35% ≤ 30%
≥ 30% ≤ 25%
≥ 25% ≤ 20%
≥ 20% ≤ 15%
≥ 15% ≤ 10%
≥ 5% ≤ 0%
🔹 C) Loss-Recovery Exit
If loss reaches –10% but then recovers to 0%, exit at breakeven.
4️⃣ Trend-Reversal Exit
If price closes below 5m EMA50, the long is exited instantly.
5️⃣ Optional Intraday Exit
EOD square-off at 3:15 PM.
6️⃣ Alerts for Automation
The strategy provides alerts for:
BUY entry
TP/SL/Trailing exit
EMA50 reversal exit
EOD exit

Nifty Breakout Levels Strategy (v7 Hybrid)Nifty Breakout Levels Strategy (v7 Hybrid – Compounding from Start Date)
Instrument / TF: Designed for current-month NIFTY futures on 1-hour timeframe, with at most 1 trade per day.
Entry logic: Uses a 10-bar breakout box with a 0.3% buffer, plus EMA-based trend + proximity filter.
Longs: price in breakout-high zone, above EMA50/EMA200 and within proximityPts.
Shorts: price in breakout-low zone and strong downtrend (EMA10 < EMA20 < EMA50 < EMA200, price below EMA200).
Trades only when ATR(14) > atrTradeThresh and during regular hours (till 15:15).
Risk / exits: Stop loss is ATR-adaptive – max of slBasePoints (100 pts) and ATR * atrSLFactor; TP is fixed (tpPoints, e.g. 350 pts).
Longs have stepped trailing profit levels (100/150/200/250/320 pts) that lock in gains on pullbacks.
Shorts have trailing loss-reduction levels (80/120/140 pts) to cut improving losses.
Additional exit: 1H EMA50 2-bar reversal against the position, plus optional EOD flatten at 3:15 PM.
Compounding engine: From a chosen start date, equity is rebased to startCapital, and lot size scales dynamically as equity / capitalPerLot, with automatic lot reductions at three drawdown thresholds (ddCut1 / 2 / 3).
Automation: All entries and exits are exposed via alertconditions (long/short entry & exit) so the strategy can be connected to broker/webhook automation.

MTF EMA Hariss 369The strategy has been prepared in a simplistic manner and easy to understand the concept by any novice trader.
Indicators used:
Current Time frame 20 EMA- Gives clear look about current time frame dynamic support and resistance and trend as well.
Higher Time Frame 20 EMA: Gives macro level trend, support and resistance
Kama: Capture volatility and trend direction.
RVOL: Main factor of price movement.
Buy when price closes above current time frame 20 ema and current time frame 20 ema is above higher time frame 20 ema. Stop loss just below the low of last candle. One can use current time frame 20 ema, higher time frame 20 ema or kama as stop loss depending upon type of asset class and risk appetite. The ideal way is to keep 20 ema as trailing sl if one wants to trail with trend.
Sell when price closes below current time frame 20 ema and current time frame 20 ema is lower than higher time frame 20 ema. Stop loss just above high of last candle.
Ideal target is 1.5 or 2 times of stop loss.
Entry and exit time depends on trading style. Eg. if you want to enter and exit in 5 min time frame, then choose 15 min or 1h as higher time frame as trend filter. Buy and sell signals are also plotted based on this strategy. One should always go with the higher time frame trend. Opting higher time frame trend filter always filters out market noises.

15m ORB Breakout NAS100 (5m Mgmt) v6 - OptimizedOpening Range Breakout Strategy
Buy and sell signals are given upon break of market session opening range. Best utilized for 30 minute NY opening range, managed on 5 min timeframe on NAS100. Tweak the settings for higher win rate on backtesting dashboard before implementing strategy.

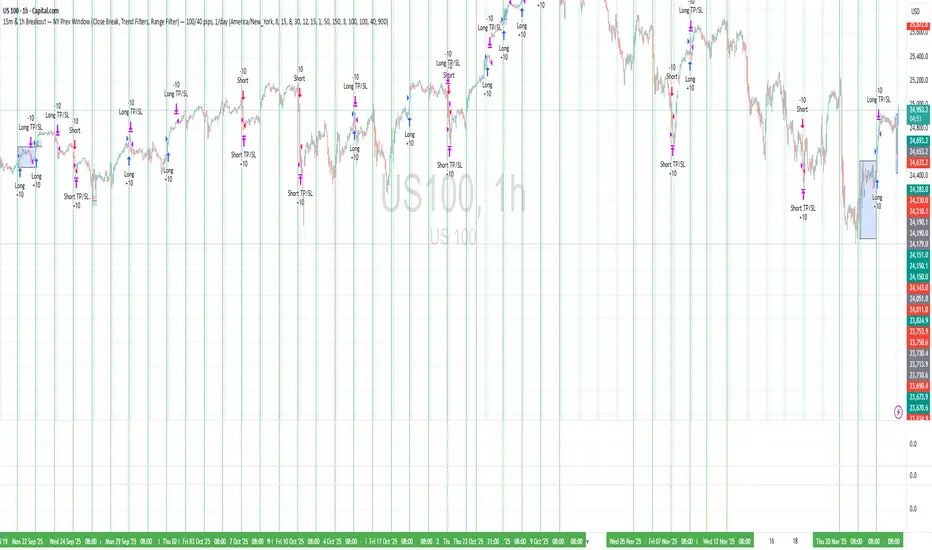
15m & 1h Breakout — NY Prev Window Define a session anchored at 09:15 New York time, adjusted safely around weekends.
For each new session, store the high and low of the previous session’s 09:15→09:15 window.
During a configurable entry window (default: 09:30–11:15 NY time), watch for close-based breakouts:
Long when price closes above the previous window high + buffer.
Short when price closes below the previous window low − buffer.
Take exactly one trade per session, with fixed TP/SL in pips, and optional:
EMA trend filters for longs and shorts.
Range (volatility) filter on the previous window.
Option to skip Thursdays.
The strategy is designed mainly for intraday timeframes (e.g. 15m / 1h), but the logic is timeframe-agnostic.


4H Confirmation + 1H SFP BOS Retest4H Confirmation + 1H Entry (SFP + BOS + Retest)Run it on 1H
Uses 4H EMAs for higher-timeframe direction (confirmation)
Uses 1H SFP + BOS + retest + RSI for entries
This gives you more trades, still guided by the 4H trend

stormytrading orb botshows entries for 15m orb based on 5m break and retest made solely for mnq or nq, works good with smt
shows trades for ldn, nyc, nyc overlap and Asia session, pls follow stormy trading on insta for more


HMA+RVOL Strategy Hariss 369The Hull Moving Average (HMA) is a smooth, fast, and highly responsive moving average created by Alan Hull. It reduces lag significantly while still maintaining smoothness, making it one of the most popular tools for trend detection and entries. It is widely used for trend filter. Hull Moving Average(HMA) with RVOL strengthens the trend as volume is prime factor of price movement.
Trading with HMA: Simple method is buy when price closes above HMA , stop less below the low of last candle and target is 1.5 or 2 times of stop loss. The reverse is for sell. The HMA automatically turns to green on bull trend and red on bear trend for better visual confirmation.
Adding RVOL to HMA is better method of trading. Buy signal is initiated when price closes above HMA and RVOL is greater than 1.2. Sell signal is initiated when price closes below 89 HMA and rovl is greater than 1.2. One can change the value of RVOL according to trading style and type asset being traded.
It is a back tested strategy.


yangwen1.0This script is an initial concept of mine. I attempted to use the 5-minute chart as ticks for catching bottoms and picking tops, but it's unable to avoid whipsaws. I've tested many methods to evade whipsaws, but they ultimately result in poor entry points, causing me to miss the bottoms and tops of price swings. I sincerely hope someone with better approaches can discuss this with me. Thank you.
