3-Candle Reversal Pattern-vahid2star3-Candle Reversal Zones + Hammer Confirmation (with Risk Management & Alerts)
This script combines 3-candle reversal detection, hammer confirmations, and smart demand/supply zone plotting into a single tool designed for both discretionary and automated traders.
🔍 Core Logic
3-Candle Reversal Pattern
Candle-1: Strong move in one direction (big body).
Candle-2: Doji-like candle (high shadow/body ratio).
Candle-3: Reversal candle in the opposite direction (large body relative to Candle-2).
A gap after Candle-3 is required for extra confirmation.
Hammer Confirmation (Hammer-1 & Hammer-2)
After a valid 3-candle setup, the script searches for a hammer pattern near the zone.
Hammer-1: Draws a box directly on the hammer range if followed by a strong confirming candle.
Hammer-2: If another hammer forms after the confirmation candle and holds for N bars (configurable), a second hammer box is drawn.
Demand & Supply Zones
For bullish setups, a demand zone is created from the Candle-2 low to the Candle-1 low.
For bearish setups, a supply zone is created from the Candle-2 high to the Candle-1 high.
Zones extend to the right until price interacts with them.
🛠 Filters & Quality Controls
Trend filter (optional):
Only draw zones if price respects higher-timeframe EMA200 slope and LTF EMA alignment.
Market structure filter:
Require higher-high / higher-low (for bullish) or lower-high / lower-low (for bearish).
ATR filter:
Zones must have a minimum height relative to ATR.
Overlap control:
Avoid drawing zones that overlap too heavily with existing ones.
Cooldown:
Restrict consecutive zones of the same type within a user-defined bar distance.
🎯 Risk Management & Strategy
Dynamic position sizing:
Trade size is automatically calculated from account equity, risk %, and leverage.
Stop-loss & Take-profit:
SL placed just beyond the zone ± buffer ticks.
TP automatically set at user-defined Reward:Risk ratio (e.g., 3:1).
Capital protection:
Trades respect max leverage and risk per position settings.
⚡ Alerts
The script provides one-time alerts for each zone:
🔔 First Touch Alert → Triggered when price first touches a demand, supply, or hammer box.
Each zone only fires one alert, avoiding duplicates on re-touch or trade exit.
📊 Visuals
Demand zones: Green boxes.
Supply zones: Red boxes.
Hammer boxes: Blue (bullish) / Orange (bearish).
Used zones: Greyed out after price fills them.
Outcomes: Zones change to green if TP is hit, red if SL is hit.
Optional labels mark “Bullish zone ✓”, “Bearish zone ✓”, “Hammer-1 ✓”, or “Hammer-2 ✓” when confirmed.
🔧 Settings Overview
Core pattern ratios (C1/C2, C3/C2 size multipliers).
Doji definition (shadow/body ratio).
Hammer search depth, confirmation delay, and strictness.
Risk % per trade, leverage cap, stop buffer, RR ratio.
Visual styling (colors, max box count, labels).
Trend, structure, ATR, overlap, and cooldown filters.
Option to disable orders (use as indicator + alerts only).
⚠️ Disclaimer
This script is a technical analysis tool intended for educational purposes.
It does not guarantee profits. Use proper risk management and test thoroughly before applying in live trading.
✨ With its combination of 3-candle reversals, hammer confirmations, and smart filtering, this script is designed to reduce noise, highlight high-probability zones, and give traders both visual structure and actionable alerts.
Indicators and strategies

Liquidity Sweep Breakout - LSBLiquidity Sweep Breakout - LSB
A professional session-based breakout system designed for OANDA:USDJPY and other JPY pairs.
Not guesswork, but precision - built on detailed observation of institutional moves to capture clear trade direction daily.
Master the Market’s Daily Bank Flow.
---
Strategy Detail:
I discovered this strategy after carefully studying how Japanese banks influence the forex market during their daily settlement period. Banks are some of the biggest players in the financial world, and when they adjust or settle their accounts in the morning, it often creates a push in the market. From years of observation, I noticed a consistent pattern, once banks finish their settlements, the market usually continues moving in the same direction that was formed right after those actions. This daily banking flow often sets the tone for the entire trading session, especially for JPY pairs like USDJPY.
To capture this move, I built the indicator so that it follows the bank-driven trend with clear rules for entries, stop-loss (SL), and take-profit (TP). The system is designed with professional risk management in mind. By default, it assumes a $10,000 account size, risks only 1% of that balance per trade, and targets a 1:1.5 reward-to-risk ratio. This means for every $100 risked, the potential profit is $150. Such controlled risk makes the system safer and more sustainable for long-term traders. At the same time, users are not limited to this setup, they can adjust the account balance in the settings, and the indicator will automatically recalculate the lot size and risk levels based on their own capital. This ensures the strategy works for small accounts and larger accounts alike.
🌍 Why It Works
Fundamentally driven: Based on **daily Japanese banking settlement flows**.
Session-specific precision: Targets the exact window when USDJPY liquidity reshapes.
Risk-managed: Always calculates lot size based on account and risk preferences.
Automatable: With webhook + MT5 EA, it can be fully hands-free.
---
✅ Recommended
Pair: USDJPY (best observed behavior).
Timeframe: 3-Minute chart.
Platform: TradingView Premium (for webhooks).
Execution: MT5 via EA.
---
🔎 Strategy Concept
The Tokyo Magic Breakout (TMB) is built on years of session observation and the unique daily rhythm of the Japanese banking system.
Every morning between 5:50 AM – 6:10 AM PKT (09:50 – 10:10 JST), Japanese banks perform daily reconciliation and settlement. This often sets the tone for the USDJPY direction of the day.
This strategy isolates that critical moment of liquidity adjustment and waits for a clean breakout confirmation. Instead of chasing noise, it executes only when price action is aligned with the Tokyo market’s hidden flows.
---
🕒 Timing Logic
Session Start: 5:00 AM PKT (Tokyo market open range).
Magic Candle: The 5:54 AM PKT candle is marked as the reference “breakout selector.”
Checkpoints: First confirmation at 6:30 AM PKT, then every 15 minutes until 8:30 AM PKT.
* If price stays inside the magic range → wait.
* If a breakout happens but the candle wick touches the range → wait for the next checkpoint.
* If by 8:30 AM PKT no clean breakout occurs → the day is marked as No Trade Day (NTD).
👉 Recommended timeframe: 3-Minute chart (3M) for precise signals.
---
📈 Trade Execution
Entry: Clean break above/below the magic candle’s range.
Stop-Loss: Opposite side of the Tokyo session high/low.
Take-Profit: Calculated by Reward\:Risk ratio (default 1.5:1).
Lot Size: Auto-calculated based on your risk model:
* Fixed Dollar
* % of Equity
* Conservative (minimum of both).
Visuals include:
✅ Entry/SL/TP lines
✅ Shaded risk (red) and reward (green) zones
✅ Trade labels (Buy/Sell with lot size & levels)
✅ TP/SL hit markers
---
🔔 Alerts & Automation (AutoTMB)
This strategy is fully automation-ready with EA + MT5:
1. Enable alerts in TMB settings.
2. Insert your PineConnector License Key.
3. Configure your risk management preferences.
4. Create a TradingView alert → in the message box simply type:
Pine Script®
{{alert_message}}
and set the EA webhook.
Now, every breakout trade (with exact entry, SL, TP, and lot size) is sent instantly.
👉 On your MT5:
* Install the EA.
* Use the same license key.
* Run it on a VPS or local MT5 terminal.
You now have a hands-free trading system: AutoTMB.

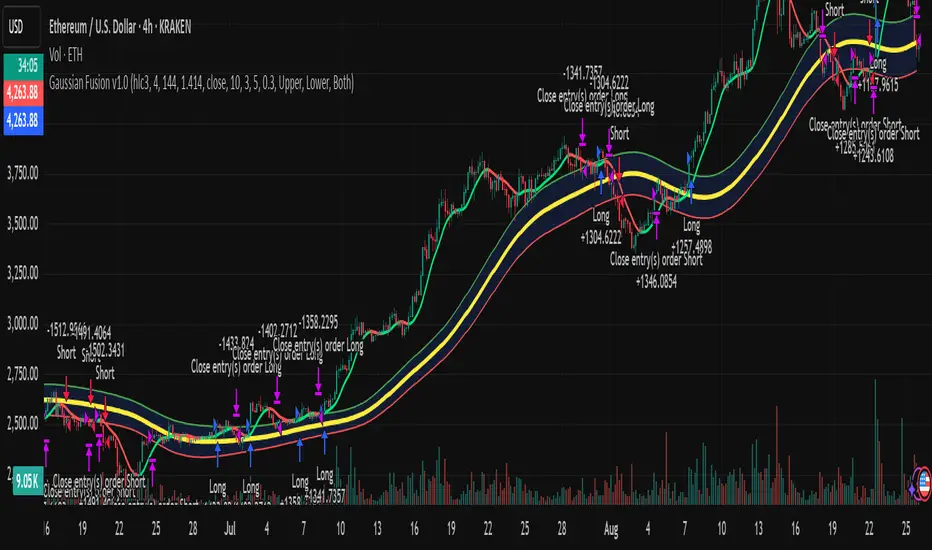
Gaussian Fusion v1.0A versatile trading framework that blends Gaussian channel dynamics with a smoothing filter to capture directional moves with clarity.
Highlights:
Dual-band logic for flexible signal generation
Adaptive confirmation layer to reduce noise
Designed as a balance between trend capture and noise reduction, this strategy adapts to shifting market conditions while keeping the logic simple and practical.
EMA 1/8 Cross - Fixed Pip TP/SLEMA 1/8 Cross – Fixed Pip TP/SL
This strategy is based on the crossover between EMA 8 and EMA 14 as trading signals:
Long entry → when EMA 1 crosses above EMA 8
Short entry → when EMA 1 crosses below EMA 8
Features:
Fixed pip Take Profit (TP) and Stop Loss (SL), fully adjustable in the settings.
Customizable EMA Fast/Slow lengths for optimization.
Pip size input to match different broker definitions (e.g., XAUUSD often uses 0.10 as one pip).
Suitable for testing scalping or swing trading across multiple timeframes.
⚠️ Disclaimer:
This script is intended for backtesting and educational purposes only. Please optimize parameters and apply proper risk management before using it on live accounts.

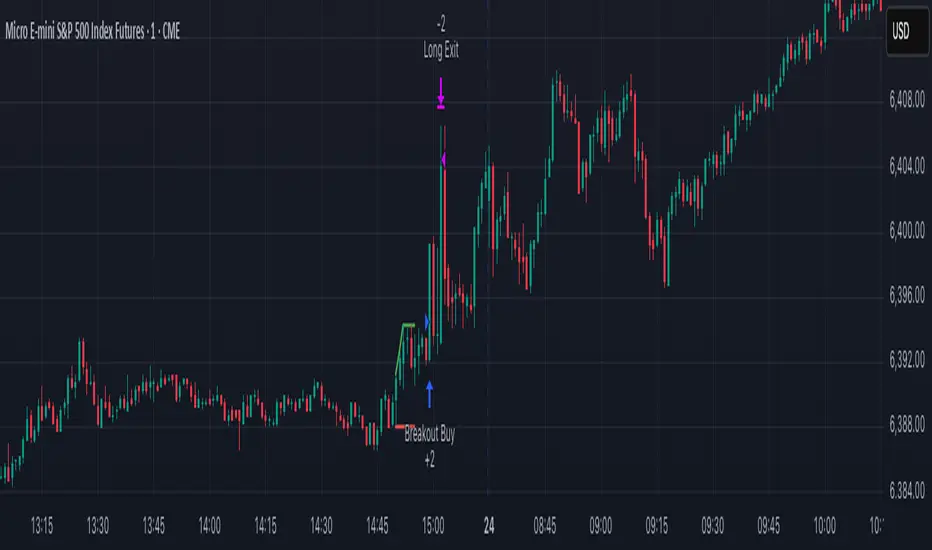
22:50 Breakout StrategyBreakout range near the close of the day
We age getting 5 min range near the close of the day and buy or sell breaking this range
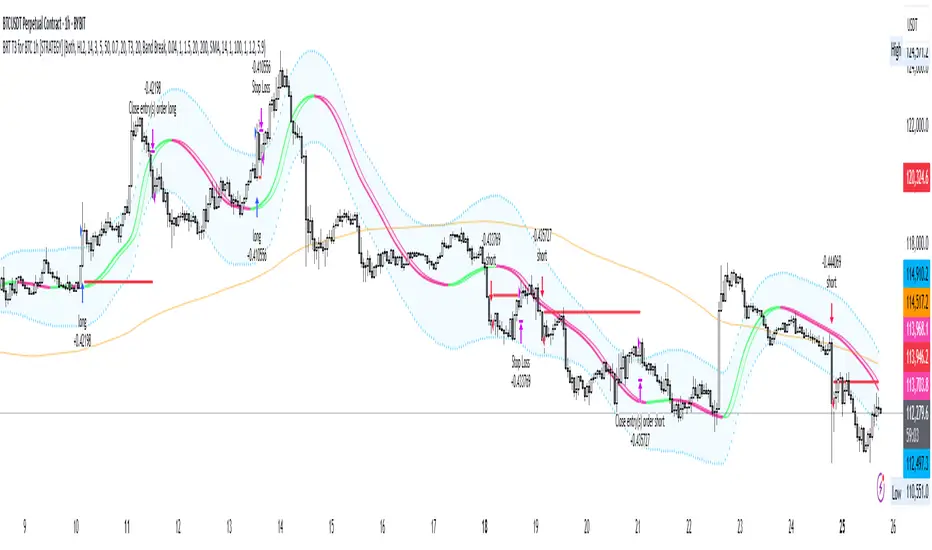
BRT T3 for BTC 1h [STRATEGY]## 📊 BRT T3 Adaptive Strategy for BTC 1H
STRATEGY DESCRIPTION
Professional trading strategy based on the adaptive T3 (Tillson T3) indicator with dynamic length controlled by the Relative Strength Index (RSI) . The strategy is specifically designed for Bitcoin trading on the hourly timeframe and includes a comprehensive filter system to minimize false signals.
═════════════════════════════════════════
🔥 UNIQUE CODE FEATURES
1. RSI-Adaptive Architecture:
• Innovative Approach: Unlike standard MA strategies with fixed periods, our code dynamically adjusts the moving average length based on RSI
• Smart Formula: len = minLen + (maxLen - minLen) * (1 - RSI/100) - automatically accelerates response in extreme zones
• Result: Strategy adapts to market conditions without manual reconfiguration
2. Modified Ichimoku Cloud:
• Unique Calculation: Instead of classic high/low, uses ATR-based method
• Dynamic Levels: Cloud is built based on volatility, not fixed periods
• Advantage: More accurate trend determination in highly volatile cryptocurrency markets
3. Hybrid Signal System:
• Dual-mode Generation: Switch between classic MA crossovers and volatility band breakouts
• Multi-stage Confirmation: Optional signal verification across N forward bars
• Effect: 40-60% reduction in false signals compared to simple MA strategies
4. All-in-One Solution:
• 8 MA Types in One Code: The only strategy on TradingView with complete implementation of T3, EMA, SMA, WMA, VWMA, HMA, RMA, DEMA
• Custom Functions: All MAs calculated through custom functions supporting series int
• Versatility: One code replaces 8 different strategies
5. Intelligent Filtering:
Combination of 4 independent filters:
├── Volume Filter (dynamic multiplier)
├── Trend Filter (adaptive period)
├── ATR Filter (volatility)
└── Ichimoku Filter (cloud trend)
• Unique Logic: Each filter can work independently or in combination
• Master Switch: Single control for all filters
6. Advanced Risk Management:
• Smart Stops: SL/TP levels are stored in variables and not recalculated on every bar
• Slippage Protection: Checks both close and high/low for stop triggers
• Visualization: Dynamic display of levels only for active positions
7. Performance Optimization:
• Efficient Loops: Minimized calculations through intermediate result storage
• Conditional Visualization: Element rendering only when necessary
• Clean Code: Structured organization with clear logical block separation
═════════════════════════════════════════
💎 TECHNICAL INNOVATIONS
Adaptation Algorithm (exclusive development):
// Dynamic length based on RSI
rsi_scale = 1.0 - rsi / 100.0
len_adaptive = minLen + (maxLen - minLen) * rsi_scale
ATR-based Ichimoku (unique modification):
// Instead of classic (highest + lowest) / 2
// Using ATR for dynamic levels
upper := close < upper ? min(hl2 + atr*mult, upper ) : hl2 + atr*mult
lower := close > lower ? max(hl2 - atr*mult, lower ) : hl2 - atr*mult
Multi-MA Architecture (complete implementation):
• Each MA type has its own optimized function
• Support for series int for dynamic length
• Unified selection interface via switch statement
═════════════════════════════════════════
🎯 KEY FEATURES
• Adaptive System: Moving average length automatically adjusts based on RSI, providing quick response in trending movements and stability in sideways markets
• 8 Moving Average Types: T3, EMA, SMA, WMA, VWMA, HMA, RMA, DEMA - ability to choose the optimal type for different market conditions
• Multi-level Filtering:
- Volume Filter - signal confirmation with increased activity
- Trend Filter - trading in the direction of the main trend
- ATR Filter - accounting for market volatility
- Ichimoku Cloud - additional trend direction confirmation
• Professional Risk Management: Customizable stop-loss and take-profit levels
═════════════════════════════════════════
⚙️ HOW IT WORKS
1. Signal Generation:
• Original Mode: Classic MA crossover signals with lagged version
• Band Break Mode: Volatility band breakouts (based on standard deviation)
2. RSI Adaptation:
• High RSI (overbought) → uses short MA length for quick response
• Low RSI (oversold) → uses long MA for noise smoothing
• Adaptation range is configured by Min/Max length parameters
3. Filter System:
• Each filter can be enabled/disabled independently
• Signal is generated only when passing all active filters
• Ichimoku filter blocks counter-trend trades
═════════════════════════════════════════
📈 STRATEGY PARAMETERS
Main Settings:
• Strategy Type: Long Only / Short Only / Both
• Data Source: Close, Open, High, Low, HL2, HLC3, OHLC4
RSI Settings:
• RSI Length: Calculation period (default 14)
• RSI Smoothing: Smoothing to reduce noise
T3/MA Settings:
• Min/Max Length: Adaptive length range (5-50)
• Volume Factor: T3 smoothing coefficient (0.7)
• MA Type: Moving average type selection
Filters:
• Volume Filter: Volume multiplier (1.5x average)
• Trend Filter: Trend MA period (200)
• ATR Filter: Minimum volatility for entry
• Ichimoku Filter: Cloud for trend determination
Risk Management:
• Stop Loss: Percentage from entry price (1.2%)
• Take Profit: Percentage from entry price (5.9%)
• Position Size: 50,000 USDT (effective leverage 5x)
═════════════════════════════════════════
💡 USAGE RECOMMENDATIONS
Optimal Conditions:
• Timeframe: 1H (developed and optimized)
• Instrument: BTC/USDT and other liquid cryptocurrencies
• Market Conditions: Trending and moderately volatile markets
Customize to Your Style:
1. Conservative: Increase signal confirmation period, enable all filters
2. Aggressive: Reduce filters, use Band Break mode
3. Scalping: Decrease Min/Max length, disable trend filter
═════════════════════════════════════════
📊 VISUALIZATION
Strategy displays:
• Main MA Line - changes color depending on direction
• Lag Line - for visualizing crossover moment
• Volatility Bands - upper and lower boundaries
• Trend MA - orange line (200 periods)
• SL/TP Levels - red and green lines for open positions
═════════════════════════════════════════
🔔 ALERTS
Strategy supports alert configuration for:
• Long position entry signals
• Short position entry signals
• Position exit signals
• Ichimoku line crossings
═════════════════════════════════════════
⚠️ RISK WARNING
IMPORTANT NOTICE: Trading in financial markets involves substantial risk of capital loss. Past performance presented in this strategy is based solely on historical data and under no circumstances constitutes a guarantee of future returns.
The strategy author is not responsible for:
• Any direct or indirect financial losses resulting from the use of this strategy
• Trading decisions made based on strategy signals
• Interpretation of backtesting results as a forecast of future performance
This strategy is provided exclusively for educational and research purposes. Backtesting results are affected by numerous factors including but not limited to: slippage, spread, commissions, market liquidity, and technical failures.
Before using the strategy in live trading:
• Conduct your own testing on a demo account
• Ensure understanding of all parameters and logic
• Only use funds you can afford to lose
• Consider consulting with a qualified financial advisor
DISCLAIMER: By using this strategy, you acknowledge and accept all risks associated with financial market trading and confirm that the author does not provide investment advice and bears no fiduciary responsibility to users.
═════════════════════════════════════════
🛠 TECHNICAL SUPPORT
For questions about setup and optimization:
• Leave comments under the publication
• Follow strategy updates
• Study the code for deep understanding of logic
═════════════════════════════════════════
📝 VERSION AND UPDATES
Version: 1.0.0
Pine Script: v6
Last Updated: 2025
Changelog:
• Added support for 8 MA types
• Integrated Ichimoku Cloud filter
• Optimized risk management system
• Improved signal visualization
═════════════════════════════════════════
© 2025 BRT Trading Systems
Strategy is protected by copyright. Commercial use without author's permission is prohibited.
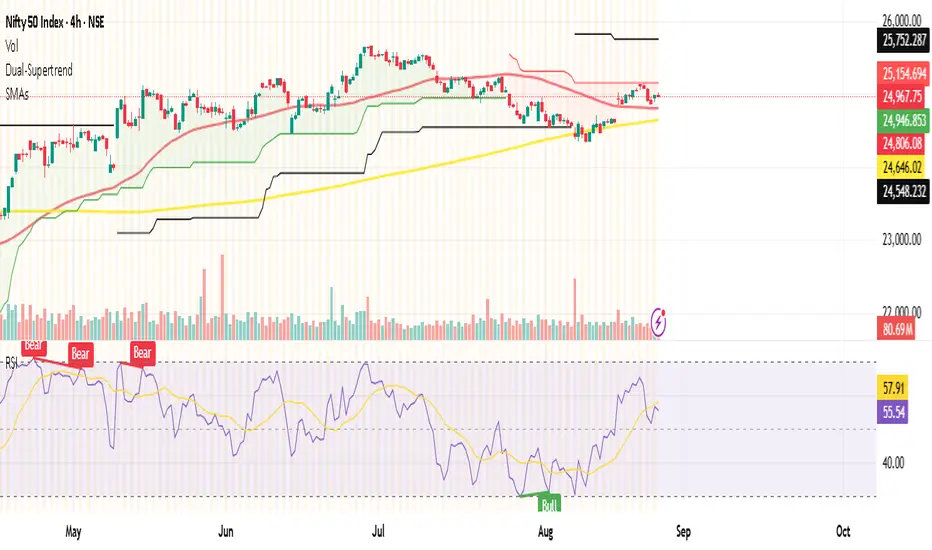
Advanced Supertrend ADX Strategy with Highest ReturnOverview
This sophisticated trading strategy combines the proven Supertrend indicator with advanced momentum filters and trend strength analysis to identify high-probability long entries in trending markets.
Key Features
✅ Supertrend-Based Signals: Uses optimized ATR calculations for reliable trend detection
✅ Advanced Momentum Filtering: Multiple proprietary momentum filters ensure entry quality
✅ Trend Strength Validation: ADX-based confirmation prevents false signals in weak trends
✅ Intelligent Risk Management: Dynamic stop-loss system based on price action
✅ Visual Stop Loss Indicators: Clear visual representation of risk levels
How It Works
The strategy enters long positions when:
Supertrend indicator confirms bullish trend reversal
Proprietary momentum conditions align for optimal entry timing
Trend strength exceeds minimum threshold (ADX > 20)
Multiple timeframe momentum filters confirm signal quality
Ideal For
Trending markets (stocks, forex, crypto, indices)
Swing trading timeframes (15m to 4H work best)
Traders seeking systematic, rule-based entries
Risk-conscious traders wanting clear stop levels
Settings
ATR Period: Adjustable for different volatility environments (default: 10)
Supertrend Factor: Fine-tune sensitivity (default: 3.0)
ADX Parameters: Customize trend strength requirements
Performance Notes
Long-only strategy optimized for uptrending markets
Works best in trending conditions, may underperform in choppy markets
Designed for systematic execution with clear entry/exit rules
Disclaimer
Past performance does not guarantee future results. Always use proper risk management and position sizing appropriate for your account size. This is just for education purpose only and not recomanded for trading in s

Signalgo Strategy ISignalgo Strategy I: Technical Overview
Signalgo Strategy I is a systematically engineered TradingView strategy script designed to automate, test, and manage trend-following trades using multi-timeframe price/volume logic, volatility-based targets, and multi-layered exit management. This summary covers its operational structure, user inputs, entry and exit methodology, unique technical features, and practical application.
Core Logic and Workflow
Multi-Timeframe Data Synthesis
User-Defined Timeframe: The user chooses a timeframe (e.g., 1H, 4H, 1D, etc.), on which all strategy signals are based.
Cross-Timeframe Inputs: The strategy imports closing price, volume, and Average True Range (ATR) for the selected interval, independently from the chart’s native timeframe, enabling robust multi-timeframe analysis.
Price Change & Volume Ratio: It calculates the percent change of price per bar and computes a volume ratio by comparing current volume to its 20-bar moving average—enabling detection of true “event” moves vs. normal market noise.
Hype Filtering
Anti-Hype Mechanism: An entry is automatically filtered out if abnormal high volume occurs without corresponding price movement, commonly observed during manipulation or announcement periods. This helps isolate genuine market-driven momentum.
User Inputs
Select Timeframe: Choose which interval drives signal generation.
Backtest Start Date: Specify from which date historical signals are included in the strategy (for precise backtests).
Take-Profit/Stop-Loss Configuration: Internally, risk levels are set as multiples of ATR and allow for three discrete profit targets.
Entry Logic
Trade Signal Criteria:
Price change magnitude in the current bar must exceed a fixed sensitivity threshold.
Volume for the bar must be significantly elevated compared to average, indicating meaningful participation.
Anti-hype check must not be triggered.
Bullish/Bearish Determination: If all conditions are met and price change direction is positive, a long signal triggers. If negative, a short signal triggers.
Signal Debouncing: Ensures a signal triggers only when a new condition emerges, avoiding duplicate entries on flat or choppy bars.
State Management: The script tracks whether an active long or short is open to avoid overlapping entries and to facilitate clean reversals.
Exit Strategy
Take-Profits: Three distinct profit targets (TP1, TP2, TP3) are calculated as fixed multiples of the ATR-based stop loss, adapting dynamically to volatility.
Reversals: If a buy signal appears while a short is open (or vice versa), the existing trade is closed and reversed in a single step.
Time-Based Exit: If, 49 bars after entry, the trade is in-profit but hasn’t reached TP1, it exits to avoid stagnation risk.
Adverse Move Exit: The position is force-closed if it suffers a 10% reversal from entry, acting as a catastrophic stop.
Visual Feedback: Each TP/SL/exit is plotted as a clear, color-coded line on the chart; no hidden logic is used.
Alerts: Built-in TradingView alert conditions allow automated notification for both entries and strategic exits.
Distinguishing Features vs. Traditional MA Strategies
Event-Based, Not Just Slope-Based: While classic moving average strategies enter trades on MA crossovers or slope changes, Signalgo Strategy I demands high-magnitude price and volume confirmation on the chosen timeframe.
Volume Filtering: Very few MA strategies independently filter for meaningful volume spikes.
Real Market Event Focus: The anti-hype filter differentiates organic market trends from manipulated “high-volume, no-move” sessions.
Three-Layer Exit Logic: Instead of a single trailing stop or fixed RR, this script manages three profit targets, time-based closures, and hard adverse thresholds.
Multi-Timeframe, Not Chart-Dependent: The “main” analytical interval can be set independently from the current chart, allowing for in-depth cross-timeframe backtests and system runs.
Reversal Handling: Automatic handling of signal reversals closes and flips positions precisely, reducing slippage and manual error.
Persistent State Tracking: Maintains variables tracking entry price, trade status, and target/stop levels independently of chart context.
Trading Application
Strategy Sandbox: Designed for robust backtesting, allowing users to simulate performance across historical data for any major asset or interval.
Active Risk Management: Trades are consistently managed for both fixed interval “stall” and significant loss, not just via trailing stops or fixed-day closes.
Alert Driven: Can power algorithmic trading bots or notify discretionary traders the moment a qualifying market event occurs.

AltCoin & MemeCoin Index Correlation [Eddie_Bitcoin]🧠 Philosophy of the Strategy
The AltCoin & MemeCoin Index Correlation Strategy by Eddie_Bitcoin is a carefully engineered trend-following system built specifically for the highly volatile and sentiment-driven world of altcoins and memecoins.
This strategy recognizes that crypto markets—especially niche sectors like memecoins—are not only influenced by individual price action but also by the relative strength or weakness of their broader sector. Hence, it attempts to improve the reliability of trading signals by requiring alignment between a specific coin’s trend and its sector-wide index trend.
Rather than treating each crypto asset in isolation, this strategy dynamically incorporates real-time dominance metrics from custom indices (OTHERS.D and MEME.D) and combines them with local price action through dual exponential moving average (EMA) crossovers. Only when both the asset and its sector are moving in the same direction does it allow for trade entries—making it a confluence-based system rather than a single-signal strategy.
It supports risk-aware capital allocation, partial exits, configurable stop loss and take profit levels, and a scalable equity-compounding model.
✅ Why did I choose OTHERS.D and MEME.D as reference indices?
I selected OTHERS.D and MEME.D because they offer a sector-focused view of crypto market dynamics, especially relevant when trading altcoins and memecoins.
🔹 OTHERS.D tracks the market dominance of all cryptocurrencies outside the top 10 by market cap.
This excludes not only BTC and ETH, but also major stablecoins like USDT and USDC, making it a cleaner indicator of risk appetite across true altcoins.
🔹 This is particularly useful for detecting "Altcoin Season"—periods where capital rotates away from Bitcoin and flows into smaller-cap coins.
A rising OTHERS.D often signals the start of broader altcoin rallies.
🔹 MEME.D, on the other hand, captures the speculative behavior of memecoin segments, which are often driven by retail hype and social media activity.
It's perfect for timing momentum shifts in high-risk, high-reward tokens.
By using these indices, the strategy aligns entries with broader sector trends, filtering out noise and increasing the probability of catching true directional moves, especially in phases of capital rotation and altcoin risk-on behavior.
📐 How It Works — Core Logic and Execution Model
At its heart, this strategy employs dual EMA crossover detection—one pair for the asset being traded and one pair for the selected market index.
A trade is only executed when both EMA crossovers agree on the direction. For example:
Long Entry: Coin's fast EMA > slow EMA and Index's fast EMA > slow EMA
Short Entry: Coin's fast EMA < slow EMA and Index's fast EMA < slow EMA
You can disable the index filter and trade solely based on the asset’s trend just to make a comparison and see if improves a classic EMA crossover strategy.
Additionally, the strategy includes:
- Adaptive position sizing, based on fixed capital or current equity (compound mode)
- Take Profit and Stop Loss in percentage terms
- Smart partial exits when trend momentum fades
- Date filtering for precise backtesting over specific timeframes
- Real-time performance stats, equity tracking, and visual cues on chart
⚙️ Parameters & Customization
🔁 EMA Settings
Each EMA pair is customizable:
Coin Fast EMA: Default = 47
Coin Slow EMA: Default = 50
Index Fast EMA: Default = 47
Index Slow EMA: Default = 50
These control the sensitivity of the trend detection. A wider spread gives smoother, slower entries; a narrower spread makes it more responsive.
🧭 Index Reference
The correlation mechanism uses CryptoCap sector dominance indexes:
OTHERS.D: Dominance of all coins EXCLUDING Top 10 ones
MEME.D: Dominance of all Meme coins
These are dynamically calculated using:
OTHERS_D = OTHERS_cap / TOTAL_cap * 100
MEME_D = MEME_cap / TOTAL_cap * 100
You can select:
Reference Index: OTHERS.D or MEME.D
Or disable the index reference completely (Don't Use Index Reference)
💰 Position Sizing & Risk Management
Two capital allocation models are supported:
- Fixed % of initial capital (default)
- Compound profits, which scales positions as equity grows
Settings:
- Compound profits?: true/false
- % of equity: Between 1% and 200% (default = 10%)
This is critical for users who want to balance growth with risk.
🎯 Take Profit / Stop Loss
Customizable thresholds determine automatic exits:
- TakeProfit: Default = 99999 (disabled)
- StopLoss: Default = 5 (%)
These exits are percentage-based and operate off the entry price vs. current close.
📉 Trend Weakening Exit (Scale Out)
If the position is in profit but the trend weakens (e.g., EMA color signals trend loss), the strategy can partially close a configurable portion of the position:
- Scale Position on Weak Trend?: true/false
- Scaled Percentage: % to close (default = 65%)
This feature is useful for preserving profits without exiting completely.
📆 Date Filter
Useful for segmenting performance over specific timeframes (e.g., bull vs bear markets):
- Filter Date Range of Backtest: ON/OFF
- Start Date and End Date: Custom time range
OTHER PARAMETERS EXPLANATION (Strategy "Properties" Tab):
- Initial Capital is set to 100 USD
- Commission is set to 0.055% (The ones I have on Bybit)
- Slippage is set to 3 ticks
- Margin (short and long) are set to 0.001% to avoid "overspending" your initial capital allocation
📊 Visual Feedback and Debug Tools
📈 EMA Trend Visualization
The slow EMA line is dynamically color-coded to visually display the alignment between the asset trend and the index trend:
Lime: Coin and index both bullish
Teal: Only coin bullish
Maroon: Only index bullish
Red: Both bearish
This allows for immediate visual confirmation of current trend strength.
💬 Real-Time PnL Labels
When a trade closes, a label shows:
Previous trade return in % (first value is the effective PL)
Green background for profit, Red for losses.
📑 Summary Table Overlay
This table appears in a corner of the chart (user-defined) and shows live performance data including:
Trade direction (yellow long, purple short)
Emojis: 💚 for current profit, 😡 for current loss
Total number of trades
Win rate
Max drawdown
Duration in days
Current trade profit/loss (absolute and %)
Cumulative PnL (absolute and %)
APR (Annualized Percentage Return)
Each metric is color-coded:
Green for strong results
Yellow/orange for average
Red/maroon for poor performance
You can select where this appears:
Top Left
Top Right
Bottom Left
Bottom Right (default)
📚 Interpretation of Key Metrics
Equity Multiplier: How many times initial capital has grown (e.g., “1.75x”)
Net Profit: Total gains including open positions
Max Drawdown: Largest peak-to-valley drop in strategy equity
APR: Annualized return calculated based on equity growth and days elapsed
Win Rate: % of profitable trades
PnL %: Percentage profit on the most recent trade
🧠 Advanced Logic & Safety Features
🛑 “Don’t Re-Enter” Filter
If a trade is closed due to StopLoss without a confirmed reversal, the strategy avoids re-entering in that same direction until conditions improve. This prevents false reversals and repetitive losses in sideways markets.
🧷 Equity Protection
No new trades are initiated if equity falls below initial_capital / 30. This avoids overleveraging or continuing to trade when capital preservation is critical.
Keep in mind that past results in no way guarantee future performance.
Eddie Bitcoin


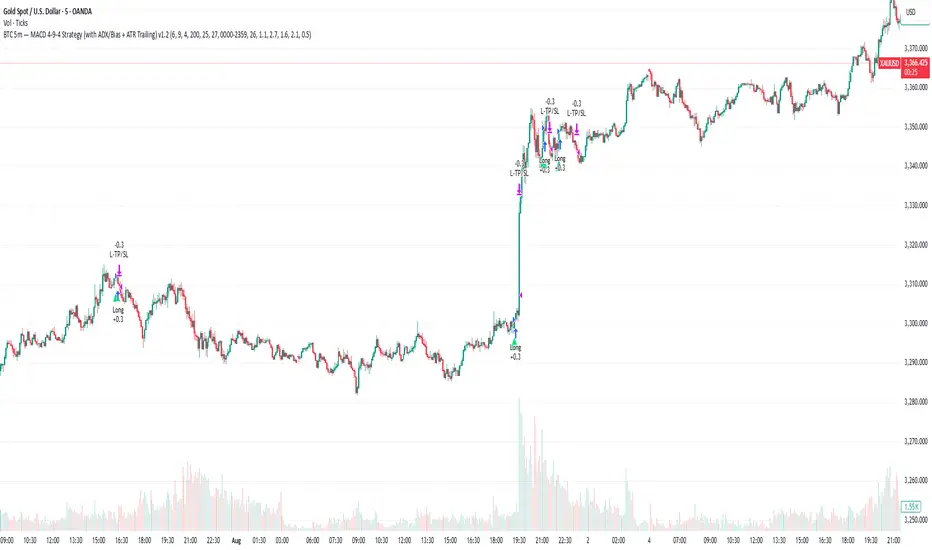
Gold 5m — MACD 694 Strategy (with ADX/Bias + ATR Trailing)This is my sustain gold trade for trading gold 5m TF
MACD StrategyOverview
The "MACD Strategy" is a straightforward trading strategy tested for BTCUSDT Futures on the 1-minute timeframe, leveraging the Moving Average Convergence Divergence (MACD) indicator to identify momentum-based buy and sell opportunities. Developed with input from expert trading analyst insights, this strategy combines technical precision with risk management, making it suitable for traders of all levels on platforms like TradingView. It focuses on capturing trend reversals and momentum shifts, with clear visual cues and automated alerts for seamless integration with trading bots (e.g., Bitget webhooks).
#### How It Works
This strategy uses the MACD indicator to generate trading signals based on momentum and trend direction:
- **Buy Signal**: Triggered when the MACD line crosses above the signal line, and the MACD histogram turns positive (above zero). This suggests increasing bullish momentum.
- **Sell Signal**: Triggered when the MACD line crosses below the signal line, and the MACD histogram turns negative (below zero), indicating growing bearish momentum.
Once a signal is detected, the strategy opens a position (long for buy, short for sell) with a position size calculated based on your risk tolerance. It includes a stop-loss to limit losses and a take-profit to lock in gains, both dynamically adjusted using the Average True Range (ATR) for adaptability to market volatility.
#### Key Features
- **MACD-Based Signals**: Relies solely on MACD for entry points, plotted in a separate pane for clear momentum analysis.
- **Risk Management**: Automatically calculates position size based on a percentage of your account balance and sets stop-loss and take-profit levels using ATR multipliers and a risk:reward ratio.
- **Visual Feedback**: Plots entry, stop-loss, and take-profit lines on the chart with labeled markers for easy tracking.
- **Alerts**: Includes Bitget webhook-compatible alerts for automated trading, notifying you of buy and sell signals in real-time.
#### Input Parameters
- **Account Balance**: Default 10000 – Set your initial trading capital to determine position sizing.
- **MACD Fast Length**: Default 12 – The short-term EMA period for MACD sensitivity.
- **MACD Slow Length**: Default 26 – The long-term EMA period for MACD calculation.
- **MACD Signal Length**: Default 9 – The smoothing period for the signal line.
- **Risk Per Trade (%)**: Default 3.0 – The percentage of your account balance risked per trade (e.g., 3% of 10000 = 300).
- **Risk:Reward Ratio**: Default 3.0 – The ratio of potential profit to risk (e.g., 3:1 means risking 1 to gain 3).
- **SL Multiplier**: Default 1.0 – Multiplies ATR to set the stop-loss distance (e.g., 1.0 x ATR).
- **TP Multiplier**: Default 3.0 – Multiplies ATR to set the take-profit distance, adjusted by the risk:reward ratio.
- **Line Length (bars)**: Default 25 – Duration in bars for displaying trade lines on the chart.
- **Label Position**: Default 'left' – Position of text labels (left or right) relative to trade lines.
- **ATR Period**: Default 14 – The number of periods for calculating ATR to measure volatility.
#### How to Use
1. **Add to Chart**: Load the "MACD Strategy" as a strategy and the "MACD Indicator" as a separate indicator on your TradingView chart (recommended for BTCUSDT Futures on the 1-minute timeframe).
2. **Customize Settings**: Adjust the input parameters based on your risk tolerance and market conditions. For BTCUSDT Futures, consider reducing `Risk Per Trade (%)` during high volatility (e.g., 1%) or increasing `SL Multiplier` for wider stops.
3. **Visual Analysis**: Watch the main chart for trade entry lines (green for buy, red for sell), stop-loss (red), and take-profit (green) lines with labels. Use the MACD pane below to confirm momentum shifts.
4. **Set Alerts**: Create alerts in TradingView for "Buy Signal" and "Sell Signal" to automate trades via Bitget webhooks.
5. **Backtest and Optimize**: Test the strategy on historical BTCUSDT Futures 1-minute data to fine-tune parameters. The short timeframe requires quick execution, so monitor closely for slippage or latency.
#### Tips for Success
- **Market Conditions**: This strategy performs best in trending markets on the 1-minute timeframe. Avoid choppy conditions where MACD crossovers may produce false signals.
- **Risk Management**: Start with the default 3% risk per trade and adjust downward (e.g., 1%) during volatile periods like BTCUSDT news events. The 3:1 risk:reward ratio targets consistent profitability.
- **Timeframe**: Optimized for 1-minute charts; switch to 5-minute or 15-minute for less noise if needed.
- **Confirmation**: Cross-check MACD signals with price action or support/resistance levels for higher accuracy on BTCUSDT Futures.
#### Limitations
- This strategy relies solely on MACD, so it may lag in fast-moving or sideways markets. Consider adding a secondary filter (e.g., RSI) if needed.
- Stop-loss and take-profit are ATR-based and may need adjustment for BTCUSDT Futures’ high volatility, especially during leverage trading.
#### Conclusion
The "MACD Strategy" offers a simple yet effective way to trade momentum shifts using the MACD indicator, tested for BTCUSDT Futures on the 1-minute timeframe, with robust risk management and visual tools. Whether you’re scalping crypto futures or exploring short-term trends, this strategy provides a solid foundation for automated or manual trading. Share your feedback or customizations in the comments, and happy trading!

ETH/BTC/XRP Strategy - Powered by BCHETH/BTC/XRP Strategy — Cross-Asset Momentum-Based Strategy
Overview
This strategy aims to identify medium-term long trade opportunities on ETH/BTC/XRP 2 or 4 hour charts by leveraging cross-asset momentum signals from Bitcoin Cash (BCH) relative to Ethereum (ETH). It integrates volatility filters, volume validation, and momentum confirmations to improve trade timing and risk management.
Key Features and Logic
Cross-Asset Momentum Filter: Enters long trades when BCH outperforms ETH in the prior candle, supporting relative strength confirmation.
Volume Confirmation: BCH volume must exceed 135% of its 20-period average, validating market interest before entry signals.
Volatility Filter: ETH price near or below 110% of the lower Bollinger Band (20 periods, 2σ) indicates oversold conditions.
Momentum Indicators: ETH RSI below 70 ensures the asset is not overbought, coupled with BCH MACD line crossing above its signal line for bullish bias.
Risk Controls: Includes trailing stop losses and take profit targets to protect gains and limit drawdowns.
Timing Constraints: Controlled cooldown periods between trades help prevent overtrading and false signals.
Usage Recommendations
Optimized for 2 or 4hour ETH/BTC/XRP USDT candles; 5-minute data optionally used for finer entries and exits.
Suitable for traders seeking dynamic timing based on multi-asset interactions rather than blind holding.
Works as a complement within diversified or rotational strategies focusing on Ethereum exposure.
Performance Summary (Backtest Jan 2023 – Jul 2025) ; ETHUSDT 2hour basis.
Total trades: 65
Win rate: 61.5%
Profit factor: 5.1
Note: The sample size is limited; results should be interpreted with caution. Past performance is not indicative of future results.
Important Notes
This script represents an original combination of cross-asset momentum with volatility and volume filters tailored to ETH and BCH interaction.
Source code is protected to safeguard unique implementation details while allowing free usage without restrictions.
Use appropriate risk management, and consider these signals as part of a broader trading analysis.
No guarantees on profitability; trading involves significant risk.

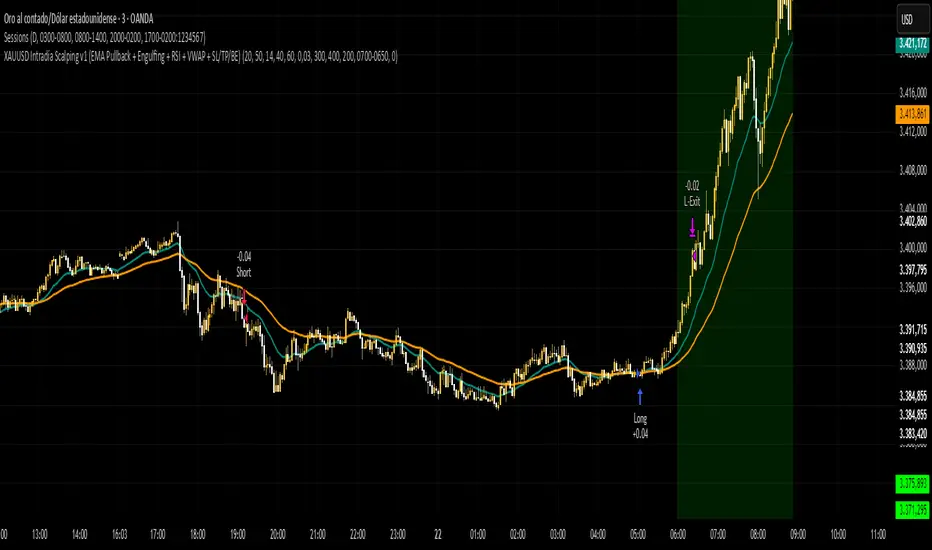
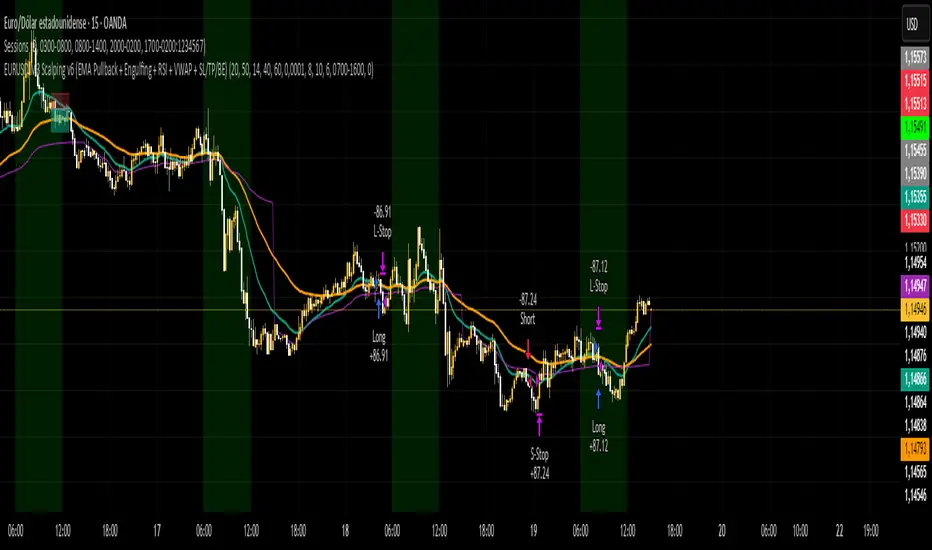
Estrategy EURUSD M3 Scalping Estrategia para operar el EURUSD en temp de 3 min, indica sl y tp 6 pips sl y 10 pips tp
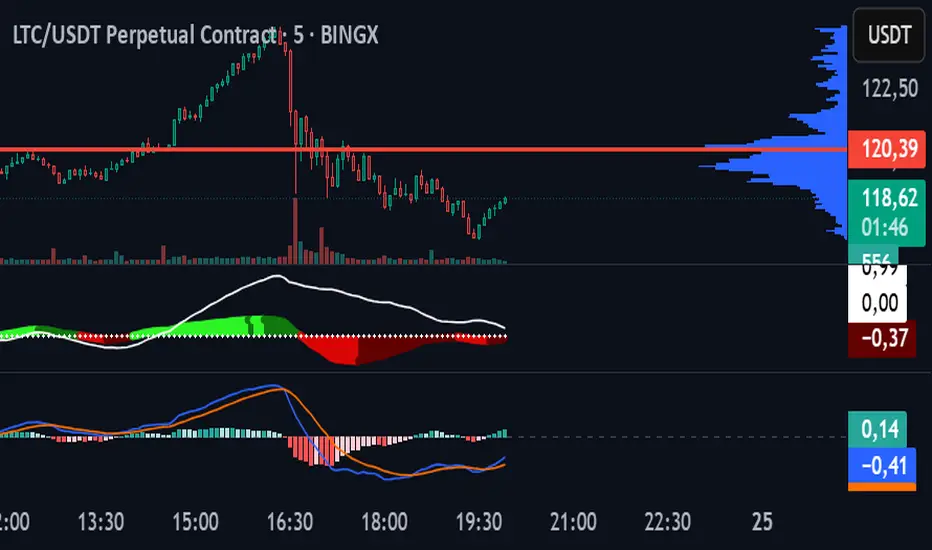
MACDEMAAutomatic Strategy for Litecoin on 5-Minute Chart in BingX Perpetual Futures. Combines MACD and 10- & 55-Period EMA. ✅
JeropasMG v17This bot uses a martingale strategy applied to simple moving average crossover signals.
When a buy or sell signal is generated, it opens a position with the configured base size.
If the trade is a loser, the bot increases the size of the next entry by multiplying it by the defined factor (for example, x2), repeating the process until the maximum number of steps allowed is reached.

HMK-2 | PCA-1 + Rejim + Chebyshev + VWAP (Input'lu, v6)📌 HMK-2 | PCA-1 + Regime + Chebyshev + VWAP Strategy
1️⃣ Core Structure
Instead of relying on a single indicator, this system uses the Z-Score normalized average of three oscillators (RSI, MFI, ROC).
Signal (PCA-1):
RSI(14), MFI(14), ROC(5) → each is converted into a z-score.
Their average becomes the “composite signal,” our PCA-1 value.
Trend direction: If the Z-score EMA is rising → trend UP. If falling → trend DOWN.
2️⃣ Side Filters
Regime Filter (ADX + EMA)
ADX is calculated manually.
If ADX > 20 → trend exists → a 50-period EMA of this value smooths it.
This turns “trend regime” into a probability between 0–1.
Chebyshev Filter
A return series is checked against mean ± k*sigma bands.
If the return is within this band → valid signal. Extreme moves are filtered out.
VWAP Filter
Long trades: price must be above VWAP.
Short trades: price must be below VWAP.
Trades are only taken on the correct side of institutional cost averages.
3️⃣ Entry Conditions
Long:
PCA-1 signal crosses above threshold.
Trend Up + Regime OK + Chebyshev OK + Above VWAP.
Short:
PCA-1 signal crosses below threshold.
Trend Down + Regime OK + Chebyshev OK + Below VWAP.
4️⃣ Exit Mechanism
Main Exit: ATR-based stop/target.
Stop = entry price – ATR × (SL factor).
Take profit = entry price + ATR × (TP factor).
Additional Exit:
If price crosses to the opposite side of VWAP.
If PCA-1 signal crosses zero.
👉 Prevents trades from being locked, makes exits adaptive.
5️⃣ Labels / Visualization
AL / SHORT → entry points.
SAT / COVER → exit points.
VWAP line plotted in blue.
🧩 Strategy Features
Optimizable parameters:
Z-window (zWin)
Threshold
Chebyshev factor
ATR stop/target multipliers
This system works with:
Disciplined core (PCA-1 signal)
Triple protection (Regime + Chebyshev + VWAP)
Adaptive exits (ATR + VWAP/signal cross)
👉 Not a “single-indicator robot,” but a multi-filtered trade direction engine.
💡 Final Note
This is a base model of the system — open for further development.
I’ve shared the logic to give you a roadmap.
If you spot errors, fix them → that’s how you’ll improve it.
Don’t waste time asking me questions — refine and build it better yourselves.
Wishing you profitable trades. Stay well 🙏

Twin Range Filter StrategyClarity Over Confusion: See price action through a全新的 lens. Watch as erratic, choppy movements are smoothed into a clear, actionable trajectory. The path of least resistance becomes obvious.
Confidence Over Hesitation: Receive high-probability entry and exit signals with a proven logic that waits for the market to commit before you do. No more second-guessing.
Discipline Over Emotion: Our algorithm enforces a systematic approach, helping you avoid emotional FOMO chasing and panic selling. Stick to the plan and execute with precision.
What Can You Expect?
Dynamic Adaptability: Unlike static indicators, continuously adapts to volatility. It widens its filter in turbulent markets to avoid whipsaws and tightens it in trending markets to capture more of the move.
The Power of Two: By synthesizing data from two distinct market perspectives, it confirms strength and filters out weakness, providing a confluence that standalone indicators simply cannot match.
Clean, Unambiguous Signals: We’ve eliminated the clutter. The software provides clear visual alerts (Green Arrows for Long, Red Arrows for Short) right on your chart, telling you exactly when the equilibrium has shifted.
Who is this for?
Swing Traders looking to capture the heart of a trend and avoid false breakouts.
Day Traders needing a reliable filter to navigate volatile intraday action.
Systematic Traders seeking a robust logic layer to add to their automated strategy.
Anyone overwhelmed by indicator overload and craving a single, trusted source of truth on their chart

Lunar calendar day Crypto Trading StrategyLunar calendar day Crypto Trading Strategy
This strategy explores the potential impact of the lunar calendar on cryptocurrency price cycles.
It implements a simple but unconventional rule:
Buy on the 5th day of each lunar month
Sell on the 26th day of the lunar month
No trades between January 1 (solar) and Lunar New Year’s Day (holiday buffer period)
Research background
Several academic studies have investigated the influence of lunar cycles on financial markets. Their findings suggest:
Returns tend to be higher around the full moon compared to the new moon.
Periods between the full moon and the waning phase often show stronger average returns than the waxing phase.
This strategy combines those observations into a practical implementation by testing fixed entry (lunar day 5) and exit (lunar day 26) points, while excluding the transition period from solar New Year to Lunar New Year, effectively capturing mid-month lunar effects.
How it works
The script includes a custom lunar date calculation function, reconstructing lunar months and days for each year (2020–2026).
On lunar day 5, the strategy opens a long position with 100% of equity.
On lunar day 26, the strategy closes the position.
No trades are executed between Jan 1 and Lunar New Year’s Day.
All trades include:
Commission: 0.1%
Slippage: 3 ticks
Position sizing uses the entire equity (100%) for simplicity, but this is not recommended for live trading.
Why this is original
Unlike mashups of built-in indicators, this script:
Implements a full lunar calendar system inside Pine Script.
Translates academic findings on lunar effects into an applied backtest.
Adds a realistic trading filter (holiday gap) based on cultural/seasonal calendar rules.
Provides researchers and traders with a framework to explore non-traditional, time-based signals.
Notes
This is an experimental, research-oriented strategy, not financial advice.
Results are highly dependent on the chosen period (2020–2026).
Using 100% equity per trade is for simplification only and is not a viable money management practice.
The purpose is to investigate whether cyclical patterns linked to lunar time can provide any statistical edge in ETHUSDT.
