KZ One — Scalping Training StrategyKZ One is a scalping strategy developed for M1 and M5 timeframes. It is designed to help traders study and practice short-term market behavior by using structured zones to highlight potential entry and exit areas. The strategy allows customization of Risk (USD) and Take Profit (R multiple) parameters for flexible trade management. Additional tools include ATR-based filters to skip low-volatility conditions and a Pre-Alert Lead (bars) option that notifies users ahead of possible setups. KZ One is intended for educational and analytical purposes, promoting disciplined and consistent trading practice.
Indicators and strategies

BUY LOW, BUY MORE, SELL HIGH -BUFFET STRATEGY LITE__________________________________________________________________________
Buy Low, Buy More, Sell High With Buffett Meter (LITE – JTMarketAI)
__________________________________________________________________________
Category: Quantitative Momentum & Liquidity Flow
Author: JTMarketAI
Architecture: Non-Repainting
This strategy accumulates into validated pullbacks during fear cycles, scales intelligently as price declines into liquidity support, and exits when momentum weakens after meaningful run-ups. It uses synthetic higher-timeframe OHLC data (non-repainting), liquidity imbalance confirmation, adaptive KAMA trend logic, RSI validation, and a live Buffett macro valuation gauge.
This is a patient, conviction-based accumulation engine designed for equities.
It is not a scalp bot.
__________________________________________________________________________
Core Features
__________________________________________________________________________
Non-repainting (confirmed bars only)
Synthetic HTF OHLC (no lookahead)
Dynamic trailing exit preserves ~80–87% of peak profit
Bull vs Bear liquidity dominance and flow imbalance
Rolling lowest-low tracking (LLL)
NY-session alignment (default)
Buffett Macro Meter integration
Technical Highlights
Flow-confidence derived from volume-order pressure
Adaptive KAMA smoothing for lower-lag confirmation
Daily > Weekly > Monthly synthetic aggregation
LLL progression display for trend exhaustion
Fully profiler-optimized
Supports averaging down when pyramiding enabled
__________________________________________________________________________
Why It Does Not Repaint
__________________________________________________________________________
All state updates occur only on confirmed bars
Synthetic HTFs built without lookahead
Persistent arrays freeze historical values
Trailing highs updated only after confirmation
No forward-reference to future bars
__________________________________________________________________________
Lite Edition Notes
__________________________________________________________________________
Manual trading focused
Buffett Meter enabled
Up to 20 trades per session
Visual dashboard included
No alerts, automation, or webhooks (PRO unlocks IBKR + TradersPost)
__________________________________________________________________________
Limitations
__________________________________________________________________________
Best on intraday equities (1m–4h)
Designed for US stocks only
High-resource if full visuals enabled
Avoid penny stocks and extremely low-volume tickers
Does not guard against after-hours gaps or major news moves
__________________________________________________________________________
Warnings
__________________________________________________________________________
Contrarian scaling requires discipline and patience
Expect longer-duration trades, not rapid scalps
Use on quality tickers unlikely to permanently collapse
Confirm price behavior outside cash session
Test manually before automating anything
Not suitable for every market environment or asset
Notes on Philosophy
This strategy attempts to accumulate when markets overshoot lower, and distribute after recovery momentum fades. It reflects a patient, value-driven approach built on the principle of buying fear and reducing exposure into strength.
__________________________________________________________________________
Disclaimer
__________________________________________________________________________
For research and educational use only. Not financial advice. Past performance does not guarantee future results. Test thoroughly and use appropriate risk management.
__________________________________________________________________________
Hashtags
__________________________________________________________________________
#buffett #quantstrategy #valuemomentum #accumulation #contrarian #nonrepaint #equitystrategy #swingtrading #liquidityanalysis #synthetichtf #tradingviewstrategy

HEK Dinamik Fiyat Kanalı Stratejisi v1HEK Dynamic Price Channel Strategy
Concept
The HEK Dynamic Price Channel provides a channel structure that expands and contracts according to price momentum and time-based equilibrium.
Unlike fixed-band systems, it evaluates the interaction between price and its balance line through an adaptive channel width that dynamically adjusts to changing market conditions.
How It Works
When the price reacts to the midline, the channel bands automatically reposition themselves.
Touching the upper band indicates a strengthening trend, while touching the lower band signals weakening momentum.
This adaptive mechanism helps filter out false signals during sudden directional changes, enhancing overall signal quality.
Advantages
✅ Maintains trend continuity while avoiding overtrading.
✅ Automatically adapts to changing volatility conditions.
✅ Detects early signals of short- and mid-term trend reversals.
Applications
Directional confirmation in spot and futures markets.
A supporting tool in channel breakout strategies.
Identifying price consolidation and equilibrium zones.
Note
This strategy is intended for educational and research purposes only.
It should not be considered financial advice. Always consult a professional financial advisor before making investment decisions.
© HEK — Adaptive Channel Approach on Dynamic Market Structures
6 gün önce
Sürüm Notları
HEK Dynamic Price Channel Strategy
Concept
The HEK Dynamic Price Channel provides a channel structure that expands and contracts according to price momentum and time-based equilibrium.
Unlike fixed-band systems, it evaluates the interaction between price and its balance line through an adaptive channel width that dynamically adjusts to changing market conditions.
How It Works
When the price reacts to the midline, the channel bands automatically reposition themselves.
Touching the upper band indicates a strengthening trend, while touching the lower band signals weakening momentum.
This adaptive mechanism helps filter out false signals during sudden directional changes, enhancing overall signal quality.
Advantages
✅ Maintains trend continuity while avoiding overtrading.
✅ Automatically adapts to changing volatility conditions.
✅ Detects early signals of short- and mid-term trend reversals.
Applications
Directional confirmation in spot and futures markets.
A supporting tool in channel breakout strategies.
Identifying price consolidation and equilibrium zones.
Note
This strategy is intended for educational and research purposes only.
It should not be considered financial advice. Always consult a professional financial advisor before making investment decisions.
© HEK — Adaptive Channel Approach on Dynamic Market Structures

BUY LOW, BUY MORE, SELL HIGH - MARKET FLOW STRATEGY LITE
TV Description - Buffett Meter Lite
body{font-family:Arial,Helvetica,sans-serif;max-width:900px;margin:32px auto;line-height:1.4} h1,h2{margin:16px 0 8px}
Buy Low, Buy More, Sell High With Buffett Meter (Lite v1283 – JTM)
Category: Quantitative Momentum & Liquidity Flow
Author: JTM
Architecture: Non-Repainting
This strategy accumulates into validated pullbacks during fear cycles, scales intelligently as price declines into liquidity support, and exits when momentum weakens after meaningful run-ups. It uses synthetic higher-timeframe OHLC data (non-repainting), liquidity imbalance confirmation, adaptive KAMA trend logic, RSI validation, and a live Buffett macro valuation gauge.
This is a patient, conviction-based accumulation engine designed for equities.
It is not a scalp bot.
Core Features
Non-repainting (confirmed bars only)
Synthetic HTF OHLC (no lookahead)
Dynamic trailing exit preserves ~80–87% of peak profit
Bull vs Bear liquidity dominance and flow imbalance
Rolling lowest-low tracking (LLL)
NY-session alignment (default)
Buffett Macro Meter integration
Technical Highlights
Flow-confidence derived from volume-order pressure
Adaptive KAMA smoothing for lower-lag confirmation
Daily > Weekly > Monthly synthetic aggregation
LLL progression display for trend exhaustion
Fully profiler-optimized
Supports averaging down when pyramiding enabled
Why It Does Not Repaint
All state updates occur only on confirmed bars
Synthetic HTFs built without lookahead
Persistent arrays freeze historical values
Trailing highs updated only after confirmation
No forward-reference to future bars
Lite Edition Notes
Manual trading focused
Buffett Meter enabled
Limit of 20 trades per session
Buffet Meter dashboard included
No alerts, automation, or webhooks (PRO unlocks IBKR + TradersPost)
Limitations
Best on intraday equities (1m–4h)
Designed for US stocks only
High-resource if full visuals enabled
Avoid penny stocks and extremely low-volume tickers
Does not guard against after-hours gaps or major news moves
Warnings
Contrarian scaling requires discipline and patience
Expect longer-duration trades, not rapid scalps
Use on quality tickers unlikely to permanently collapse
Confirm price behavior outside cash session
Test manually before automating anything
Not suitable for every market environment or asset
Notes on Philosophy
This strategy attempts to accumulate when markets overshoot lower, and distribute after recovery momentum fades. It reflects a patient, value-driven approach built on the principle of buying fear and reducing exposure into strength.
This is edge-based, not “trade every wiggle” logic
“Be fearful when others are greedy, and greedy when others are fearful.” — Buffett
“The stock market transfers money from the impatient to the patient.” — Buffett
Disclaimer
For research and educational use only. Not financial advice. Past performance does not guarantee future results. Test thoroughly and use appropriate risk management.
Hashtags
#buffett #quantstrategy #valuemomentum #accumulation #contrarian #nonrepaint #equitystrategy #swingtrading #liquidityanalysis #synthetichtf #tradingviewstrategy

Vandan V2Vandan V2 is an automated trading strategy for NQ1! (E-mini Nasdaq-100) based on short-term mean reversion with dynamic risk control. It combines volatility filters and overbought/oversold signals to capture local market imbalances.
Backtested from 2015 to 2025, it achieved a +730% total return, Profit Factor of 1.40, max drawdown of only 1.61%, and over 106,000 trades. Designed for systematic scalping or intraday arbitrage with a limit of 3 simultaneous contracts.

TMB Invest - Smart Money Concept StrategyEnglish:
**Quick Overview**
The "TMB_SMC_Strategy_v1.1.3" combines a classic trend filter using two EMAs with contrarian RSI entries and simple SMC elements (Fair Value Gaps & Order Blocks). Stop-loss and take-profit orders are volatility-adaptive and controlled via the ATR. An integrated dashboard displays the setup status, stop-loss/take-profit levels, entry reference, and trend, RSI, and ATR values.
---
## Operating Principle
1. **Trend Filter:** A fast EMA (default 50) is compared to a slow EMA (default 200). Trading occurs only in the direction of the trend: long in uptrends, short in downtrends.
2. **Timing via RSI:** Contrarian entries within the trend. Go long when the RSI is below a buy level (default 40); Short when the RSI is above a sell level (standard 60).
3. **Structure Check (SMC Proxy):** An "FVG Touch" serves as additional confirmation that an inefficient price zone has been tested. Order blocks are visualized for guidance but are not a direct entry trigger.
4. **Risk Management via ATR:** Stop-loss and take-profit levels are set as multipliers of the current ATR (e.g., SL = 1×ATR, TP = 2×ATR). This allows target and risk distances to adjust to market volatility.
5. **Simple Position Logic:** Only one position is held at a time (no pyramiding). After entry, stop and limit orders (bracket exit) are automatically placed.
---
## Input Values
* **EMA Fast / EMA Slow:** Lengths of the moving averages for the trend filter.
* **RSI Length / Levels:** Length of the RSI as well as buy and sell thresholds (contra signals within the trend direction).
* **Take Profit (RR) / Stop Loss (RR):** ATR multipliers for TP and SL.
* **Show FVGs & Order Blocks:** Toggles the visual SMC elements (zones/boxes) on or off.
--
## Signals & Execution
* **Long Setup:** Uptrend (fast EMA above slow EMA) **and** RSI below the buy level **and** a current FVG signal in a bullish direction.
* **Short Setup:** Downtrend (fast EMA below slow EMA) **and** RSI above the sell level **and** a current FVG touch in a bearish direction.
* **Entry & Exit:** If the setup is met, the market is entered; stop-loss/take-profit orders are placed immediately according to ATR multiples.
--
## Visualization
* **EMAs:** The fast and slow EMAs are plotted to illustrate the trend.
* **FVGs:** Fair Value Gaps are drawn as semi-transparent boxes in the trend color and projected slightly into the future.
* **Order Blocks:** Potential order block zones from the previous candle are visually highlighted (for informational purposes only).
---
## Integrated Dashboard
A compact table dashboard (bottom left) displays:
* Current **Setup Status** (Long/Short active, Long/Short ready, No Setup),
* **Stop-Loss**, **Take-Profit**, and **Entry Reference**,
* **Trend Status** (Bull/Bear/Sideways),
* **RSI Value**, and **ATR Value**.
Active long/short positions are highlighted in color (green/red).
--
## Practical Guide
1. **Place on Chart** and select the desired timeframe.
2. **Calibrate Parameters** (EMA lengths, RSI levels, ATR multipliers) to match the market and timeframe.
3. **Backtest** across different market phases; prioritize robustness over maximum curve fit.
4. **Fine-Tuning:**
* Shorter EMAs are often useful intraday (e.g., 20/100 or 34/144).
* Adjust RSI levels to market characteristics (45/55 for aggressive trading, 30/70 for conservative trading).
* Increase or decrease ATR multipliers depending on volatility/trading style.
--
## Notes, Limitations & Extensions
* **FVG Definition:** The FVG detection used here is intentionally simplified. Those who prefer a more rigorous approach can switch to a 3-candle definition and fill levels.
* **Order Blocks:** These primarily serve as a guide. Integration into entry/exit logic (e.g., retests) is possible as an extension.
* **Backtest Realism:** Fills may differ from the displayed closing price. For greater accuracy, intrabar backtests or an entry indicator based on the average position price are conceivable.
* **Alerts:** Currently, no alert conditions are defined; these can be added for long/short setups and status messages.
* **Position Management:** By default, no scaling is performed. Partial sales, trailing stops, or multiple entries can be added.
---
## Purpose & Benefits
The strategy offers a clear, modular framework: trend filter (direction), RSI contra timing (entry), SMC proxy via FVG Touch (structure), and ATR-based exits (risk adaptation). This makes it robust, easy to understand, and highly extensible—both for discretionary traders who appreciate visual SMC elements and for systematic testers who prefer a clean, parameterizable foundation.

WIN1! • Crossing EMAs• (By Mesquita, v7)Moving average crossover strategy for intraday movements, especially in the continuous index (WIN1!) on the Brazilian stock exchange B³. The strategy is customizable for time windows, has a filter for trades only above the long-term average, whether only long, only short, or both, with or without stop loss.

NY ORB - Full Dynamic SystemNY ORB - Full Dynamic Strategy Summary
1. Opening Range and Session Timing
Opening Range (ORB) Calculation: The strategy identifies the ORB High and ORB Low by tracking the highest high and lowest low during the specified New York pre-market window, which is set by default from 8:30 to 8:45 (New York time).
Entry Window: Trading activity is restricted to a specific entry period, typically starting shortly after the ORB is established (default: 8:50 to 12:00).
Hard Exit Time: Any remaining open positions are automatically closed at a fixed exit time (default: 13:25).
2. Trade Entry Logic and Filters
An entry (Long or Short) is generated when the price breaks out of the established ORB, provided it passes a series of optional filters:
Direction Control: The user can restrict the strategy to trade Long Only, Short Only, or Both.
Second Breakout Logic: An optional filter that requires the price to break out, reverse back into the range, and then break out again, confirming momentum after a consolidation.
Confirmation Candle Count: An optional filter that checks the close of a previous candle (e.g., 1 or 2 candles ago) to ensure the price was still inside the range, preventing premature entry.
Technical Filters (Optional): The entry is only executed if it aligns with selected indicators:
RSI: Filters for non-overbought (Long) or non-oversold (Short) conditions.
MACD: Requires the MACD line to be above/below the Signal line for alignment.
VWAP: Requires the price to be above/below the Volume-Weighted Average Price.
Trend Filter (SMMA): Requires the price to be above/below a 50-period Simple Moving Average.
3. Dynamic Risk and Exit Management
This strategy features highly configurable stop-loss and profit-taking mechanics:
Primary Stop Loss Methods: The Stop Loss distance can be dynamically chosen from four types:
Fixed: A fixed number of ticks.
ATR: Based on a multiple of the Average True Range (ATR).
Capped ATR: ATR-based, but with a hard maximum tick limit.
OR-Based: Based on a multiple of the actual ORB High-to-Low range.
Dynamic Profit Target: The Take Profit level is calculated dynamically based on a multiplier of either the ATR or the ORB Range.
Breakeven Stop:
If enabled, the Stop Loss automatically moves to the entry price (Breakeven) once the price moves a predetermined distance in the profitable direction.
An Adaptive Breakeven option allows the trigger distance to be calculated as a percentage of the overall ATR Profit Target.
Trailing Stop: The strategy uses a trailing stop, which can be custom-set (fixed ticks) or dynamically tied to the ATR. An optional feature Auto Tighten Trailing reduces the trailing multiplier once the breakeven level is hit.
MA Cross Exit: An alternative, counter-trend exit mechanism that closes the trade if the price crosses back over the chosen Moving Average (either SMMA or VWAP), overriding the pending profit target.
4. Daily Account Management
The strategy includes crucial daily risk controls to protect capital and lock in profits:
Daily Profit Limit: If the total daily PnL (realized and unrealized) hits a predefined maximum profit threshold (in ticks), all trades are closed, and new entries are blocked for the remainder of the trading day.
Daily Loss Limit: Conversely, if the total daily PnL hits a predefined maximum loss threshold, all trades are closed, and new entries are blocked for the remainder of the day.

Tristan's Tri-band StrategyTristan's Tri-band Strategy - Confluence Trading System
Strategy Overview:
This strategy combines three powerful technical indicators - RSI, Williams %R, and Bollinger Bands - into a single visual trading system. Instead of cluttering your chart with separate indicator panels, all signals are displayed directly on the price chart using color-coded gradient overlays, making it easy to spot high-probability trade setups at a glance.
How It Works:
The strategy identifies trading opportunities when multiple indicators align (confluence), suggesting strong momentum shifts:
📈 Long Entry Signals:
RSI drops to 30 or below (oversold)
Williams %R reaches -80 to -100 range (oversold)
Price touches or breaks below the lower Bollinger Band
All three conditions must align during your selected trading session
📉 Short Entry Signals:
RSI rises to 70 or above (overbought)
Williams %R reaches 0 to -20 range (overbought)
Price touches or breaks above the upper Bollinger Band
All three conditions must align during your selected trading session
Visual Indicators:
(faint) Green gradients below candles = Bullish oversold conditions (buying opportunity)
(faint) Red/Orange gradients above candles = Bearish overbought conditions (selling opportunity)
Stacked/brighter gradients = Multiple indicators confirming the same signal (higher probability) will stack and show brighter / less faint
Blue Bollinger Bands = Volatility boundaries and mean reversion zones
Exit Strategy:
Long trades exit when price reaches the upper Bollinger Band OR RSI becomes overbought (≥70)
Short trades exit when price reaches the lower Bollinger Band OR RSI becomes oversold (≤30)
Key Features:
✅ Session Filters - Trade only during NY (9:30 AM-4 PM), London (3 AM-11:30 AM), or Asia (7 PM-1 AM EST) sessions
✅ No Repainting - Signals are confirmed on candle close for realistic backtesting and live trading
✅ Customizable Parameters - Adjust RSI levels, BB standard deviations, Williams %R periods, and gradient visibility
✅ Visual Clarity - See all three indicators at once without switching between panels
✅ Built-in Alerts - Get notified when entry and exit conditions are met
How to Use Effectively:
Choose Your Trading Session - For day trading US stocks, enable only the NY session. For forex or 24-hour markets, select the sessions that match your schedule.
Look for Gradient Stacking - The brightest, most visible gradients occur when both RSI and Williams %R signal together. These are your highest-probability setups.
Confirm with Price Action - Wait for the candle to close before entering. The strategy enters on the next bar's open to prevent repainting.
Respect the Bollinger Bands - Entries occur at the outer bands (price extremes), and exits occur at the opposite band or when momentum reverses.
Backtest First - Test the strategy on your preferred instruments and timeframes. Works best on liquid assets with clear trends and mean reversion patterns (stocks, major forex pairs, indices).
Adjust Gradient Visibility - Use the "Gradient Strength" slider (lower = more visible) to make signals stand out on your chart style.
Best Timeframes: 5-minute to 1-hour charts for intraday trading; 4-hour to daily for swing trading (I have also found the 3 hour timeframe to work really well for some stocks / ETFs.)
Best Markets: Liquid instruments with volatility - SPY, QQQ, major stocks, EUR/USD, GBP/USD, major indices
Risk Management: This is a mean reversion strategy that works best in ranging or choppy markets. In strong trends, signals may appear less frequently. Always use proper position sizing and stop losses based on your risk tolerance.
----------------------------------------------
Note: Past performance does not guarantee future results. This strategy is provided for educational purposes. Always backtest thoroughly and practice proper risk management before live trading.RetryClaude can make mistakes. Please double-check responses. Sonnet 4.5

NY VIX Channel Trend US Futures Day Trade StrategyNY VIX Channel Trend Strategy
Summary in one paragraph
Session anchored intraday strategy for index futures such as ES and NQ on one to fifteen minute charts. It acts only after the first configurable window of New York Regular Trading Hours and uses a VIX derived daily implied move to form a realistic channel from the session open. Originality comes from using a pure implied volatility yardstick as portable support and resistance, then committing in the direction of the first window close relative to the open. Add it to a clean chart and trade the simple visuals. For conservative alerts use on bar close.
Scope and intent
• Markets. Index futures ES and NQ
• Timeframes. One to thirty minutes
• Default demo. ES1 on five minutes
• Purpose. Provide a portable intraday yardstick for entries and exits without curve fitting
• Limits. This is a strategy. Orders are simulated on standard candles
Originality and usefulness
• Unique concept. A VIX only channel anchored at 09:30 New York plus a single window trend test
• Addresses. False urgency at session open and unrealistic bands from arbitrary multipliers
• Testability. Every input is visible and the channel is plotted so users can audit behavior
• Portable yardstick. Daily implied move equals VIX percent divided by square root of two hundred fifty two
• Protected status. None. Method and use are fully disclosed
Method overview in plain language
Take the daily VIX or VIX9D value, convert it to a daily fraction by dividing by square root of two hundred fifty two, then anchor a symmetric channel at the New York session open. Observe the first N minutes. If that window closes above the open the bias is long. If it closes below the open the bias is short. One trade per session. Exits occur at the channel boundary or at a bracket based on a user selected VIX factor. Positions are closed a set number of minutes before the session ends.
Base measures
Return basis. The daily implied move unit equals VIX percent divided by square root of two hundred fifty two and serves as the distance unit for targets and stops.
Components
• VIX Channel. Top, mid, bottom lines anchored at 09:30 New York. No extra multipliers
• Window Trend. Close of the first N minutes relative to the session open sets direction
• Risk Bracket. Take profit and stop loss equal to VIX unit times user factor
• Session Window. Uses the exchange time of the chart
Fusion rule
Minimum gates count equals one. The trade only arms after the window has elapsed and a direction exists. One entry per session.
Signal rule
• Long when the window close is above the session open and the window has completed
• Short when the window close is below the session open and the window has completed
• Exit on channel touch. Long exits at the top. Short exits at the bottom
• Flat thirty minutes before the session close or at the user setting
Inputs with guidance
Setup
• Use VIX9D. Width source. Typical true for fast tone or false for baseline
• Use daily OPEN. Toggle for sensitivity to overnight changes
Logic
• Window minutes. Five to one hundred twenty. Larger values delay entries and reduce whipsaw
• VIX factor for TP. Zero point five to two. Raising it widens the profit target
• VIX factor for SL. Zero point five to two. Raising it widens the stop
• Exit minutes before close. Fifteen to ninety. Raising it exits earlier
Properties visible in this publication
• Initial capital one hundred thousand USD
• Base currency USD
• request.security uses lookahead off
• Commission cash per contract two point five $ per each contract. Slippage one tick
• Default order size method FIXED with value one contract. Pyramiding zero. Process orders on close ON. Bar magnifier OFF. Recalculate after order is filled OFF. Calc on every tick ON
Realism and responsible publication
No performance claims. Past results never guarantee future outcomes. Fills and slippage vary by venue. Shapes can move while a bar forms and settle on close. Strategy uses standard candles.
Honest limitations and failure modes
Economic releases and thin liquidity can break the channel. Very quiet regimes can reduce signal contrast. Session windows follow the exchange time of the chart. If both stop and target can be hit within one bar, assume stop first for conservative reading without bar magnifier.
Works best in liquid hours of New York RTH. Very large gaps and surprise news may exceed the implied channel. Always validate on the symbols you trade.
Entries and exits
• Entry logic. After the first window, go long if the window close is above the session open, go short if below
• Exit logic. Long exits at the channel top or at the take profit or stop. Short exits at the channel bottom or at the take profit or stop. Flat before session close by the configured minutes
• Risk model. Initial stop and target based on the VIX unit times user factors. No trail and no break even. No cooldown
• Tie handling. Treat as stop first for conservative interpretation
Position sizing
Fixed size one contract per trade. Target risk per trade should generally remain near one percent of account equity. Risk is based on the daily volatility value, the max loss from the tests for one year duration with 5min chart was 4%, while the avg loss was below <1% of the total capital.
If you have any questions please let me know. Thank you for coming by !

Roboquant RP Profits NY Open Retest StrategyRoboquant RP Profits NY Open Retest Strategy A good strategy for CL

💸 DCA Accumulation Strategy (USD‑Based Scaling)Buy when blue arrow appears, if the next arrow is lower than the last increase your position. This will pull your average cost down slowly over time.

《Seguimento de Tendências》Deus das Mensagens👀 Novidades blockchain a cada 6 horas ⬇️
t.me
I really enjoyed reading the book Trend Following. The indicators created based on the book's content include: momentum trading, going long and short, pyramiding, and risk control.

《Seguimiento de Tendencias》Dios del Seguimiento👀 Noticias blockchain cada 6 horas ⬇️
t.me
I really enjoyed reading the book Trend Following. The indicators created based on the book's content include: momentum trading, going long and short, pyramiding, and risk control.

《Theo Dõi Xu Hướng》Thần Khúc Theo Dõi Tin👀 Cập nhật blockchain mỗi 6 giờ ⬇️
t.me
《Trend Following》
I really enjoyed reading the book Trend Following. The indicators created based on the book's content include: momentum trading, going long and short, pyramiding, and risk control.

Krist1aqq - Premium Signal System (eng)To get the indicator, write to Telegram: @ASTRO_rou
Choose dynamic (ATR) for trading coins from 45 minutes to 1 hour, or static (%) depending on the performance of the current coin.
In TP1 (%) - Static is recommended to replace 1.5 with 1.

BTC H4 ATR + MA Cross + Volume Spike StrategyBTC H4 ATR + MA Cross + Volume Spike Strategy BTC H4 ATR + MA Cross + Volume Spike StrategyBTC H4 ATR + MA Cross + Volume Spike StrategyBTC H4 ATR + MA Cross + Volume Spike StrategyBTC H4 ATR + MA Cross + Volume Spike StrategyBTC H4 ATR + MA Cross + Volume Spike StrategyBTC H4 ATR + MA Cross + Volume Spike Strategy

Z_TF_HighestBarBreakout_Long_GC_180OVERVIEW
This strategy hunts for sustained upside momentum on COMEX Gold (GC) using a 180-minute chart. It buys strength when price breaks above the session’s most significant highs, then manages the position with hard exits (stop / target), time-based rules, and an optional profit-locking trailing stop. Trading hours, daily trade caps, and “end-of-day” behavior are explicitly handled so results remain consistent across brokers and daylight-saving changes.
INSTRUMENT & CHART
• Market: Gold Futures (GC) continuous / front contract on TradingView.
• Resolution: 180-minute (3h) bars.
• Behavior: Calculates on every tick; uses standard OHLC order simulation for more realistic fills.
CORE LOGIC
At its heart, the system implements a highest-bar breakout : it monitors the current session (or a configurable intraday window) and enters long only when price firmly exceeds the most meaningful high observed in that window. This favors trending days where buyers win successive swings rather than choppy ranges.
LONG ENTRIES
Breakout condition: A buy stop is armed at/above the active reference high (session-to-date or a time-boxed window). A confirmed breach triggers the long.
Time filter: Entries are allowed only inside user-defined trading hours. Overnight sessions and regular day sessions are both supported.
Daily trade cap: The strategy enforces a maximum number of entries per calendar day to limit over-trading.
Quality filter (optional): A “body vs range” factor measured between two intraday timestamps can block weak setups (e.g., avoid tiny-body or indecisive price action before breakouts).
EXITS & TRADE MANAGEMENT
Initial Stop Loss: A protective stop is placed when the position opens. It can be absolute (price level) and remains active until replaced by a trailing stop (if enabled).
Take Profit (optional): An exit limit can close the trade at a predefined reward level.
Break-even / Trailing (optional): Once open profit exceeds a threshold, an adaptive trailing stop can activate. It tracks a fraction of max favorable excursion so profits are partially locked while leaving room for trend continuation.
Maximum holding days: Positions that last beyond a set number of session starts are force-closed to avoid overstaying trends that have stalled.
End-of-day handling: The code can detect a “last bar of the trading day” (robust to DST) and is designed to support session-close logic if you choose to flatten by day’s end.
RISK & POSITIONING
Position size: Set the number of contracts per trade to fit account size and risk tolerance.
Per-trade risk: Define the stop distance (and optional target) so the expected loss fits within your percentage-of-equity rules.
Trade frequency guard: A daily cap limits entries on noisy days.
Time-in-trade guard: The maximum-days rule prevents capital from getting trapped in slow drifts.
SESSION & TIME WINDOWS (RELIABILITY NOTES)
Custom sessions: You can specify trading hours using simple HHmm ranges (e.g., “1700-1600” for CME Globex). Overnight windows are supported.
Robust OHLC by session: The script tracks session-open, high, low, and close internally to avoid off-by-one errors during weekends, gaps, or DST transitions.
Intraday windows: Optional start/end times let you compute “body factor” or reference highs only within a chosen slice of the day (e.g., morning impulse).
VISUAL OVERLAYS
Trade markup: When a trade opens, the chart shows Entry, Stop, and (if used) Target lines; color-filled zones highlight unrealized and realized P&L.
Order levels history: An optional overlay draws recent long/short order lines (with quantities) for quick forensic review of signals and slippage.
Readable labels: Text size, line width, and label placement are tuned for clean visibility on 3h charts.
ROLLOVER AWARENESS (FUTURES)
The script ships with a calendar of front-month rollover timestamps. An explicative Badge will tell you exactly which Instrument, Time Frame, Session and Next Roll this strategy works on. A Rollover Alert can be set through the Inputs panel, and received a number of days before rollover, decided by the user.
TYPICAL USE & TUNING
The strategy is already optimized and ready to use on Gold Future - 180 minutes Time Frame. The user can decide whether to customize the inputs or maintain them as they are.
Define your trading hours and whether you want session-to-close exposure or to flatten earlier.
Choose a daily trade cap that matches your risk appetite.
Pick stop/target distances consistent with GC’s tick size and your intended reward-to-risk.
If you like trend capture, enable the trailing stop with a reasonable activation profit and trail percentage.
WHAT THIS STRATEGY IS (AND ISN’T)
• It is a momentum-following, long-only breakout model designed to exploit bullish continuation days on Gold.
• It is not a mean-reversion system and typically underperforms in tight ranges or headline-driven whipsaws.
Educational-only disclosure: This publication is for research and education. It is not investment advice and does not guarantee profits. Futures and leveraged products involve substantial risk and are not suitable for every investor. Always test thoroughly and trade at your own risk.

Psyll AlgoPsyll Algo is a powerful , mathematics-based automated trading strategy built in Pine Script for the TradingView platform. Developed by mathematicians and data analysts, it relies purely on mathematical models rather than subjective indicators or market sentiment. The goal is to deliver precise and reliable trading signals that maintain consistency across all market conditions. Pine Algo operates seamlessly on crypto, stocks, indices and commodities, adapting to any asset and timeframe with mathematical accuracy.
Psyll Algo uses proprietary anti-repainting mechanisms that ensure all signals remain permanent once generated. Each entry and exit signal is calculated after a candle closes, providing full transparency and reproducibility of results. The strategy dynamically adjusts to market volatility, momentum, and volume - filtering out noise and improving signal stability. Its foundation in pure mathematics allows it to recognize repeatable price behaviors that remain hidden to traditional indicator-based systems.
Psyll Algo analyzes data from over 20 technical components, 29 types of moving averages, and more than 120 custom settings to deliver mathematically consistent trading decisions. Every parameter is adjustable within TradingViews intuitive interface, allowing traders to fine-tune the algorithm to their risk profile and style - without writing any code. This combination of mathematical precision, adaptability and transparency makes Pine Algo a reliable foundation for consistent and disciplined trading.
Futures:
Works on all assets and timeframes - Whether you trade cryptocurrencies, stocks, forex or indices - Psyll Algo adapts seamlessly to any market. Its modular logic and adjustable parameters make it effective on short-term scalps, intraday trades, and long-term trend strategies alike. Designed to provide stable results regardless of market volatility.
Supports single-entry and DCA strategies - Choose between precision single-entry trades or a Dollar Cost Averaging (DCA) approach for smoother equity curves. Psyll Pine Algo lets traders dynamically manage entries, scale positions intelligently, and adjust exposure based on market context - all within the same script.
Intuitive, transparent and easy to use - Built with simplicity in mind, Psyll Algo requires no coding knowledge. Every parameter is clearly explained and can be adjusted directly from the TradingView interface. You stay in full control - see every signal, condition, and alert in real time.
Adaptive performance optimization - The algorithm automatically adjusts to changing volatility, volume, and momentum conditions. By dynamically tuning internal filters, it maintains consistent trade logic and reduces false signals during market noise or low liquidity phases.
Intuitive, transparent and easy to use - Built with simplicity in mind, Psyll Algo requires no coding knowledge. Every parameter is clearly explained and can be adjusted directly from the TradingView interface. You stay in full control - see every signal, condition, and alert in real time.
Fully compatible with TradingView - Developed natively in PineScript for TradingView, Psyll Algo integrates perfectly with your existing workspace. Set alerts, visualize entries and exits, or automate execution via Psyll webhook - all from a single interface. Seamless synchronization between chart and strategy logic.
Adaptive performance optimization - The algorithm automatically adjusts to changing volatility, volume, and momentum conditions. By dynamically tuning internal filters, it maintains consistent trade logic and reduces false signals during market noise or low liquidity phases.
Smart risk and position management - Psyll Algo incorporates built-in stop-loss, take-profit and proprietary trailing mechanisms that can be fully customized. It empowers traders to define exact risk parameters and enforce discipline through algorithmic consistency - no emotions, just logic.
Backtested and field-proven logic - The strategy has been rigorously tested on multiple assets and timeframes, ensuring data-driven confidence before live deployment. Every optimization step was based on statistical performance, not curve fitting - real results, verified over time.
No repaint logic - 100% reliable signals - Psyll Algo generates signals strictly on confirmed candle closes, ensuring zero repainting or backtest manipulation. What you see in real time is exactly what you get in history - transparent, consistent, and fully trustworthy data. Every alert remains fixed once confirmed, giving you absolute confidence in every trade.

《Trend Following》I really enjoyed reading the book Trend Following. The indicators created based on the book's content include: momentum trading, going long and short, pyramiding, and risk control.
Message Tracking 👀 Blockchain updates every 6 hours ⬇️
t.me

《การติดตามแนวโน้ม》อ่านหนังสือการติดตามแนวโน้มแล้วชอบมาก ตัวชี้วัดที่สร้างขึ้นตามเนื้อหาในหนังสือ รวมถึง: การเทรดตามแนวโน้ม, ทำทั้งฝั่งซื้อและขาย, การเพิ่มพอร์ต และการควบคุมความเสี่ยง
t.me
《Trend Following》
I really enjoyed reading the book Trend Following. The indicators created based on the book's content include: momentum trading, going long and short, pyramiding, and risk control.

《趨勢跟蹤》拜讀趨勢跟蹤這本書非常喜歡,根據書中內容製作出來的指標,包含:順勢交易、多空都做、加碼和風控。
t.me
《Trend Following》
I really enjoyed reading the book Trend Following. The indicators created based on the book's content include: momentum trading, going long and short, pyramiding, and risk control.

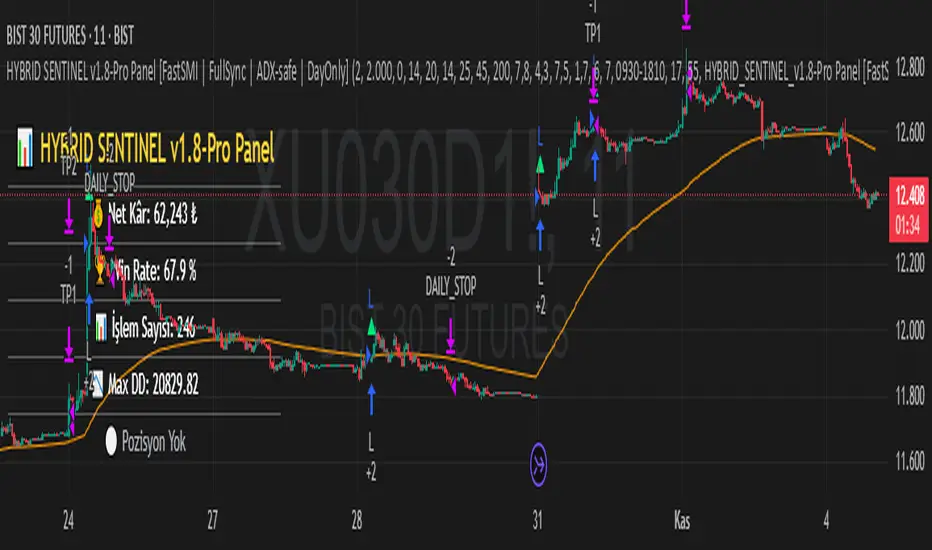
HYBRID SENTINEL v1.8-Pro Panel🧠 HYBRID SENTINEL v1.8 — Pro Panel Edition
(FastSMI | FullSync | ADX-safe | DayOnly Strategy)
💡 Developed collaboratively by Can Yoldaş & ChatGPT-5 (2025)
🔍 Overview
HYBRID SENTINEL v1.8 is a fully automated day-session trading strategy built with multi-layer trend filtration, adaptive volatility scaling, and a professional alert system.
This “Pro Panel Edition” introduces a real-time performance dashboard that tracks live PnL, Win Rate, Max Drawdown, trade count, and position status directly on the chart.
Unlike conventional momentum systems, HYBRID SENTINEL combines Cumulative Delta Volume (CDV) with an optimized FastSMI oscillator to generate high-accuracy entries based on synchronized momentum-volume confirmation.
⚙️ Core Features
Component Description
🧩 Fast SMI Dual-EMA optimized Stochastic Momentum Index — 40 % faster reaction than the classic version.
📊 CDV Volume Engine Tracks directional volume pressure to confirm momentum strength.
⚔️ ADX-Safe Filter Blocks trades in weak or flat trends, reducing false signals.
🕐 Day-Only Mode Trades only between 09:30–18:10; auto-closes all positions before session end.
💰 Adaptive ATR Targets Dynamically scales TP1–TP2 according to market volatility.
🚨 JSON Alert System Fully compatible with TradingView → Make.com → Telegram automations via one-line JSON alerts.
🧾 Pro Performance Panel Displays live PnL, Win Rate, Drawdown, and position status in the chart’s bottom-left corner.
🧠 Use Cases
Intraday trend-following and momentum strategies
Works seamlessly on BIST, Futures, Forex, and Crypto
Fully integrable with Make.com / Pipedream / Telegram bot ecosystems
Suitable for both manual signal monitoring and automated backtesting & execution
📈 Development Philosophy
“True strategy isn’t about complex indicators, but synchronized filters and intelligent risk control.”
— Can Yoldaş, 2025
HYBRID SENTINEL v1.8 blends AI-assisted technical design with human trading intuition, creating a disciplined, data-driven trading framework.
⚠️ Disclaimer
This script is not financial advice.
Always test thoroughly in demo mode before using with real capital.
Trading involves risk; decisions should match your personal risk profile.
🧭 Version Notes — v1.8 Pro Panel Update
📊 Added real-time performance table
⚡ Optimized FastSMI responsiveness
🔄 Introduced EMA200 FullSync (continuous 5-minute synchronization)
🚨 Simplified JSON alert structure
🔒 Enhanced ADX trend safety filter