Orderblock Footprints [AlgoAlpha]🟠 OVERVIEW
This script highlights orderblocks and then drills into what actually trades inside them. Zones are created only after an abnormal directional impulse, measured with a z-score on consecutive candle bodies, so the orderblocks are tied to real expansion rather than simple pivots. Once a zone exists, the script overlays lower-timeframe volume footprints inside the candle when price trades back into that zone. The goal is to show not just where an orderblock sits, but whether price is being accepted or absorbed when it is revisited.
🟠 CONCEPTS
Orderblocks are detected after extreme bullish or bearish impulses. The script tracks consecutive body movement up or down, normalizes that distance with a rolling z-score, and only triggers when the move is statistically large. The last opposite candle before that impulse defines the orderblock range. These zones then extend forward until they are either mitigated by price closing through them or they expire by age.
Inside an active zone, the script switches to a lower timeframe and builds a footprint-style profile for each bar. Each candle is split into price rows, counting time-at-price and volume delta. Positive and negative delta are colored separately. Absorption is flagged when opposing delta prints appear in the wick that rejects the zone. In practice: the impulse defines context ; the footprint shows interaction .
🟠 FEATURES
Separate bullish and bearish zones with automatic extension
Volume split inside each zone candle (up vs down volume)
Lower-timeframe footprint with TPO-style rows and delta gradient
Absorption detection using opposing delta in rejection wicks
Alerts for zone creation and absorption events
🟠 USAGE
Setup : Add the script to your chart. It works on any market and timeframe. The lower timeframe for footprints is fixed at 5 minutes, so higher chart timeframes show clearer structure. Use the Z-Score Window to control how strict impulse detection is and Max Box Age to limit how long old zones stay on the chart.
Read the chart : Bullish orderblocks are created after strong upward impulses and are invalidated when price closes below them. Bearish orderblocks are created after strong downward impulses and are invalidated when price closes above them. When price trades inside a zone, footprint rows appear. Green-tinted rows show positive delta; red-tinted rows show negative delta. Absorption labels appear when opposing delta prints into a rejecting wick.
Settings that matter : Increasing the Z-Score Window makes orderblocks rarer but more significant. Disabling Prevent Overlap allows stacked zones if you want to study clustering. Adjusting Rows per bar changes footprint resolution—lower values are cleaner, higher values show more detail but use more objects.
Indicators and strategies

Smart Money Alpha Signals (Performance Dashboard) Smart Money Alpha Signals: Identifying Market Leaders & Generating Alpha
GMP Alpha Signals (Global Market Performance Alpha) is a specialized analysis tool designed not merely to find stocks that are rising, but to identify "Alpha" assets—Market Leaders that defend their price or rise even under adverse conditions where the market index falls or consolidates.
This indicator visualizes the concept of Comparative Relative Strength (RS) and Smart Money accumulation patterns, helping traders capture profit opportunities even during bearish market phases.
Key Objectives (Purpose)
Alpha Capture: Identifying assets generating 'excess returns' that outperform the market Beta.
Smart Money Tracking: Detecting traces of 'institutional buying' and 'accumulation' that defend prices during index plunges.
Decoupling Identification: Spotting assets moving on independent catalysts or momentum, regardless of the broader market direction.
Stop Hunt Filtering: Distinguishing 'fake drops' where price dips temporarily, but Relative Strength remains intact.
Dashboard Guide
Interpretation of the information panel (Table) displayed on the chart.
Rel. Performance: Shows the excess return compared to the index over the set period. (Positive/Green = Stronger than the market).
Decoupling Strength: The correlation coefficient with the index. Lower values (0 or negative) indicate movement independent of market risk.
Bullish: The count/rate of rising or limiting losses when the index drops sharply (e.g., < -0.5%). (Gold = Market Crash Leader).
Defended: The count/rate of holding support levels when the index shows mild weakness (e.g., < -0.05%). (Gold = Strong Accumulation).
Bench. Defense: The defense rate of the comparison benchmark (e.g., TSLA, ETH). Your target asset must be higher to be considered the sector leader.
Input Options & Settings Guide
You can optimize settings according to your trading style and asset class (Stocks/Crypto).
(1) Main Settings
Major Index: The baseline market index for comparison.
(US Stocks: NASDAQ:NDX or TVC:SPX / Crypto: BINANCE:BTCUSDT)
Benchmark Symbol: A competitor within the sector.
(e.g., Set NVDA when analyzing Semiconductor stocks).
Correlation Lookback: The lookback period for judging decoupling. (Default: 30)
Performance Lookback: The number of bars to calculate cumulative returns and defense rates. (Default: 60)
(2) Dashboard Thresholds
These settings define the criteria for what qualifies as "Defended" or "Bullish".
Performance (Max %): Used to find assets that haven't pumped yet. Signals trigger only when Alpha is below this value.
Defended Logic:
Index Drop Condition: The index must drop by at least this amount to start checking. (e.g., -0.05%)
Asset Buffer: How much the asset must outperform the index drop.
(Example: If Index drops -1.0% and Buffer is 0.2%, the asset must be at least -0.8% to count as 'Defended').
Bullish Logic: Measures resilience during steeper market dumps (e.g., -0.5% drop) compared to the Defended Logic.
Volume Settings: Decides whether to count Defended/Bullish instances only when accompanied by volume above the SMA.
(3) Signal Logic Settings (Crucial)
Customize conditions to trigger alerts. The choice between AND / OR is crucial.
AND: Condition must be met SIMULTANEOUSLY with other active conditions (Conservative/High Certainty).
OR: Condition triggers the signal INDEPENDENTLY (Aggressive/Opportunity Capture).
Performance: Is the relative performance within the threshold? (Basic Filter).
Decoupling: Has the correlation dropped? (Start of independent move).
Bullish Rate: Is the Bullish rate high during market dumps?
Defended Rate (High): (Recommended) Is there continuous price defense occurring? (Accumulation detection).
Defended Rate (Low): (Warning) Has the defense rate broken down? (For Stop Loss).
Defended > Benchmark: Is it stronger than the Benchmark (2nd tier)?
Volume Spike: Has volume surged compared to the average? (Institutional involvement).
RSI Oversold: Is it in oversold territory? (Counter-trend trading).
Decoupling Move: Does the current bar show the "Index Down / Asset Up" pattern?
Min USD Volume: Transaction value filter (To exclude low liquidity assets).

Tomb Reversal Signal Engulfing + RSI Momentum DetectorTomb is a fast and minimalistic reversal-detection indicator built to capture high-probability turning points in the market.
It combines engulfing candlestick patterns, a strong candle body filter, and RSI momentum analysis to generate precise BUY and SELL signals with minimal noise.
🔍 How it Works
The indicator triggers:
✅ BUY Signal
Bullish engulfing pattern appears
Candle body strength > 50% of total range (real momentum)
RSI below 50 (bearish momentum weakening)
Price decreasing over the last 5 bars (down-trend exhaustion)
✅ SELL Signal
Bearish engulfing pattern
Candle body shows strength
RSI above 50 (bullish momentum weakening)
Price increasing over the last 5 bars (up-trend exhaustion)
⚡ Why Tomb Works
Filters out weak signals using candle structure
Detects momentum shifts early
Works on all markets: Crypto, Forex, Indices, Stocks
Ideal for scalping, day trading, or swing trading
🎯 Purpose
To highlight the exact moments where the market shows exhaustion and is ready to reverse—before most traders see it.
📌 Recommended Use
For best performance:
Combine with trend tools such as EMA 200 or market structure
Look for signals at support/resistance or liquidity zones

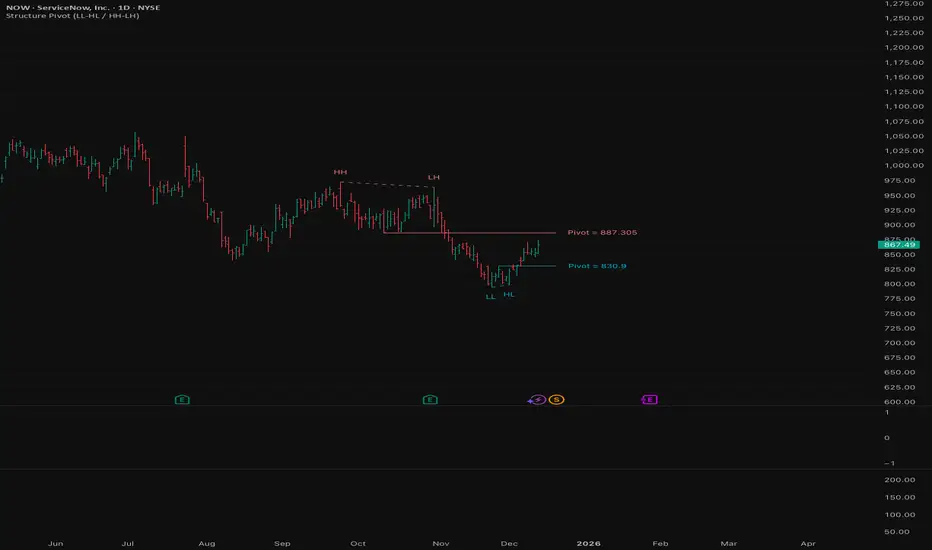
Structure Pivot (LL-HL / HH-LH)Structure Pivot (LL-HL / HH-LH) - Indicator Guide
This indicator scans for market structure pivot patterns—specifically the bullish Higher Low (LL–HL) and the bearish Lower High (HH–LH) —across multiple lengths simultaneously.
It automatically selects the most optimal pattern based on a "Priority Mode" and plots the structure and breakout/breakdown levels on the chart.
1. Basic Calculation Method
The indicator builds upon TradingView’s ta.pivotlow and ta.pivothigh functions to identify structural points.
Bullish Structure (LL–HL)
1.LL (Lowest Low): A standard Pivot Low is identified.
2.HL (Higher Low): A subsequent Pivot Low forms higher than the previous LL. This completes the setup.
3.Pivot Line (Resistance): The indicator finds the highest price (High) that occurred between the LL and the HL. This level becomes the breakout trigger.
Bearish Structure (HH–LH)
1.HH (Highest High): A standard Pivot High is identified.
2.LH (Lower High): A subsequent Pivot High forms lower than the previous HH. This completes the setup.
3.Pivot Line (Support): The indicator finds the lowest price (Low) that occurred between the HH and the LH. This level becomes the breakdown trigger.
2. Multi-Length Scanning
Unlike standard indicators that use a single fixed length (e.g., Length = 5), this indicator scans a range of lengths simultaneously.
・Settings: Defined by Min Length and Max Length.
・Mechanism: If set to Min=2 and Max=10, the indicator internally runs 9 separate calculations (Length 2 through 10) in parallel.
This allows it to capture everything from small, short-term pullbacks to larger, significant structural pivots without manual adjustment.
3. Priority Mode System
Since multiple lengths are scanned, multiple valid patterns may appear at the same time. The Priority Mode determines which single pattern is the "winner" and gets displayed.
A. Tightest Structure (Default)
・For Bullish (Long): Selects the pattern with the lowest Pivot Line (Resistance).
・For Bearish (Short): Selects the pattern with the highest Pivot Line (Support).
・Advantage: It finds the "tightest" contraction (like a VCP). This offers the entry point closest to the stop-loss level, providing the best Risk/Reward ratio.
B. Longest Length
・Selects the pattern detected by the longest length setting.
・Advantage: Focuses on major structural points, filtering out short-term noise. Best for trend confirmation.
C. Shortest Length
・Selects the pattern detected by the shortest length setting.
・Advantage: Extremely sensitive. Best for scalping or catching immediate micro-pullbacks.
4. Real-Time Logic & Features
Structure Invalidation (Failure)
・Bullish: If the current price drops below the HL (the support of the structure), the setup is considered failed.
・Bearish: If the current price rises above the LH (the resistance of the structure), the setup is considered failed.
・Result: All lines and labels for that structure are immediately deleted to keep the chart clean.
Pivot Line Extension
・As long as the structure remains valid (price hasn't violated the HL or LH), the Pivot Line extends to the right, acting as a live reference for breakouts or breakdowns.
Alerts
・Bullish Breakout: Triggered when the Close price crosses over the Pivot Line.
・Bearish Breakdown: Triggered when the Close price crosses under the Pivot Line.
Sayed Official SniperSniper and Trading best swing of the year no body knows i get it premium to share with you guyz
LL-HL PivotThis indicator scans for the bullish structure known as a Higher Low (HL) across multiple lengths simultaneously, automatically selects the most suitable pattern, and plots it on the chart.
Below is a detailed explanation of how it works.
1. Basic Calculation Method (Definition of LL and HL)
This indicator is built on TradingView’s ta.pivotlow function.
Detecting Pivot Lows
For a given length, a Pivot Low is identified as the lowest point among the candles within the specified range to the left and right.
LL and HL Determination
LL (Lowest Low): The most recent Pivot Low is treated as the previous low.
HL (Higher Low): When a new Pivot Low forms above the previous LL, it is recognized as an HL, and the setup is considered “complete.”
Identifying the Pivot Line
During the LL–HL structure, the highest high between them is identified and used as the breakout level (Pivot Line / resistance), where a horizontal line is drawn.
2. Multi-Length Scanning
Unlike standard indicators that use only one length (e.g., Length = 5), this indicator evaluates a full range of lengths.
Min Length to Max Length
Example: Min = 2, Max = 10
Internally, it functions as if nine separate indicators (Length 2, 3, 4 … 10) are running simultaneously.
This allows the indicator to capture:
Small waves (short-term pullbacks)
Larger waves (broader structural moves)
3. Priority Mode System
Because multiple lengths are calculated at the same time, different LL–HL patterns may appear simultaneously.Priority Mode determines which setup is selected and displayed.
A. Lowest LH
Selects the pattern with the lowest pivot line (intermediate high).
Advantages:
Produces the lowest possible entry price
B. Longest Length
Selects the pattern with the longest length.
Advantages:
Focuses on larger structures and broader waves
Filters out noise
C. Shortest Length
Selects the pattern with the shortest length.
Advantages:
Reacts quickly to small moves
Useful for scalping or fast trend-following
Captures very short-term pullbacks
4. Additional Behavior and Features
Real-Time Invalidation
If price breaks below the confirmed HL, the structure is immediately considered invalid.
All previously drawn lines and labels are removed instantly, preventing outdated structures from remaining on the chart.
Pivot Line Extension
As long as the HL remains intact, the Pivot Line (breakout level) continues extending to the right.
Alerts
An alert can be triggered the moment price breaks above the Pivot Line on a closing basis.

Order Block Finder [MHA Finverse]Order Block Finder is a sophisticated Smart Money Concepts (SMC) tool designed to identify and visualize institutional order blocks on your charts. This indicator helps traders spot key areas where smart money has placed their orders, providing valuable insights for potential support and resistance zones.
What are Order Blocks?
Order blocks are price zones where institutional traders have placed significant orders. This indicator identifies these zones by detecting pivot points in price action and tracking structural breaks in both internal (short-term) and swing (long-term) timeframes.
Key Features:
• Dual Structure Analysis
- Internal Order Blocks: Fast-moving blocks based on 5-bar pivots for short-term trading
- Swing Order Blocks: Slower blocks based on 50-bar pivots for position trading
- Display up to 20 order blocks per type
• Volume Metrics
Each order block displays two important metrics:
- Volume value: The total volume of the candle that formed the order block
- Percentage: Relative volume compared to all visible order blocks (always totals 100%)
Higher percentages indicate stronger institutional activity and more significant zones
• Smart Filtering System
- ATR Filter: Filters out high-volatility candles (>2x ATR) to focus on genuine order blocks
- CMR Filter: Uses Cumulative Mean Range for adaptive filtering across different market conditions
• Flexible Mitigation Options
Choose how order blocks are considered broken:
- High/Low: Order block breaks when price touches its boundary
- Close: Order block breaks only when candle closes through it
• Visual Customization
- Colored or Monochrome themes
- Adjustable text size for volume metrics
- Customizable colors for bullish and bearish blocks
- Historical or Present mode for clean chart analysis
• Built-in Alert System
- Real-time alerts when order blocks are mitigated
- Individual toggles for each alert type
- Clear emoji indicators (🔵 Bullish, 🔴 Bearish)
- Compatible with TradingView's alert system
How It Works:
The indicator identifies order blocks by:
1. Detecting pivot highs and lows in price structure
2. Monitoring when price crosses these pivots (structure breaks)
3. Finding the highest/lowest volatility-filtered candle in the pivot zone
4. Marking this candle as an order block with its volume data
5. Removing blocks when the price mitigates them
Order blocks with higher volume percentages represent stronger institutional interest and are typically more reliable for trading decisions.
Best Practices:
- Use Internal OBs for day trading and scalping
- Use Swing OBs for swing trading and position entries
- Pay attention to blocks with higher volume percentages
- Combine with other SMC concepts for confirmation
Perfect for traders who follow Smart Money Concepts, ICT methodology, and institutional trading analysis.
Disclaimer:
This indicator is provided for educational and informational purposes only. It should not be considered as financial advice or a recommendation to buy or sell any financial instrument. Trading involves substantial risk of loss and is not suitable for all investors. Past performance does not guarantee future results. Always conduct your own research and consult with a qualified financial advisor before making any trading decisions. The creator of this indicator assumes no responsibility for any losses incurred from its use.

Momentum Candle V3 by Sekolah TradingMomentum Candle v3 by Sekolah Trading
Description:
Momentum Candle v3 is a technical indicator designed to identify market momentum signals based on price movement within a single candle. The indicator measures the size of the candle's body and wick to determine if the market is showing strong bullish or bearish momentum.
Key Features:
Candle Size: Measures price movement within a single candle to assess market momentum.
Short Wick: Focuses on wick length, with short wicks indicating that the closing price is more significant than the opening price.
Bullish/Bearish Momentum: Provides bullish signals when the closing price is higher than the open, and bearish signals when the closing price is lower than the open.
Customizable Minimum Body: Users can adjust the minimum body size for XAUUSD and USDJPY pairs according to their trading preferences.
Timeframe: Works on M5 and M15 timeframes for XAUUSD and USDJPY currency pairs.
How to Use:
Bullish Signal: The indicator signals bullish momentum when the candle body is sufficiently large and the wick is short, with the closing price higher than the open.
Bearish Signal: The indicator signals bearish momentum when the candle body is sufficiently large and the wick is short, with the closing price lower than the open.
Pip Parameters: Adjust the pip values for XAUUSD and USDJPY according to market conditions or your trading preferences.
Note: This indicator is a tool for technical analysis and does not guarantee specific trading results. It is recommended to use it alongside other strategies and analyses for better accuracy.
Realistic Backtest Results:
To ensure transparency and honesty in the backtest, here are some key factors to consider:
Position Size: The backtest uses a realistic position size of about 5-10% of the account equity per trade.
Commission & Slippage: A commission of 0.1% per trade and slippage of 1 pip were used in the backtest simulation to reflect real market conditions.
Number of Trades: The backtest sample includes more than 100 trades for a representative result.
Example of Backtest Results:
Profitability: The backtest results on XAUUSD and USDJPY show consistent performance with this strategy on the M5 and M15 timeframes.
Commission and Slippage: Adjusting for commission and slippage showed better accuracy under more realistic market scenarios.
How to Use the Indicator:
Signals from this indicator can be used to confirm market momentum in trending conditions. However, it is highly recommended to combine this indicator with other technical analysis tools to minimize the risk of false signals.
Important Notes:
Honesty & Transparency: This indicator is designed to provide signals based on technical analysis and does not guarantee specific trading results.
No Over-Claims: The backtest results displayed represent realistic scenarios and are not intended to promise certain profits.
Original Content: The code for this indicator is original and does not violate any copyrights.
Tagging:
Smart Tags: Momentum, Candle, XAUUSD, USDJPY, Bullish, Bearish, M5, M15, Technical Indicator, Market Momentum.

Pivot Oscillator█ OVERVIEW
Pivot Oscillator is a versatile oscillator that measures market strength by comparing the current price to local price pivots. Values are scaled by ATR, normalized to a 0–100 range, and displayed along with an SMA line.
Oscillator: generates signals suitable for pullback strategies.
SMA line: serves as a momentum indicator.
█ CONCEPTS
Pivot Oscillator is designed with dual functionality:
- Oscillator & signals: ideal for pullback strategies, detecting local highs/lows and short-term reversals.
- SMA (Momentum): shows stable market-side dominance and filters price impulses.
Calculation logic:
- Oscillator = closing price − pivot line (derived from average high/low pivots).
Scaled by ATR and normalized to 0–100:
50 – bullish dominance,
< 50 – bearish dominance.
SMA is computed from smoothed oscillator values and serves as a momentum indicator.
█ FEATURES
Pivot Calculation:
- Pivot Length (lenSwing) – the number of bars used to identify local pivots (highs/lows). Higher values filter only larger extremes, while lower values make the oscillator react faster to local highs and lows.
- Pivot Level (pivotLevel) – determines the position of the pivot line between the average low and high pivots. A value of 0.5 places the pivotLine exactly halfway between the average high and low pivots; values closer to 0 or 1 shift the line toward the low or high pivots, respectively.
- Pivot Lookback (lookback) – the number of recent pivots used to calculate the average pivot, which smooths the pivotLine and reduces noise caused by individual extremes.
- Oscillator calculation: closing price − pivotLine (average of pivots computed from the above parameters).
The pivotLine is then scaled by ATR and normalized to a 0–100 range.
ATR Scaling:
- ATR period (atrLen)
- Multipliers (multUp / multDown) for upper and lower scaling.
Dynamic Colors:
- Oscillator > 50 → green (bullish)
- Oscillator < 50 → red (bearish)
SMA Line (Momentum):
- Smoothed oscillator (SMA) serves as a momentum indicator.
- Dynamic color indicates direction of SMA.
- Helps identify dominant market side and trend.
Overbought / Oversold Zones:
- Configurable OB/OS levels for both oscillator and SMA.
- Dynamic band colors: change depending on SMA relative to maOverbought / maOversold.
- Provides visual confirmation for potential corrections or strong momentum.
Gradients & Visualization:
- Oscillator and SMA gradients (3 layers) with adjustable transparency.
- Gradient visualization for OB/OS zones and oscillator.
- Full customization of colors, line width, and transparency.
Signals:
- Oscillator leaving oversold zone → long signal
- Oscillator leaving overbought zone → short signal
- OB/OS band colors dynamically reflect SMA levels for additional confirmation.
Alerts:
- OB/OS cross alerts.
█ HOW TO USE
Add the indicator to your TradingView chart → Indicators → search for “Pivot Oscillator”.
Parameter Configuration:
- Pivot Settings: pivot length, pivot level, pivot lookback.
- ATR Settings: ATR period, scaling multipliers.
- Threshold Levels: OB/OS levels for oscillator and SMA.
- Signal Settings: SMA length, extra smoothing.
- Style Settings: bullish/bearish colors, OB/OS lines, midline, text colors.
- Gradient Settings: enable/disable gradients and transparency.
Signal Interpretation:
BUY (Long):
- Oscillator leaves the oversold zone (OS crossover).
- OB/OS band color may additionally confirm the signal when SMA < maOversold.
SELL (Short):
- Oscillator leaves the overbought zone (OB crossunder).
- OB/OS band color may additionally confirm the signal when SMA > maOverbought.
█ APPLICATIONS
Pivot Oscillator and SMA can be scaled for different strategies:
- Pullback strategies: oscillator detects local highs/lows.
- Momentum / Trend: SMA shows market-side dominance and trend direction.
Adjust pivot and ATR parameters:
- Lower settings: faster reaction, suitable for scalping or intraday trading.
- Higher settings: more stable readings, suitable for swing trading or longer timeframes.
█ NOTES
- In strong trends, the oscillator may remain in extreme zones for extended periods – reflects dominance, not necessarily a reversal.
- OB/OS levels should be adapted to the instrument and pivot/ATR settings.
- Works best when combined with other tools: support/resistance, market structure, and volume analysis.

VWAP Flow ParmezanThe "Official Bank Flow VWAP" is a comprehensive trading suite designed for institutional Forex traders.
This indicator solves the problem of chart clutter by combining two critical components of liquidity: Price (Value) and Time (Sessions). It is specifically optimized for EUR/USD and GBP/USD on intraday timeframes (M5, M15), helping you identify high-probability setups where "Fair Value" meets "Volatility."
Key Features
1. Multi-Timeframe VWAP Hierarchy Unlike standard indicators, this tool visualizes the interaction between three distinct timeframes:
Daily VWAP (Dynamic Color): Your primary trend filter. Green when Bullish (Price > VWAP), Red when Bearish (Price < VWAP).
Weekly VWAP (Orange Dots): Represents the medium-term balance. Acts as a magnet for mean reversion mid-week.
Monthly VWAP (Purple Line): The institutional "line in the sand." Major support/resistance level.
2. Standard Deviation Bands (Market Balance) The indicator plots SD1 and SD2 bands around the Daily VWAP:
Inner Zone (SD1): Represents the "Fair Value" area.
Outer Bands (SD2): Represents overbought/oversold conditions. Useful for identifying mean reversion plays back to the center.
3. Official Exchange Sessions (Time) Forget confusing "killzones." This tool highlights the Official Open times for major exchanges, adjusted for Daylight Savings via New York time:
London Open (08:00 LDN): The start of European volume.
New York Open (08:00 NY): The injection of US liquidity.
London Close/Fix: The daily overlap close, often marking trend reversals.
Note: Sessions are visualized with non-intrusive black "shadow" backgrounds to keep your chart clean.
4. "Ghost" Levels (Previous VWAP) A unique feature that plots the closing VWAP level of the previous day. Institutional algorithms often target these "untested" levels as Take Profit targets or liquidity pools.
How to Use
Trend Following: If Price is above the Daily VWAP (Green) during the London Open, look for Long entries targeting the SD1/SD2 upper bands.
Mean Reversion: If Price hits the SD2 Band while far away from the Weekly VWAP, look for a reversal back to the mean.
Confluence: The strongest signals occur when price touches a key VWAP level (e.g., Weekly VWAP) specifically during the highlighted Session Start times.
Settings
Timezone: Defaults to America/New_York to automatically handle DST shifts for London/NY opens.
Visuals: Fully customizable colors and transparency. Default is set to a "Dark Mode" friendly professional palette.

3LL+Baby & 3HH+Baby Pattern3LL+Baby & 3HH+Baby Pattern Indicator
Overview
This indicator identifies powerful reversal patterns based on momentum exhaustion and inside bar formations. It detects two specific candlestick patterns that signal potential trend reversals: the bullish 3LL+Baby and the bearish 3HH+Baby.
Pattern Descriptions
📈 3LL+Baby Pattern (Bullish Reversal)
Conditions:
Three consecutive candles form lower lows (each low is lower than the previous)
The fourth candle is bullish/green (closes higher than it opens)
The fourth candle is completely contained within the third candle's range (both high and low)
Interpretation: After a downward momentum with three lower lows, a bullish inside bar (baby candle) suggests sellers are exhausted and buyers may be taking control. This pattern often precedes upward reversals.
📉 3HH+Baby Pattern (Bearish Reversal)
Conditions:
Three consecutive candles form higher highs (each high is higher than the previous)
The fourth candle is bearish/red (closes lower than it opens)
The fourth candle is completely contained within the third candle's range (both high and low)
Interpretation: After upward momentum with three higher highs, a bearish inside bar indicates buyers are losing strength and sellers may be gaining control. This pattern often signals potential downward reversals.
Features
Visual Signals
Green Triangle (↑): Appears below bars when 3LL+Baby pattern is detected
Red Triangle (↓): Appears above bars when 3HH+Baby pattern is detected
Labels: Clear text labels identifying each pattern type
Background Highlighting: Subtle background colors (green for bullish, red for bearish)
Customization Options
Toggle labels on/off
Toggle arrow signals on/off
Enable/disable bullish patterns independently
Enable/disable bearish patterns independently
How to Use
Add to Chart: Apply the indicator to any timeframe and instrument
Configure Settings: Adjust visibility options based on your preference
Set Alerts: Create alerts for immediate pattern notifications
Trading Strategy:
3LL+Baby : Consider long positions or closing shorts
3HH+Baby: Consider short positions or closing longs
Always confirm with additional analysis and risk management
Best Practices
Use in conjunction with support/resistance levels
Combine with volume analysis for confirmation
Works on all timeframes (higher timeframes generally more reliable)
Apply proper risk management and stop-loss orders
Consider the broader market context and trend

Fractal Fade Pro IndicatorA revolutionary contrarian trading indicator that applies chaos theory, fractal mathematics, and market entropy to generate high-probability reverse signals. This indicator fades traditional technical signals, providing BUY signals when conventional indicators say SELL, and SELL signals when they say BUY.
Full Description:
Most traders follow the herd. QFCI does the opposite. It identifies when conventional technical analysis is about to fail by detecting mathematical patterns of exhaustion in market structure.
How It Works (Technical Overview):
The indicator combines three sophisticated mathematical approaches:
Fractal Dimension Analysis: Measures the "roughness" of price movements using fractal mathematics
Market Entropy Calculation: Quantifies the randomness and disorder in price returns using information theory
Phase Space Reconstruction: Analyzes price evolution in multi-dimensional state space from chaos theory
Signal Generation Process:
Step 1: Market Regime Detection
Chaotic Regime: High fractal complexity + rising entropy (avoid trading)
Trending Regime: Low fractal complexity + high phase space distance (fade breakouts)
Mean-Reverting Regime: Very low fractal complexity (fade extremes)
Step 2: Reverse Signal Logic
When traditional indicators would give:
BUY signal (breakout, oversold bounce, volatility spike) → QFCI shows SELL
SELL signal (breakdown, overbought rejection, volatility crash) → QFCI shows BUY
Step 3: Smart Signal Filtering
No consecutive same-direction signals
Adjustable minimum bars between signals
Multiple confirmation layers required
Unique Features:
1. Mathematical Innovation:
Original fractal dimension algorithm (not standard indicators)
Market entropy calculation from information theory
Phase space reconstruction from chaos theory
Multi-regime adaptive logic
2. Trading Psychology Advantage:
Contrarian by design - profits from market overreactions
Fades retail trader mistakes - enters when others are exiting
Reduces overtrading - strict signal frequency controls
3. Clean Visual Interface:
Only BUY/SELL labels - no chart clutter
Clear directional arrows - immediate signal recognition
Built-in alerts - never miss a trade
Recommended Settings:
Default (Balanced Approach):
Fractal Depth: 20
Entropy Period: 200
Min Bars Between Signals: 100
Aggressive Trading:
Fractal Depth: 10-15
Entropy Period: 100-150
Min Bars Between Signals: 50-75
Conservative Trading:
Fractal Depth: 30-40
Entropy Period: 300-400
Min Bars Between Signals: 150-200
Optimal Timeframes:
Primary: Daily, Weekly (best performance)
Secondary: 4-Hour, 12-Hour
Can work on: 1-Hour (with adjusted parameters)
How to Use:
For Beginners:
Apply indicator to chart
Use default settings
Wait for BUY/SELL labels
Enter on next candle open
Use 2:1 risk/reward ratio
Always use stop losses
For Advanced Traders:
Adjust parameters for your trading style
Combine with support/resistance levels
Use volume confirmation
Scale in/out of positions
Track performance by regime
Risk Management Guidelines:
Position Sizing:
Conservative: 1-2% risk per trade
Moderate: 2-3% risk per trade
Aggressive: 3-5% risk per trade (not recommended)
Stop Loss Placement:
BUY signals: Below recent swing low or -2x ATR
SELL signals: Above recent swing high or +2x ATR
Take Profit Targets:
Primary: 2x risk (minimum)
Secondary: Previous support/resistance
Tertiary: Trailing stops after 1.5x risk
IMPORTANT RISK DISCLOSURE
This indicator is for educational and informational purposes only. It is not financial advice. Past performance does not guarantee future results. Trading involves substantial risk of loss and is not suitable for every investor. The risk of loss in trading can be substantial. You should therefore carefully consider whether such trading is suitable for you in light of your financial condition.

MACD-V Multi-Timeframe Confluence DashboardThis indicator identifies high-probability trade entries by analyzing momentum alignment across multiple timeframes using the MACD-V (Volatility Normalized MACD) formula. It features a fully customizable signal engine that allows traders to specify exactly which timeframes must agree before a trade signal is generated.
Optimized Defaults
By default, the indicator is tuned to the 5-minute, 15-minute, and 1-hour timeframes. We have found this specific combination performs best for identifying robust trends while filtering out noise. However, the strategy is fully flexible—users can easily adjust these settings to fit scalping (1m/5m) or swing trading (4H/Daily) styles.
Indicator Features
Dynamic Confluence: A Buy or Sell signal (displayed as a large + on the chart) is generated only when all selected timeframes are in agreement. This ensures you are trading with the dominant trend across multiple time scales.
Alternating Signal Filter: To prevent repetitive alerts during strong trends, the script uses a smart filter: a new Buy signal will only trigger if the last confirmed signal was a Sell (and vice versa).
Live Dashboard: An on-screen table displays the real-time status of every timeframe (Trend, Curl, and MACD Value). Timeframes currently active in your strategy are highlighted in yellow.
Local Entry Arrows (Optional): The script includes smaller red/green arrows that indicate simple MACD line crosses on the current chart's timeframe. These can be useful for precise timing but can be noisy in choppy markets. These are turned off by default to keep the chart clean, but can be enabled in the "Visuals" settings if you require granular entry signals.
How to Use
Check the Dashboard: Look for the yellow-highlighted rows in the table to see which timeframes are currently driving your signals.
Wait for the Cross (+): A green + indicates bullish momentum is aligned across all your chosen timeframes.
Refine (Optional): Turn on "Show Local Arrows" if you want to see the specific moment the MACD crosses on your current timeframe to fine-tune your entry.

Dragon Flow Arrows (Smoothed LITE)🚀 DRAGON FLOW ARROWS — LITE | Smart Trend Engine + Clean Reversal Arrows
A lightweight but highly-optimized trend system designed for clean charts, powerful visual signals, and no-noise directional flow.
Built for traders who want simplicity, clarity, and professional-level momentum-filtered signals without over-complication.
🔥 Dragon Channel (Clean 3-Line Ribbon)
A smooth adaptive channel formed from ATR + EMA, giving you structural trend zones without clutter. No double bands, no messy overlaps just a clear upper/lower boundary.
✅ Dragon Flow Gradient
A horizontal, color-shifted flow:
🟢 Bull flow → green glow
🔴 Bear flow → red glow
Automatic blend based on trend direction
Smooth visual transitions (no vertical stripes)
✅ Momentum-Filtered Arrows (No Spam)
BUY/SELL arrows only print when:
Price breaks outside the Dragon Channel
Momentum confirms (RSI + MACD filters)
Trend flips → one clean arrow per direction
Text labels sit outside the channel for better readability.
✅ Smart Header Panel
At the top of your chart:
📌 Trend: Uptrend / Downtrend / Neutral
⚡ Impulse Strength: Weak / Normal / Strong
© FxShareRobots.com brand bar
Everything compact. Everything professional.
📊 How to Use
BUY Setup
Price moving above baseline
Dragon Flow turns bullish (cyan side)
Arrow appears below channel
SELL Setup
Price breaks below baseline
Dragon Flow turns bearish (magenta side)
Arrow pops above channel
Exit / Filter
Opposite arrow
Flow color shift
Trend panel flips
Works on Forex, Crypto, Stocks, Indices — all timeframes.
🆚 LITE vs PRO
Feature LITE PRO
Dragon Channel ✔ ✔ +Enhanced
Trend Panel ✔ ✔ +Multi-TF
Reversal Arrows ✔ ✔ + Confirmation
Momentum Filter ✔ ✔ +Expanded
Alerts ✖ ✔ +Full Suite
Reversal Zones ✖ ✔ +Predictive Map
Trade Strategy ✖ ✔ +Included + PDF
🔓 Upgrade to DRAGON FLOW — PRO
Unlock alerts, HTF confirmation, advanced momentum engine, and predictive reversal zones:
👉 fxsharerobots.com/itp/
❤️ If this helped your trading — please Like & Follow!
This supports future updates and keeps the LITE version source code free for the community.
Happy trading,
FxShareRobots Team

True vs False Breakout (Vol + Body Shape) **Indicator Description: True vs. False Breakout Detector**
This indicator helps identify the quality of a breakout by analyzing price action and volume.
**★ Green Arrow: "True Breakout (Strong Candle)"**
This represents a high-confidence breakout signal.
* **Criteria:** Price Breakout + Volume Surge + Strong Candle Close (minimal to no upper wick).
* **Significance:** Indicates strong bullish momentum.
**● Grey Dot: "Weak Breakout"**
Appears when price breaks resistance but shows signs of weakness.
* **Criteria:** Breakout with low volume OR a long upper wick (rejection).
* **Meaning:** "Price made a new high, but the move is untrustworthy."
* **Action:** Do not chase the long position. Be cautious and look for potential reversals.
**▼ Red Label: "False Breakout (Reversal)"**
* **Signal:** Appears when a Weak Breakout (Grey Dot) is followed by bearish price action.
* **Action:** This indicates a confirmed False Breakout and presents a prime shorting opportunity.
-------------------------------------------------------------------------------------------
★指标描述:真假突破辨别。
★绿色箭头 "真突破 (强K线)":
这是你要的完美信号。
它意味着:价格破位 + 成交量放大 + K线收盘坚决(几乎没有上影线)。
对应刚才的行情: 刚才那根1H大阳线应该会触发这个信号。
灰色圆点 "弱势突破" (新增):
如果价格突破了阻力,但是没量,或者留了长上影线(像你之前描述的那几根15分钟线),指标会标记灰色圆点。
含义: “虽然价格破了新高,但我不信任它”。这时候千万不要追多,反而要准备做空。
红色标签 "假突破 (反转)":
当灰色圆点(弱势突破)出现后,紧接着出现红色标签,就是绝佳的做空点。

Gold Sniper V21: M15 Holding MasterGold Sniper Entry (Follow Trend to enter)
My Indicator :
- Clarify the M30 in Up/Down Trend
- Only entry the trade in M1/M5 Timeframe to make a Sniper Entry.
- Indicator will show when to TP before the Trend Change

TRI - Layered Multi-Timeframe Support & ResistanceTRI - LAYERED MULTI-TIMEFRAME SUPPORT & RESISTANCE v1.0.0
DESCRIPTION:
Advanced multi-timeframe Support & Resistance indicator using ta.pivothigh/ta.pivotlow
to display pivot-based S/R levels from MULTIPLE timeframes simultaneously on your chart.
Each timeframe has its own configurable color and line width for easy visual distinction.
Features smart pivot positioning, dynamic level merging, retest detection, and comprehensive alert system.
KEY FEATURES:
Display S/R from multiple timeframes at once (15m, 1h, 4h, D, W, M)
Each timeframe has independent toggle, color, and line width
Smart timeframe filtering - never shows TFs lower than current chart
Current chart TF is always visible (cannot be disabled)
Configurable max number of higher timeframes to display
Multi-timeframe pivot detection using ta.pivothigh/ta.pivotlow on candle body
Smart pivot positioning - pivots placed on correct candle type (bullish for highs, bearish for lows)
Dynamic level merging - nearby levels merged based on ATR tolerance (newer wins)
Mitigated level tracking - broken levels shown with dashed style and configurable transparency
Price scale display - levels shown on price scale with their colors
Retest detection - identifies bounces off S/R levels (current TF only)
Comprehensive alert system with 12 alert types (current TF only)
Significant breakout detection with configurable parameters
Memory efficient - automatic cleanup of expired levels
HOW IT WORKS:
The indicator uses ta.pivothigh() and ta.pivotlow() on each enabled timeframe.
Pivot highs are positioned on bullish candles (using close price).
Pivot lows are positioned on bearish candles (using close price).
If the pivot candle is not the correct type, it searches back up to 5 candles.
Only unbreached levels are displayed as active support/resistance.
When a level is breached, it becomes a "mitigated level" with dashed styling and transparency.
Mitigation is checked only after the first candle following the pivot (to avoid false triggers).
TIMEFRAME FILTERING:
Timeframes LOWER than current chart are NEVER shown
Current chart timeframe is ALWAYS shown (cannot be disabled)
Higher timeframes respect user toggle settings
Max higher TFs setting limits how many higher TFs are displayed (default 3)
Example on 1h chart: 15m hidden, 1h always shown, 4h/D/W/M per user settings (max 3)
LEVEL MERGING:
Nearby levels of the same type AND same timeframe are automatically merged.
The newer pivot always wins, replacing older levels within the tolerance range.
Tolerance = TF ATR × Merge Tolerance setting (default 0.5 ATR).
VISUALIZATION:
Each timeframe has its own color and line width for easy distinction:
15m - Cyan, width 1
1h - Blue, width 1
4h - Orange/Gold, width 2
Daily - Green, width 2
Weekly - Purple, width 3
Monthly - Red, width 4
Active levels show as solid lines, mitigated levels as dashed lines with transparency.
Price scale shows level prices with their respective colors.
RETEST DETECTION (Current TF Only):
Detects when price tests a S/R level and bounces back. Two patterns are recognized:
Pattern 1: Single candle with long wick touching level and body moving away
Pattern 2: Previous candle touches level, current candle is reaction candle
Parameters:
ATR Tolerance - How close price must be to level (default 0.15 ATR)
Min Wick % - Minimum wick size to confirm rejection (default 30%)
ALERT SYSTEM (Current TF Only):
All alerts trigger only for levels of the current chart timeframe:
New Pivot (any/Support/Resistance) - when new pivot is detected
Breakout (any/Support/Resistance) - when level is broken with coherent candle
Significant Breakout (any/Support/Resistance) - high-quality breakouts
Retest (any/Support/Resistance) - when level is retested with bounce
SIGNIFICANT BREAKOUT CRITERIA:
A breakout is considered "significant" when:
Candle direction is coherent (bearish for support, bullish for resistance)
At least X% of the candle body crosses the level (configurable, default 50%)
Opposite wick is limited to Y% of candle range (configurable, default 30%)
SETTINGS OVERVIEW:
Global Settings - Max levels per TF, max higher TFs, pivot bars, merge tolerance
Mitigation Settings - Visibility duration, transparency
Visual Settings - Circles, labels, price scale
Timeframe Configuration - Enable/disable, color, line width for each TF
Significant Breakout - Min body cross %, max opposite wick %
Retest Detection - ATR tolerance, min wick %
Debug - Show pivot detection markers

Trinity ATR Real Move DetectorTrinity ATR Real Move Detector
This ATR Energy Table indicator is one of the simplest yet most powerful filters you can have on a chart when trading short-dated or 0DTE options or swing trades on any timeframe from 1-minute up to 4-hour. Its entire job is to answer the single most important question in intraday and swing trading: “Does the underlying actually have enough short-term explosive energy right now to make a directional position worth the theta and the spread, or is this just pretty candles that will die in ten minutes?”
Most losing 0DTE and short-dated option trades happen because people buy or sell direction on a “nice-looking” breakout or pullback while the underlying is actually in low-energy grind mode. The premium decays faster than the move develops, and you lose even when you’re “right” on direction. This little table stops that from ever happening again.
Here’s what it does in plain English:
Every bar it measures two things:
- The current ATR on whatever timeframe you are using (1 min, 3 min, 5 min, 10 min, etc.). This tells you how big the average true range of the last 14 bars has been — in other words, how violently the stock or index is actually moving right now.
- The daily ATR (14-period on the daily chart). This is your benchmark for “normal” daily movement over the last two–three weeks.
It then multiplies the daily ATR by a small number (the multiplier you set) and compares the two. If the short-term ATR is bigger than that percentage of the daily ATR, the table turns bright green and says “ENOUGH ENERGY”. If not, it stays red and says “NOT ENOUGH”.
Why this works so well:
- Real explosive moves that carry for 0DTE and 1–3 DTE options almost always show a short-term ATR spike well above the recent daily average. Quiet grind moves never do.
- The comparison is completely adaptive — on a high-vol day the threshold automatically rises, on a low-vol day it automatically drops. You never have to guess if “2 points on SPY is big today”.
- It removes emotion completely. You simply wait for green before you even think about clicking buy or sell on an option.
Key settings and what to do with them:
- Energy Multiplier — this is the only number you ever touch. It is expressed as a decimal (0.15 = 15 % of the daily ATR). Lower = more signals, higher = stricter and higher win rate. The tooltip gives you the exact sweet-spot numbers for every popular timeframe (0.09 for 1-minute scalping, 0.13 for 3-minute, 0.14–0.16 for 5-minute, 0.15–0.19 for 10-minute, etc.). Just pick your timeframe once and type the number — done forever.
- ATR Length — leave it at 14. That’s the standard and works perfectly.
- Table Position — move the table to wherever you want on the chart (top-right, bottom-right, bottom-left, top-left).
- Table Size — make the text Tiny, Small, Normal or Large depending on how much screen space you have.
How this helps you make money and stop losing it:
- On most days you will see red 80–90 % of the time — that’s good! It is forcing you to sit on your hands instead of overtrading low-energy chop that eats premium.
- When it finally flips green you know institutions are actually pushing size right now — follow-through probability jumps from ~40 % to 65–75 % depending on the stock and timeframe.
- You stop buying calls on every green candle and puts on every red candle. You only strike when the market is genuinely “awake”.
- Over a week you take dramatically fewer trades, but your win rate and average winner size go way up — which is exactly how consistent intraday option profits are made.
In short, this tiny table is the closest thing to an “edge on/off switch” that exists for short-dated options. Red = preserve capital and go do something else. Green = pull the trigger with confidence. Use it religiously and you’ll immediately feel the difference in your P&L.

RSI Pivot Breaks█ OVERVIEW
RSI Pivot Breaks is an RSI-based indicator that detects breakout events on oscillator-based pivot levels (RSI or MA RSI).
The tool automatically plots pivot levels, tracks their breakouts, highlights momentum shifts, and generates alerts for key events (pivot breaks and OB/OS crosses).
The indicator is designed primarily for momentum strategies — pivot breakouts often precede directional price moves, making RSI Pivot Breaks a powerful tool for identifying accelerations and changes in strength.
█ CONCEPTS
The indicator analyzes local RSI extremes and transforms them into dynamic support/resistance levels.
When RSI or MA RSI breaks the last pivot, it signals a shift in momentum balance, often leading to an impulse move.
Key concepts:
- pivot highs/lows detected on RSI or MA RSI,
- pivot lines extend forward until broken,
- pivot filters restrict pivot detection to specific RSI zones,
- OB/OS levels provide contextual momentum thresholds.
█ FEATURES
Pivot Detection & Breakouts
- Detection of pivot highs and lows on RSI or MA RSI.
- Pivot filters allow you to limit pivot detection to specific RSI ranges (e.g., only bullish pivots below 50 or bearish pivots above 50).
- Pivot lines update automatically after breakout.
Background highlights:
- green on pivot-high breakouts,
- red on pivot-low breakouts.
RSI & MA RSI
- Dynamic RSI colors based on momentum direction.
- Optional MA RSI line (SMA/EMA/RMA/WMA) usable as a smoother pivot source.
OB / OS Zones
- Fully adjustable overbought/oversold levels.
- Dedicated OB/OS colors.
- Optional gradient backgrounds.
Highlights
- Instant identification of moments when RSI breaks a key pivot level.
Alerts:
- pivot high breakouts.
- pivot low breakouts.
- OB crosses.
- OS crosses.
█ HOW TO USE
Add the indicator:
Indicators → RSI Pivot Breaks.
RSI Settings
- RSI Length – core RSI period.
- RSI MA Length & Type – MA RSI smoothing parameters.
Pivot Settings
- Pivot Left / Pivot Right – number of bars required to form a pivot and also the number of bars of delay before the pivot becomes confirmed.
(Higher values produce more reliable but slower pivots.)
Pivot Filters
- Minimum/maximum allowed RSI levels for pivot Highs and Lows.
- Examples:
- detect only pivot Highs at low RSI values.
- ignore pivots during extreme momentum.
- allow only mid-range pivot detection depending on strategy.
Visualization
- Toggles for RSI and MA RSI visibility.
- Optional gradients.
- Full color and transparency customization.
OB/OS Levels
- Adjustable thresholds depending on instrument volatility and strategy style.
█ SIGNAL INTERPRETATION
BUY
- RSI breaks the latest pivot high.
- RSI crosses upward out of OS.
- Context example: pivot lows forming a rising sequence.
SELL
- RSI breaks the latest pivot low.
- RSI drops downward from OB.
- Context example: pivot highs forming a declining sequence.
Trend / Momentum
- Pivot breakouts indicate acceleration or continuation of momentum.
- MA-based pivots provide smoother and more stable momentum structure.
█ APPLICATIONS
- Momentum Trading – pivot breaks as early acceleration signals.
- Scalping & Intraday – fast RSI pivots react quickly to short-term shifts.
- Swing Trading – smoother pivots using MA RSI for higher-timeframe structure.
- Divergence Detection – pivot behavior helps reveal divergence patterns, e.g.:
- RSI pivots rising while price is falling → potential early momentum reversal.
- Custom Filtering – pivot filters allow, for example:
- blocking bullish signals near OB.
- blocking bearish signals near OS.
- detecting pivots only above/below mid-range during strong trends,
depending entirely on strategy design.
█ NOTES
- Pivot detection includes natural delay equal to the Left/Right parameters.
- Pivot filters significantly change the character of signals, allowing fine-tuning of aggressiveness for any strategy.

Open Interest Z-Score [BackQuant]Open Interest Z-Score
A standardized pressure gauge for futures positioning that turns multi venue open interest into a Z score, so you can see how extreme current positioning is relative to its own history and where leverage is stretched, decompressing, or quietly re loading.
What this is
This indicator builds a single synthetic open interest series by aggregating futures OI across major derivatives venues, then standardises that aggregated OI into a rolling Z score. Instead of looking at raw OI or a simple change, you get a normalized signal that says "how many standard deviations away from normal is positioning right now", with optional smoothing, reference bands, and divergence detection against price.
You can render the Z score in several plotting modes:
Line for a clean, classic oscillator.
Colored line that encodes both sign and momentum of OI Z.
Oscillator histogram that makes impulses and compressions obvious.
The script also includes:
Aggregated open interest across Binance, Bybit, OKX, Bitget, Kraken, HTX, and Deribit, using multiple contract suffixes where applicable.
Choice of OI units, either coin based or converted to USD notional.
Standard deviation reference lines and adaptive extreme bands.
A flexible smoothing layer with multiple moving average types.
Automatic detection of regular and hidden divergences between price and OI Z.
Alerts for zero line and ±2 sigma crosses.
Aggregated open interest source
At the core is the same multi venue OI aggregation engine as in the OI RSI tool, adapted from NoveltyTrade's work and extended for this use case. The indicator:
Anchors on the current chart symbol and its base currency.
Loops over a set of exchanges, gated by user toggles:
Binance.
Bybit.
OKX.
Bitget.
Kraken.
HTX.
Deribit.
For each exchange, loops over several contract suffixes such as USDT.P, USD.P, USDC.P, USD.PM to cover the common perp and margin styles.
Requests OI candles for each exchange plus suffix pair into a small custom OI type that carries open, high, low and close of open interest.
Converts each OI stream into a common unit via the sw method:
In COIN mode, OI is normalized relative to the coin.
In USD mode, OI is scaled by price to approximate notional.
Exchange specific scaling factors are applied where needed to match contract multipliers.
Accumulates all valid OI candles into a single combined OI "candle" by summing open, high, low and close across venues.
The result is oiClose , a synthetic close for aggregated OI that represents cross venue positioning. If there is no valid OI data for the symbol after this process, the script throws a clear runtime error so you know the market is unsupported rather than quietly plotting nonsense.
How the Z score is computed
Once the aggregated OI close is available, the indicator computes a rolling Z score over a configurable lookback:
Define subject as the aggregated OI close.
Compute a rolling mean of this subject with EMA over Z Score Lookback Period .
Compute a rolling standard deviation over the same length.
Subtract the mean from the current OI and divide by the standard deviation.
This gives a raw Z score:
oi_z_raw = (subject − mean) ÷ stdDev .
Instead of plotting this raw value directly, the script passes it through a smoothing layer:
You pick a Smoothing Type and Smoothing Period .
Choices include SMA, HMA, EMA, WMA, DEMA, RMA, linear regression, ALMA, TEMA, and T3.
The helper ma function applies the chosen smoother to the raw Z score.
The result is oi_z , a smoothed Z score of aggregated open interest. A separate EMA with EMA Period is then applied on oi_z to create a signal line ma that can be used for crossovers and trend reads.
Plotting modes
The Plotting Type input controls how this Z score is rendered:
1) Line
In line mode:
The smoothed OI Z score is plotted as a single line using Base Line Color .
The EMA overlay is optionally plotted if Show EMA is enabled.
This is the cleanest view when you want to treat OI Z like a standard oscillator, watching for zero line crosses, swings, and divergences.
2) Colored Line
Colored line mode adds conditional color logic to the Z score:
If the Z score is above zero and rising, it is bright green, representing positive and strengthening positioning pressure.
If the Z score is above zero and falling, it shifts to a cooler cyan, representing positive but weakening pressure.
If the Z score is below zero and falling, it is bright red, representing negative and strengthening pressure (growing net de risking or shorting).
If the Z score is below zero and rising, it is dark red, representing negative but recovering pressure.
This mapping makes it easy to see not only whether OI is above or below its historical mean, but also whether that deviation is intensifying or fading.
3) Oscillator
Oscillator mode turns the Z score into a histogram:
The smoothed Z score is plotted as vertical columns around zero.
Column colors use the same conditional palette as colored line mode, based on sign and change direction.
The histogram base is zero, so bars extend up into positive Z and down into negative Z.
Oscillator mode is useful when you care about impulses in positioning, for example sharp jumps into positive Z that coincide with fast builds in leverage, or deep spikes into negative Z that show aggressive flushes.
4) None
If you only want reference lines, extreme bands, divergences, or alerts without the base oscillator, you can set plotting to None and keep the rest of the tooling active.
The EMA overlay respects plotting mode and only appears when a visible Z score line or histogram is present.
Reference lines and standard deviation levels
The Select Reference Lines input offers two styles:
Standard Deviation Levels
Plots small markers at zero.
Draws thin horizontal lines at +1, +2, −1 and −2 Z.
Acts like a classic Z score ladder, zero as mean, ±1 as normal band, ±2 as outer band.
This mode is ideal if you want a textbook statistical framing, using ±1 and ±2 sigma as standard levels for "normal" versus "extended" positioning.
Extreme Bands
Extreme bands build on the same ±1 and ±2 lines, then add:
Upper outer band between +3 and +4 Z.
Lower outer band between −3 and −4 Z.
Dynamic fill colors inside these bands:
If the Z score is positive, the upper band fill turns red with an alpha that scales with the magnitude of |Z|, capped at a chosen max strength. Stronger deviations towards +4 produce more opaque red fills.
If the Z score is negative, the lower band fill turns green with the same adaptive alpha logic, highlighting deep negative deviations.
Opposite side bands remain a faint neutral white when not in use, so they still provide structural context without shouting.
This creates a visual "danger zone" for position crowding. When the Z score enters these outer bands, open interest is many standard deviations away from its mean and you are dealing with rare but highly loaded positioning states.
Z score as a positioning pressure gauge
Because this is a Z score of aggregated open interest, it measures how unusual current positioning is relative to its own recent history, not just whether OI is rising or falling:
Z near zero means total OI is roughly in line with normal conditions for your lookback window.
Positive Z means OI is above its recent mean. The further above zero, the more "crowded" or extended positioning is.
Negative Z means OI is below its recent mean. Deep negatives often mark post flush environments where leverage has been cleared and the market is under positioned.
The smoothing options help control how much noise you want in the signal:
Short Z score lookback and short smoothing will react quickly, suited for short term traders watching intraday positioning shocks.
Longer Z score lookback with smoother MA types (EMA, RMA, T3) give a slower, more structural view of where the crowd sits over days to weeks.
Divergences between price and OI Z
The indicator includes automatic divergence detection on the Z score versus price, using pivot highs and lows:
You configure Pivot Lookback Left and Pivot Lookback Right to control swing sensitivity.
Pivots are detected on the OI Z series.
For each eligible pivot, the script compares OI Z and price at the last two pivots.
It looks for four patterns:
Regular Bullish – price makes a lower low, OI Z makes a higher low. This can indicate selling exhaustion in positioning even as price washes out. These are marked with a line and a label "ℝ" below the oscillator, in the bullish color.
Hidden Bullish – price makes a higher low, OI Z makes a lower low. This suggests continuation potential where price holds up while positioning resets. Marked with "ℍ" in the bullish color.
Regular Bearish – price makes a higher high, OI Z makes a lower high. This is a classic warning sign of trend exhaustion, where price pushes higher while OI Z fails to confirm. Marked with "ℝ" in the bearish color.
Hidden Bearish – price makes a lower high, OI Z makes a higher high. This is often seen in pullbacks within downtrends, where price retraces but positioning stretches again in the direction of the prevailing move. Marked with "ℍ" in the bearish color.
Each divergence type can be toggled globally via Show Detected Divergences . Internally, the script restricts how far back it will connect pivots, so you do not get stray signals linking very old structures to current bars.
Trading applications
Crowding and squeeze risk
Z scores are a natural way to talk about crowding:
High positive Z in aggregated OI means the market is running high leverage compared to its own norm. If price is also extended, the risk of a squeeze or sharp unwind rises.
Deep negative Z means leverage has been cleaned out. While it can be painful to sit through, this environment often sets up cleaner new trends, since there is less one sided positioning to unwind.
The extreme bands at ±3 to ±4 highlight the rare states where crowding is most intense. You can treat these events as regime markers rather than day to day noise.
Trend confirmation and fade selection
Combine Z score with price and trend:
Bull trends with positive and rising Z are supported by fresh leverage, usually more persistent.
Bull trends with flat or falling Z while price keeps grinding up can be more fragile. Divergences and extreme bands can help identify which edges you do not want to fade and which you might.
In downtrends, deep negative Z that stays pinned can mean persistent de risking. Once the Z score starts to mean revert back toward zero, it can mark the early stages of stabilization.
Event and liquidation context
Around major events, you often see:
Rapid spikes in Z as traders rush to position.
Reversal and overshoot as liquidations and forced de risking clear the book.
A move from positive extremes through zero into negative extremes as the market transitions from crowded to under exposed.
The Z score makes that path obvious, especially in oscillator mode, where you see a block of high positive bars before the crash, then a slab of deep negative bars after the flush.
Settings overview
Z Score group
Plotting Type – None, Line, Colored Line, Oscillator.
Z Score Lookback Period – window used for mean and standard deviation on aggregated OI.
Smoothing Type – SMA, HMA, EMA, WMA, DEMA, RMA, linear regression, ALMA, TEMA or T3.
Smoothing Period – length for the selected moving average on the raw Z score.
Moving Average group
Show EMA – toggle EMA overlay on Z score.
EMA Period – EMA length for the signal line.
EMA Color – color of the EMA line.
Thresholds and Reference Lines group
Select Reference Lines – None, Standard Deviation Levels, Extreme Bands.
Standard deviation lines at 0, ±1, ±2 appear in both modes.
Extreme bands add filled zones at ±3 to ±4 with adaptive opacity tied to |Z|.
Extra Plotting and UI
Base Line Color – default color for the simple line mode.
Line Width – thickness of the oscillator line.
Positive Color – positive or bullish condition color.
Negative Color – negative or bearish condition color.
Divergences group
Show Detected Divergences – master toggle for divergence plotting.
Pivot Lookback Left and Pivot Lookback Right – how many bars left and right to define a pivot, controlling divergence sensitivity.
Open Interest Source group
OI Units – COIN or USD.
Exchange toggles for Binance, Bybit, OKX, Bitget, Kraken, HTX, Deribit.
Internally, all enabled exchanges and contract suffixes are aggregated into one synthetic OI series.
Alerts included
The indicator defines alert conditions for several key events:
OI Z Score Positive – Z crosses above zero, aggregated OI moves from below mean to above mean.
OI Z Score Negative – Z crosses below zero, aggregated OI moves from above mean to below mean.
OI Z Score Enters +2σ – Z enters the +2 band and above, marking extended positive positioning.
OI Z Score Enters −2σ – Z enters the −2 band and below, marking extended negative positioning.
Tie these into your strategy to be notified when leverage moves from normal to extended states.
Notes
This indicator does not rely on price based oscillators. It is a statistical lens on cross venue open interest, which makes it a complementary tool rather than a replacement for your existing price or volume signals. Use it to:
Quantify how unusual current futures positioning is compared to recent history.
Identify crowded leverage phases that can fuel squeezes.
Spot structural divergences between price and positioning.
Frame risk and opportunity around events and regime shifts.
It is not a complete trading system. Combine it with your own entries, exits and risk rules to get the most out of what the Z score is telling you about positioning pressure under the hood of the market.

RSI Multi Levels kiawosch [TradingFinder] 7-14-42 Consolidation🔵 Introduction
The Relative Strength Index or RSI is a tool used to measure the speed and intensity of price movement, oscillating between zero and one hundred. It is commonly applied to identify strength or weakness in market momentum across different time intervals. Despite its simple formula and wide usage, the behavior of RSI within specific ranges often provides more precise information than traditional overbought and oversold levels.
The Multi RSI layout displays three RSI values with periods 7, 14 and 42. The seven period RSI plays the primary role in short term analysis. When this value enters predefined ranges, it shows highly consistent and interpretable behavior that can signal trend continuation, corrections or the start of a range structure. The other two values, RSI 14 and RSI 42, help reveal higher timeframe momentum and provide context for the depth and quality of price movement.
Three potential zones are defined, each representing a behavioral range. The position zones forms the basis for signal interpretation :
High Potential : 78 to 85 & 22 to 15
Mid Potential : 70 to 78 & 30 to 22
Low Potential : 58 to 62 & 42 to 38
These zones highlight areas where RSI reacts in specific ways to price movement. Entering the High Potential range usually aligns with new highs or lows in price and often precedes continuation after a correction. In contrast, reactions inside the Mid Potential range frequently appear during clean ranges or channel structures. This approach focuses on momentum quality and structural behavior rather than classic overbought and oversold thresholds.
In summary, the logic behind the signals follows three principles :
Trend continuation, When RSI 7 enters the High Potential zone and price prints a new high or low, continuation after a correction becomes the most likely outcome.
Reversal or slowdown, When RSI exits the High Potential zone while price is reaching a previous high or low, the probability of a short term reversal increases.
Range behavior, In clean ranges or channel structures, RSI 7 typically reacts inside the Mid Potential zone and produces consistent swing responses.
🔵 How to Use
This method is based on observing the repeating behavior of RSI within momentum zones and identifying moments when price continues after a shallow correction or, conversely, when signs of slowing and reversal appear. RSI 7 plays the main role since it gives the most sensitive response to short term price changes. Its entry into or exit from a potential zone, combined with the position of price relative to recent highs and lows, forms the core of the signal logic. RSI 14 and RSI 42 provide higher timeframe confirmation and help evaluate the broader strength or weakness behind each movement.
🟣 Trend continuation after entering the High Potential zone
When RSI 7 reaches the High Potential zone while price forms a new high or low, the probability of continuation becomes very high. The typical sequence includes a short correction in price and a retreat of RSI toward the Mid Potential zone. As long as price structure remains intact and RSI turns upward again, continuation becomes the most likely scenario. As shown in the charts, price often expands strongly after this type of correction and breaks the previous high.
🟣 Reversal or slowdown after exiting the High Potential zone
If RSI 7 enters the High Potential zone but then exits while price is interacting with a previous high or low, conditions for a short term reversal appear. This behavior is clear in the charts, where price hits a supply or demand area and RSI can no longer return to the upper zone. The drop in RSI reflects weakening momentum and, when accompanied by a confirming candle, increases the chance of a reversal or at least a temporary pause.
🟣 Strong reversal after hitting the Mid Potential zone during deeper corrections
Sometimes price enters a deeper corrective phase and RSI 7 moves into or through the Mid Potential zone. When this occurs near a previous low, it can mark the start of a significant reversal. The charts show this pattern clearly, where RSI turns upward while price reacts to support. If the other RSI values show relative alignment, the probability of a strong rebound increases. This signal is often seen after fast declines and can mark the beginning of a recovery wave.
🟣 Range structure and repetitive reactions inside the Mid Potential zone
When price enters a clean range or channel, the behavior of RSI 7 changes completely. In such conditions, RSI repeatedly reacts inside the Mid Potential zone. Each time price touches the upper or lower boundary of the range, RSI approaches the upper or lower part of this zone as well. The result is a sequence of predictable swing reactions, perfectly suitable for mean reversion strategies. Breakouts in these environments also tend to show higher failure rates.
🟣 Sharp reactions and fast reversals at extreme levels (RSI near 90 or below 10)
Although this approach is not based on classic overbought and oversold logic, extremely high or low RSI readings such as ninety often produce strong immediate reactions in price. These conditions usually occur after sudden spikes or emotional breakouts. As visible in the charts, RSI collapses quickly after reaching such extremes and price often reverses sharply. While not a core signal, these moments add meaningful context to momentum interpretation.
🔵 Settings
RSI Setting : This section allows enabling or disabling the three RSI values, adjusting their calculation length and customizing their colors. It is designed to help separate short, medium and longer term momentum visually on the chart.
Zones Setting : This section controls the display of momentum zones and the color applied to each area. Adjusting these colors or toggling them on and off helps the trader visually track the intensity and structure of momentum.
Levels Setting : This section allows editing the numeric boundaries of the levels or showing and hiding each one individually. These levels form the visual framework for interpreting RSI behavior within the defined momentum zones.
🔵 Conclusion
Examining RSI behavior across different momentum zones shows that entering these ranges creates relatively consistent patterns in price movement. Reaching the High Potential zone often corresponds to later stages of a trend, where price has the strength to continue after a brief correction and structure remains intact. In contrast, reactions within the Mid Potential zone occur more frequently when the market transitions into a range or a limited movement phase, where repetitive oscillations dominate.
Overall, observing RSI inside these zones helps distinguish between trending movement, corrective phases and range conditions with greater clarity. Entry or exit from each zone provides insight into the underlying strength or weakness of momentum and reveals where the market is positioned within its movement cycle. This perspective, based on momentum regions rather than traditional values alone, offers a more refined understanding of price behavior and highlights the likely direction of the next move.

Multi-Distribution Volume Profile (Zeiierman)█ Overview
Multi-Distribution Volume Profile (Zeiierman) is a flexible, structure-first volume profile tool that lets you reshape how volume is distributed across price, from classic uniform profiles to advanced statistical curves like Gaussian, Lognormal, Student-t, and more.
Instead of forcing every market into a single "one-size-fits-all" profile, this tool lets you model how volume is likely concentrated inside each bar (body vs wicks, midpoint, tails, center bias, right-skew, heavy tails, etc.) and then stacks that behavior across a whole lookback window to build a rich, multi-distribution map of traded activity.
On top of that, it overlays a dynamic Center Band (value area) and a fade/gradient model that can color each price row by volume, hits, recency, volatility, reversals, or even liquidity voids, turning a plain profile into a multi-dimensional context map.
Highlights
Choose from multiple Profile Build Modes , including uniform, body-only, wick-only, midpoint/close/open, center-weighted, and a suite of probability-style distributions (Gaussian, Lognormal, Weibull, Student-t, etc.)
Flexible anchor layout: draw the profile on Right/Left (horizontal) or Bottom/Top (vertical) to fit any chart layout
Value Area / Center Band computed from volume quantiles around the POC.
Gradient-based Fade Metrics: volume, price hits, freshness (time decay), volatility impact, dwell time, reversal density, compression, and liquidity voids
Separate bullish vs bearish volume at each price row for directional structure insights
█ How It Works
⚪ Profile Construction
The script scans a user-defined Bars Included window and finds the full high–low span of that zone. It then divides this range into a user-controlled number of Price Levels (rows).
For each historical bar within the window:
It measures the candle’s price range, body, and wicks.
It assigns volume to rows according to the selected Profile Build Mode, for example:
* Range Uniform – volume spread evenly across the full high–low range.
* Range Body Only / Range Wick Only – concentrate volume inside the body or wicks only.
* Midpoint / Close / Open Only – allocate volume entirely into one price row (pinpoint modeling).
HL2 / Body Center Weighted – center weights around the middle of the range/body.
Recent-Weighted Volume – amplify newer bars using exponential time decay.
Volume Squared (Hard) – aggressively boost bars with large volume.
Up Bars Only / Down Bars Only – filter volume to only bullish or bearish bars.
For more advanced shapes, the script uses continuous distributions across the bar’s span:
Linear, Triangular, Exponential to High
Cosine Centered, PERT
Gaussian, Lognormal, Cauchy, Laplace
Pareto, Weibull, Logistic, Gumbel
Gamma, Beta, Chi-Square, Student-t, F-Shape
Each distribution produces a weight for each row within the bar’s range, normalized so the total volume remains consistent, but the shape of where that volume lands changes.
⚪ POC & Center Band (Value Area)
Once all rows are accumulated:
The row with the highest total volume becomes the Point of Control (POC)
The script computes cumulative volume and finds the band that wraps a user-defined Center of Profile % (e.g., 68%) around the center of distribution.
This range is displayed as a central band, often treated like a value area where price has spent the most “effort” trading.
⚪ Gradient Fade Engine
Each row also gets a fade metric, chosen in Fade Metric:
Volume – opacity based on relative volume.
Price Hits – how frequently that row was touched.
Blended (Vol+Hits) – average of volume & hits.
Freshness – emphasizes recent activity, controlled by Decay.
Volatility Impact – rows that saw larger ranges contribute more.
Dwell Time – where price “camped” the longest.
Reversal Density – where direction changes cluster.
Compression – tight-range compression zones.
Liquidity Void – inverse of volume (thin liquidity zones).
When Apply Gradient is enabled, the row’s bullish/bearish colors are tinted from faint to strong based on this chosen metric, effectively turning the profile into a heatmap of your chosen structural property.
█ How to Use
⚪ Explore Different Distribution Assumptions
Switch between multiple Profile Build Modes to see how your assumptions about intrabar volume affect structure:
Use Range Uniform for classical profile reading.
Deploy Gaussian, Logistic, or Cosine shapes to emphasize central clustering.
Try Pareto, Lognormal, or F-Shape to focus on tail / extremal activity.
Use Recent-Weighted Volume to prioritize the most recent structural behavior.
This is especially useful for traders who want to test how different modeling assumptions change perceived value areas and levels of interest.
⚪ Identify Value, Acceptance & Rejection Zones
Use the POC and Center of Profile (%) band to distinguish:
High-acceptance zones – wide central band, thick rows, strong gradient → fair value areas
Rejection zones & tails – thin extremes, low dwell time, high volatility or reversal density
These regions can be used as:
Targets and origin zones for mean reversion
Context for breakout validation (leaving value)
Bias reference for intraday rotations or swing rotations
⚪ Read Directional Structure Within the Profile
Because each row is split into bullish vs bearish contributions, you can visually read:
Where buyers dominated a price region (large bullish slice)
Where sellers absorbed or defended (large bearish slice)
Combining this with Fade Metrics like Reversal Density, Dwell Time, or Freshness turns the profile into a structural order-flow map, without needing raw tick-by-tick volume data.
⚪ Use Fade Metrics for Contextual Heatmaps
Each Fade Metric can be used for a different analytical lens:
Volume / Blended – emphasize where volume and activity are concentrated.
Freshness – highlight the most recently active zones that still matter.
Volatility Impact & Compression – spot areas of explosive moves vs coiled ranges.
Reversal Density – locate micro turning points and battle zones.
Liquidity Void – visually pop out thin regions that may act as speedways or magnets.
█ Settings
Profile Build Mode – Selects how each bar’s volume is distributed across its price range (uniform, body/wick, midpoint/close/open, center-weighted, or statistical distribution families).
Bars Included – Number of bars used to build the profile from the current bar backward.
Price Levels – Vertical resolution of the profile: more levels = smoother but heavier.
Anchor Side – Where the profile is drawn on the chart: Right, Left, Bottom, or Top.
Offset (bars) – Horizontal offset from the last bar to the profile when using Right/Left modes.
Apply Gradient – Toggles the fade/heatmap coloring based on the selected metric.
Fade Metric – Chooses the property driving row opacity (Volume, Hits, Freshness, Volatility Impact, Dwell Time, Reversal Density, Compression, Liquidity Void).
Decay – Time-decay factor for Freshness (values close to 1 keep older activity relevant for longer).
Profile Thickness – Relative thickness of the profile along the time axis, as a % of the lookback window.
Center of Profile (%) – Volume percentage used to define the central band (value area) around the POC.
-----------------
Disclaimer
The content provided in my scripts, indicators, ideas, algorithms, and systems is for educational and informational purposes only. It does not constitute financial advice, investment recommendations, or a solicitation to buy or sell any financial instruments. I will not accept liability for any loss or damage, including without limitation any loss of profit, which may arise directly or indirectly from the use of or reliance on such information.
All investments involve risk, and the past performance of a security, industry, sector, market, financial product, trading strategy, backtest, or individual's trading does not guarantee future results or returns. Investors are fully responsible for any investment decisions they make. Such decisions should be based solely on an evaluation of their financial circumstances, investment objectives, risk tolerance, and liquidity needs.

